

Automated Tasmanian devil segmentation and devil facial tumour disease classification
Fatih Veysel Nurçin A * , Niyazi Şentürk A , Elbrus Imanov B , Sam Thalmann C and Karen Fagg C
A Department of Biomedical Engineering, Near East University, TRNC Mersin 10, Nicosia 99138, Turkey.
B Department of Computer Engineering, Near East University, TRNC Mersin 10, Nicosia 99138, Turkey.
C Save the Tasmanian Devil Program, Department of Natural Resources and Environment, Hobart, Tas. 7001, Australia.
Abstract
Artificial intelligence algorithms are beneficial for automating the monitoring of threatened species. Devil facial tumour disease (DFTD) is an endemic disease threatening Australia’s Tasmanian devil. The disease is a cancer that can be transmitted from one devil to another during social interactions. Cameras and trapping techniques have been employed to monitor the spread of the disease in the wild. The use of cameras allows for more frequent monitoring of devils than does trapping, but differentiating wounds from tumours in images is challenging, and this requires time and expertise.
The purpose of this work is to develop a computer vision system to assist in the monitoring of DFTD spread.
We propose a system that involves image segmentation, feature extraction, and classification steps. U-net architecture, global average pooling layer of pre-trained Resnet-18, and support vector machine (SVM) classifiers were employed for these purposes, respectively. In total, 1250 images of 961 healthy and 289 diseased (DFTD) devils were separated into training, validation, and testing sets.
The proposed algorithm achieved 92.4% classification accuracy for the differentiation of healthy devils from those with DFTD.
The high classification accuracy means that our method can help field workers with monitoring devils.
The proposed approach will allow for more frequent analysis of devils while reducing the workload of field staff. Ultimately, this automation could be expanded to other species for simultaneous monitoring at shorter intervals to facilitate broadened ecological assessments.
Keywords: classification, conservation, DFTD, ecology, segmentation, support vector machine, threatened species, U-net architecture.
Introduction
Devil facial tumour disease (DFTD) is a cancer that can transmit from one Tasmanian devil to another by biting during social interactions (Fraik et al. 2020). Cancerous tumours may be visible on the face, oral cavity and neck (Woods et al. 2018). Images of devils with DFTD were first captured unintentionally by an amateur photographer in 1996 (Hawkins et al. 2006). Development of diagnostic laboratory techniques and histopathological examination of historic samples confirmed the first case of DFTD from a sample collected in 1997 (Loh et al. 2006).
The Tasmanian devil population has declined by 80% since the discovery of DFTD (Woods et al. 2020). This decline has led to changes in the species’ ecosystem as feral cat populations have increased and quoll populations have decreased (Drawert et al. 2022). However, contrary to predictions, local extinction of devils has not occurred (Farquharson et al. 2022), and a natural immune response has been observed in some individuals (Woods et al. 2020). However, it is yet to be determined if this resistance will be sufficient to enable the wild population to recover to its pre-DFTD levels (Farquharson et al. 2022). As part of the conservation program, wild monitoring activities are undertaken, and an isolated insurance population has been established to keep healthy devils separate from those with DFTD and protect these populations from disease transmission (Rout et al. 2018).
Two methods have been employed to monitor populations and the effects of DFTD within them. The first involves the use of traps to gather health and population demographic information, including tissue collection of suspected DFTD tumours for histopathological confirmation (Save the Tasmanian Devil Program 2018). The second method utilises cameras placed to cover a predefined area, using bait and/or lure canisters to attract devils. Although it is not possible to confirm DFTD histologically via this method, it does enable visual confirmation of the presence of tumours, which likely indicate the presence of DFTD. The advantage of using camera traps is that they are more likely to observe a larger number of Tasmanian devils than are other methods (Woods et al. 2018). The biggest challenge with this method is that it can be difficult to differentiate a DFTD tumour from fresh lumpy wounds and old wounds from scar tissue in the images analysed. This may even be impossible when the tumour is in the oral cavity (Woods et al. 2018). The detection of Tasmanian devils with DTFD by any method remains a challenge, considering that not all devils in a specific area are sampled (Bode et al. 2009).
Computer vision applications have been employed in ecology for various descriptive, identification, and counting tasks (Weinstein 2018). For example, Marburg and Bigham (2016) used images captured on the Pacific continental shelf to identify classes of microfauna present using three convolutional neural network (CNN) models, and Willi et al. (2019) used two CNN models to distinguish images that included an animal from empty images and then identify the animal species in given images. In addition to identifying species in the Snapshot Serengeti database, which has 3.2 million images of 48 species, Norouzzadeh et al. (2018) used the images to analyse the counts and behaviour of animals. Deep learning models employed to detect symptoms of human disease have been adapted to ecological problems (Christin et al. 2019). For example, in a study by Kälin et al. (2019), tree defoliation was predicted using a regression CNN model that treated defoliation as a continuous variable. Corresponding defoliation values were assessed by experts in images of defoliated trees to train the CNN. Another study used dynamic background modelling to generate regional proposals for an object of interest in an image, with cross-frames applied to reduce the number of proposals. This was coupled with a CNN model to reduce computational complexity (Yousif et al. 2017). Moreover, two CNN architectures were employed by Miao et al. (2019) to identify 20 African wildlife species based on a set of classification features. This analysis revealed that although CNN could localise animals in most images, it was difficult to find features that distinguished species and thus achieve high accuracy. CNN architectures have also been employed to identify individuals. For example, Shi et al. proposed a nine-layer CNN architecture to identify individual tigers based on their stripes (Shi et al. 2020). Rather than using algorithmic localisation, they cropped some images using a predefined rectangle, and some manually. In another study, Shi et al. (2023) localised different parts of tigers and leopards with a CNN-based object detector. Later, they used CNNs and multi-layer perceptron (MLP) models to classify individual tigers and leopards (Shi et al. 2023).
In this study, we followed a two-stage pipeline, which is common in the literature. First, devils were isolated from the background in images using a segmentation step to remove irrelevant details via the U-net architecture (Ronneberger et al. 2015). Second, a feature extractor combined with a classifier was used to classify devils as healthy or suffering from DFTD. Thus, the classification task employed a CNN as a feature extractor combined with a support vector machine (SVM) after segmentation. This approach is especially beneficial in the case of a small number of samples; for example, it was employed to classify COVID-19 in 306 chest X-ray images (Novitasari et al. 2020).
We chose these steps because of the nature of our data. Images used in this study were captured at night, when devils are active, and objects may easily blend into each other. Therefore, we first had to isolate devils from the background. In the segmentation step, all data could be used for this purpose regardless of the devil’s health situation. We had more images of healthy devils than those with DFTD. Second, we chose a feature extractor combined with a shallow learning classifier to allow us to use fewer samples because we had a class imbalance problem. In this way, we were able to equalise the number of images of classes by using an equal number of healthy devils and those with DFTD.
We propose an automated detection system based on machine learning systems. With the help of automated classification, the labour required for reviewing and cataloguing images can be reduced, and more images can be analysed. This will enable monitoring frequency to be increased, which will improve the monitoring of devils and the disease.
Material and methods
The proposed algorithm involves the segmentation of devils followed by the classification of devils according to their DFTD status. The U-net architecture was implemented in Google Colab for segmentation purposes. A training set was used to train the U-net model, and a validation set was used to monitor accuracy and prevent overfitting. The model was used to segment devils from test images. Later, the Resnet-18 pre-trained network was utilised as a feature extractor to extract image features from segmented devils. Extracted features for a total of 250 devils were used to train several SVM classifiers. Matlab 2020a was employed for pre-trained feature extractor and SVM classifiers.
Dataset
The 1250 mages used in this study were captured by the Save the Tasmanian Devil Program from many locations across mainland Tasmania and the Forestier Peninsula. Excess meat or whole animal carcasses obtained to feed captive devils is occasionally used by monitoring staff as bait to attract wild devils to camera locations. This material is sourced from professional shooters operating under crop-protection laws; therefore, animal ethics approval was not required.
Images were captured using Sony DSC-W190 and Sony DSC-W55 cameras with a size of 4000 × 3000 and 3072 × 2304 pixels, respectively. Images of healthy devils (n = 961) were from the depopulated and reintroduced disease-free population on the Forestier Peninsula (Rout et al. 2018). Those of devils with DTFD (n = 289) were identified by Save the Tasmanian Devil Program staff following visual classification from images captured in mainland locations.
For our analysis, all original images were resized to 256 × 256 pixels in grayscale format and separated into 800, 200, and 250 images for the training, validation, and testing sets, respectively. Testing data consisted of 125 healthy and 125 diseased devils. These healthy and diseased devil testing images were arbitrarily picked from the label to which they belonged and were separated initially, and training and validation images were randomly shuffled at every training. Later, data augmentation techniques were applied to the training and validation set while the testing set remained untouched.
Segmentation
The first step of the algorithm employs a deep learning architecture to segment Tasmanian devils from the image background. Input images and their corresponding output labels were used to train the network. The output label is the mask where the Tasmanian devil is labelled as foreground and the remaining objects as background.
This architecture is composed of two parts: a contracting and an expansive path. There is symmetry between layers of contracting and expansive paths. The contracting path has a series of convolutional layers and pooling to downsample feature maps while increasing the number of feature maps. The expansive path has a series of upsampling and convolutional layers. The contracting and expansive paths are connected to each other by skip connections. The expansive path repeatedly increases resolution while acquiring high-resolution features from the contracting path with skip connections. The output is a mask that separates the Tasmanian devil from the background once a model is trained (Ronneberger et al. 2015). The architecture is illustrated in Fig. 1.

Data augmentation is a complementary step in the case of a small number of samples where it teaches desired invariance and robustness to the model. A small number of samples can also result from the difficulty of labelling, which might be a time-consuming task. For the U-net segmentation part, several augmentation techniques were applied to training and validation images as shear, zoom, rotation, and horizontal flip. These augmentation techniques were applied to the input image and its corresponding output mask.
The model was trained with a batch size of 128 for 4000 epochs. ‘Adam’ was employed as an optimiser, with a learning rate of 0.001 (Kingma and Ba 2015).
Feature extraction
Resnet-18 is a residual network with a depth of 18 layers. The pre-trained version is trained with more than a million images corresponding to 1000 categories on the ImageNet database (Krizhevsky et al. 2017). The simplified architecture of Resnet-18 (Pre-trained network) is illustrated in Fig. 2. The batch normalisation is repeated after each convolution and before applying the rectified linear unit (ReLU) activation function. A series of convolutional layers and shortcut connections constitute the residual part of the network. The network ends with the global average pooling layer followed by a fully connected layer for 1000 classes, softmax, and a classification layer (He et al. 2016).
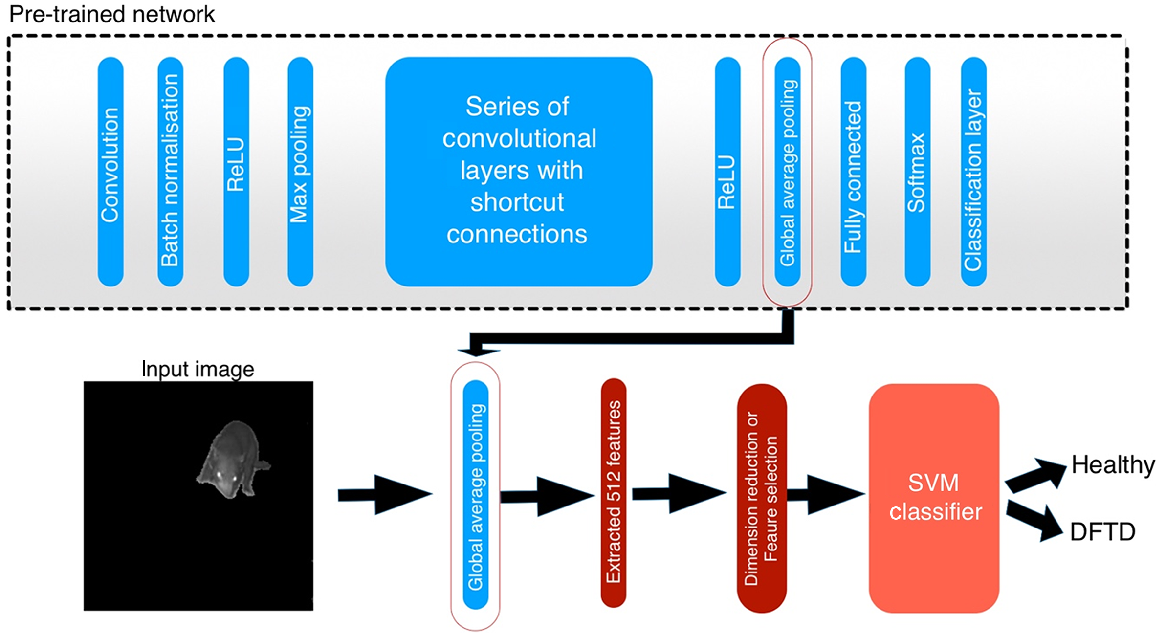
We used the network’s global average pooling layer to extract features from segmented Tasmanian devil images – 512 features for each image from a total of 250 images. The average 2D pooling layer of Resnet-50 was also used for comparative purposes; it produced 2048 features (He et al. 2016), which were also used to train SVM classifiers.
Dimension reduction and feature selection
Principal component analysis (PCA) and feature selection methods were employed to reduce the number of features (Abdi and Williams 2010). Univariate feature ranking using chi-square tests and neighbourhood component analysis was used for feature selection (Yang et al. 2012; Laborda and Ryoo 2021).
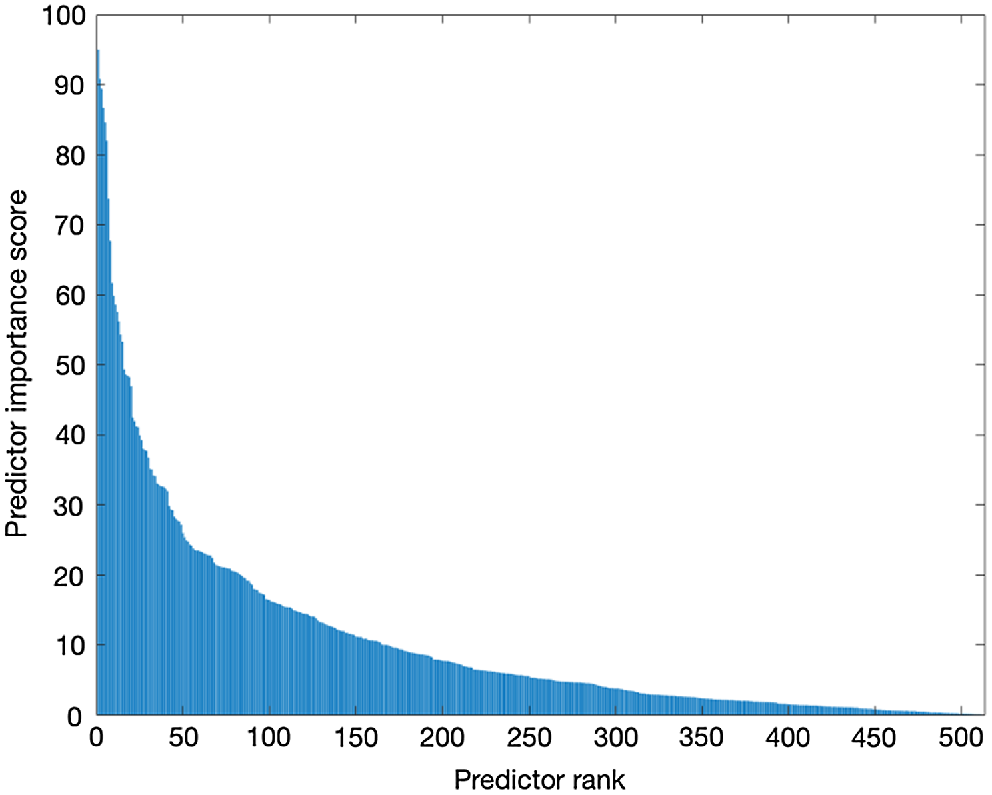
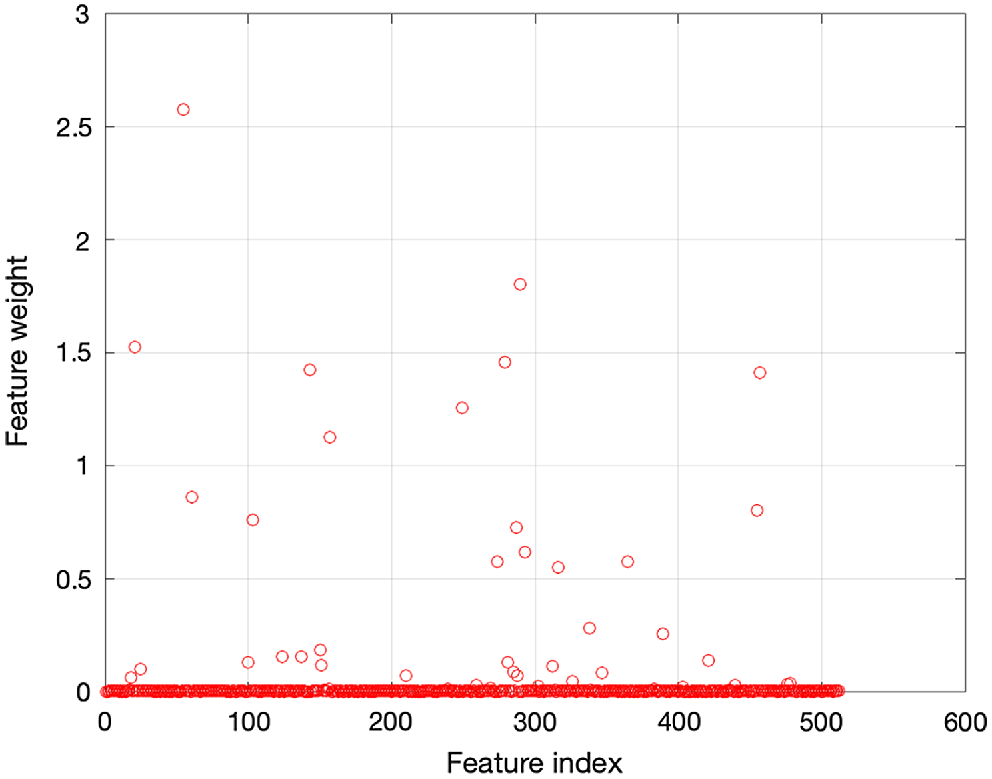
The chi-square tests were used to rank the 512 features, as illustrated in Fig. 3. Features above the ‘10’ predictor importance score were selected, resulting in 31 features. A neighbourhood component analysis was also employed to weigh the features. Features with weights of more than 0.005 were chosen, resulting in 47 features. All the features and their weights are shown in Fig. 4. Finally, PCA was employed as a dimension reduction method, with 95% explained variance, and the number of features reduced to 91.
Classifier
The SVM binary learner is a very popular machine-learning algorithm with a variety of kernels. The error-correcting output codes (ECOC) model extends its ability to multi-class problems (Escalera et al. 2010). SVM is employed in the proposed work for classification purposes because of the high number of features (512) and because it is robust when there is a higher number of features than samples (Pisner and Schnyer 2020).
SVM classifiers with cubic, linear, and quadratic kernels were used to classify devils as DFTD or healthy. The performance of SVM classifiers was evaluated by 10-fold cross-validation. We also separated the data into 150 and 100 images for training and testing the ECOC model using SVM, respectively.
Evaluation
Segmentation was evaluated using the Jaccard similarity index, otherwise known as intersection over union. The similarity between the predicted segmentation and ground truth is computed as:
where A and B denote the predicted image and the ground truth, respectively. The goal of segmentation is pixel classification. Therefore, a common loss function for binary classification, binary cross-entropy, was employed.
The Jaccard similarity index and binary cross-entropy loss function can be combined to generalise the loss function. In this way, the minimisation of loss maximises the probability of the right pixels being predicted (Iglovikov and Shvets 2018).
Results
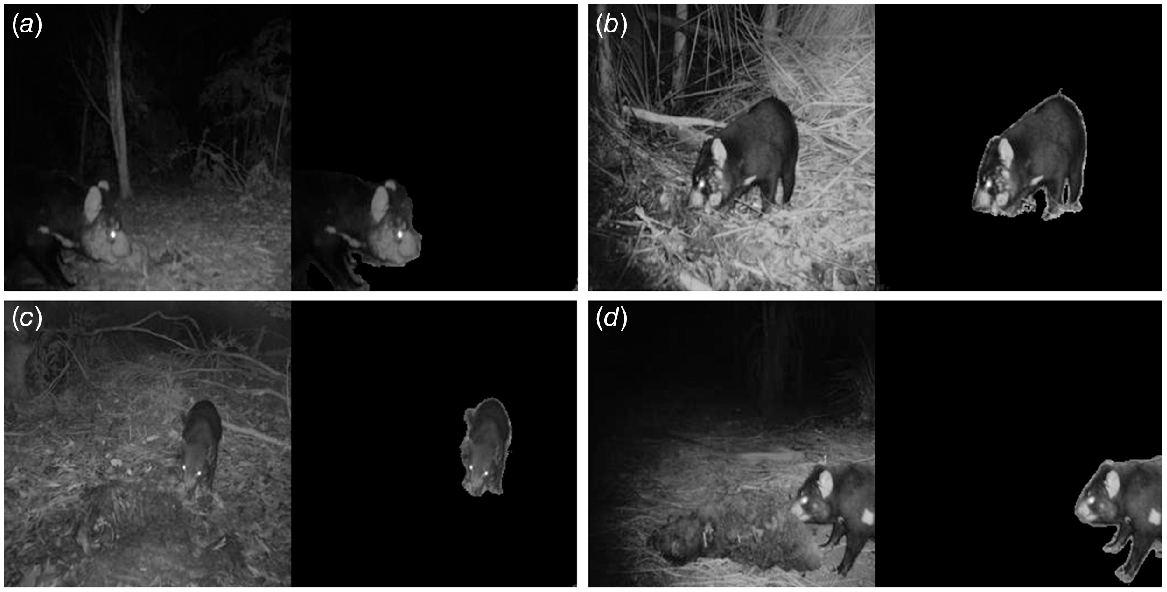
The network reached the best validation loss at the 3545th epoch over 4000 with a value of 0.01448. The model achieved an 88.28% Jaccard similarity index on 250 testing images. The segmentation results are shown in Fig. 5. The classification results with no feature reduction/selection are illustrated in Table 1. Cubic SVM achieved the highest accuracy with a value of 91.6%.
(a, b) Segmentation of a devil with DFTD at the top left and right. (c, d) Segmentation of devils with no visible symptom at the bottom left and right.
| Classifier | Accuracy (%) | |
|---|---|---|
| Linear SVM | 85.6 | |
| Cubic SVM | 91.6 | |
| Quadratic SVM | 89.6 | |
| Medium Gaussian SVM | 88.8 | |
| ECOC model using SVM | 89.0 |
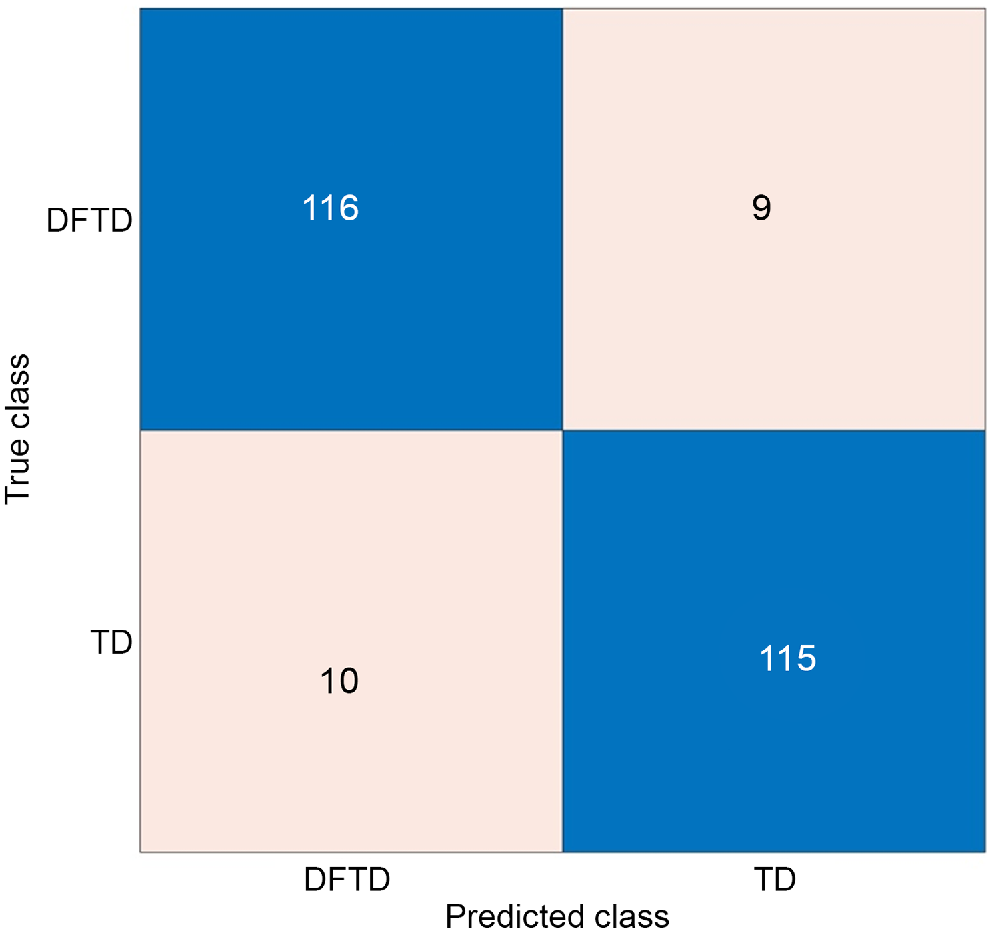
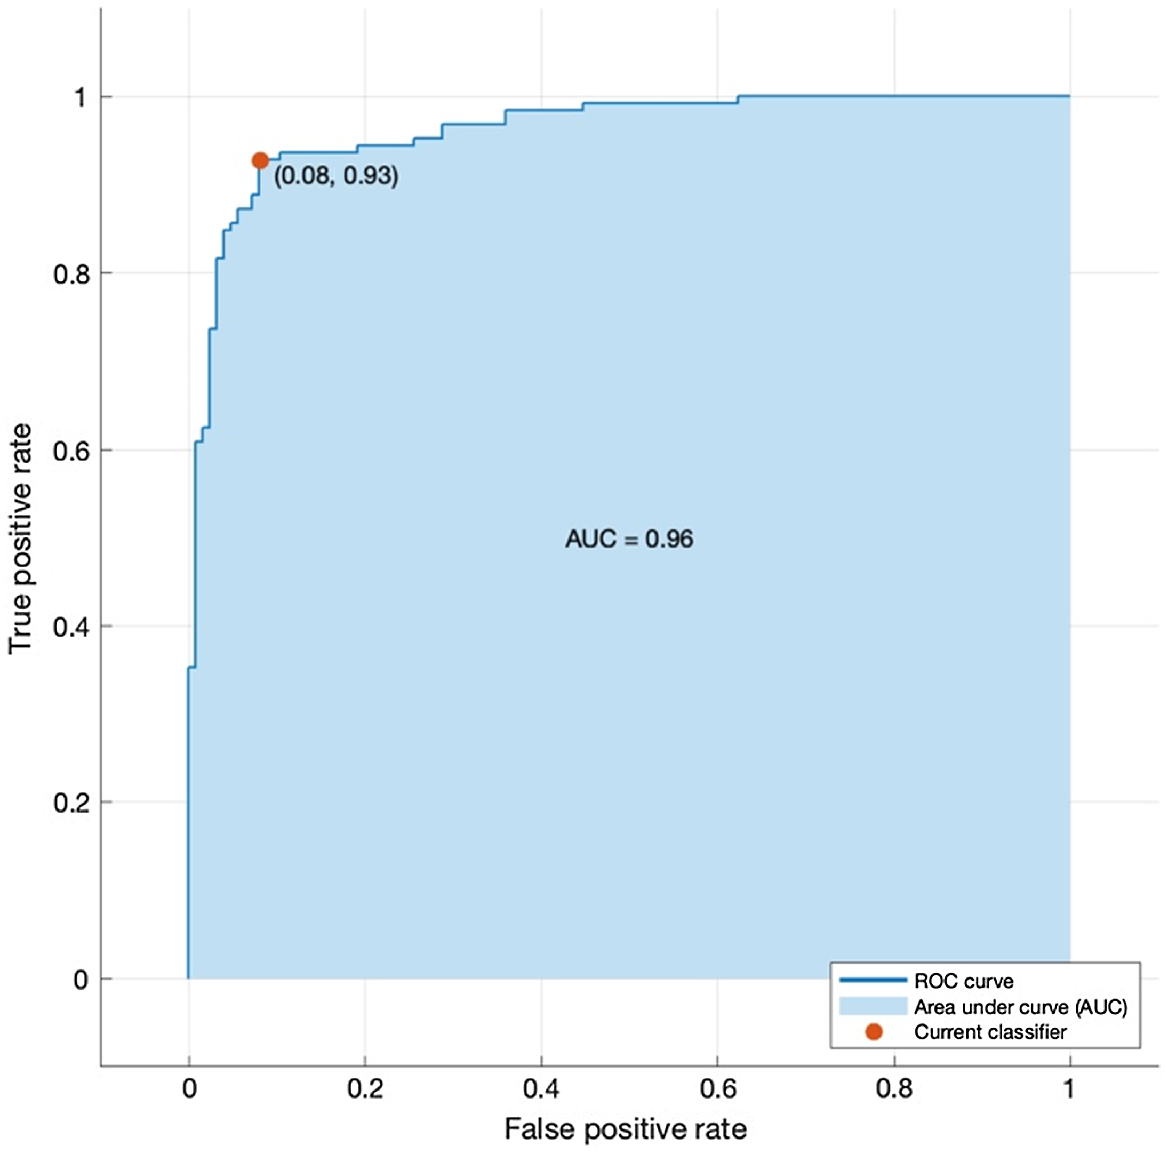
Classifiers trained with fewer features with the use of PCA, neighbourhood component analysis, and univariate feature ranking using chi-square tests are illustrated in Tables 2, 3, and 4, respectively. Here, neighbourhood component analysis combined with medium Gaussian SVM yielded the highest accuracy, at 92.4%. The confusion matrix for this model is illustrated in Fig. 6. The area under the receiver operator characteristic (ROC) curve (AUC) was used to further validate the performance of the model, which resulted in 0.96 AUC, as shown in Fig. 7.
| Classifier | Accuracy (%) | |
|---|---|---|
| Linear SVM | 81.2 | |
| Cubic SVM | 86.0 | |
| Quadratic SVM | 85.2 | |
| Medium Gaussian SVM | 85.6 |
| Classifier | Accuracy (%) | |
|---|---|---|
| Linear SVM | 80.4 | |
| Cubic SVM | 90.4 | |
| Quadratic SVM | 89.6 | |
| Medium Gaussian SVM | 92.4 |
| Classifier | Accuracy (%) | |
|---|---|---|
| Linear SVM | 80.0 | |
| Cubic SVM | 86.8 | |
| Quadratic SVM | 87.2 | |
| Medium Gaussian SVM | 83.2 |
Confusion matrix of the best model where TD indicates healthy Tasmanian devils and DFTD indicates Tasmanian devils with facial tumours.
Comparison with an end-to-end CNN architecture
End-to-end CNN models utilised for classification usually require more than 1000 images. In our case, we had images of 961 healthy and 289 diseased (DFTD) devils, which introduced a class imbalance problem. We mitigated this by using 125 healthy and 125 diseased devil features in the classification task, because SVM classifiers perform well with a relatively small number of samples. For comparison, we also used an end-to-end CNN model (Xception) with all data available and separated as 70%, 15%, and 15% for training, validation, and testing, respectively (Chollet 2017). Additionally, random flip, random rotation, and random zoom were applied to training and validation images. Note that by using all data available, we had a class imbalance problem. Therefore, the AUC was used as a metric for training the model, as is common for class-imbalanced tasks. Furthermore, Keras-tuner was used to determine the learning rate, which was found to be 0.0001 automatically. The model was trained for 100 epochs, and the best validation AUC was achieved at the 85th epoch. The model achieved 0.94 AUC on the testing set, and the proposed algorithm achieved 0.96 AUC.
Comparison with different feature extractor replacement
For comparative purposes, we replaced the Resnet-18 feature extractor with the Resnet-50 feature extractor and fed the features into SVM classifiers. The highest accuracy among these SVM classifiers was achieved with the cubic SVM. The Resnet-50 feature extractor combined with the cubic SVM classifier achieved 90.08% accuracy. This performed less well than the Resnet-18 with cubic SVM classifier, which performed with 91.6% accuracy.
Discussion
An automated approach to devil classification may allow for increased capacity to analyse devil images with a reduced workload and time commitment from field monitoring staff. To this end, we proposed a two-stage pipeline composed of segmentation and classification steps.
The proposed segmentation algorithm achieved an 88.28% Jaccard similarity index. The segmentation results show that whole carcasses of wallaby or possum utilised as bait – which can resemble devils because they are fur covered – were segmented as part of the background, as were other irrelevant objects such as trees, leaves, and ground litter.
Medium Gaussian SVM combined with the neighbourhood component analysis feature selection method yielded the highest accuracy (92.4%) among the tested SVM classifiers. The ECOC model using SVM achieved 89.0% accuracy. Even though the ECOC model did not achieve the best accuracy among the SVM classifiers, it should be considered in future studies because it enables multi-class classification. For example, it could be used for assessment of the severity of DFTD. It could also be used for wider classification tasks, including the classification of multiple species captured by these cameras.
The training and validation of U-net were not affected by having an unbalanced number of images (961 healthy and 289 diseased (DFTD) devils), because the task for the segmentation model was to learn how to distinguish devils from the background regardless of their health condition. However, the testing data consisted of 125 healthy and 125 diseases devils to provide balanced data for the classifier. The availability of more data will enable the use of state-of-the-art transfer learning models, which usually perform better on larger datasets. Although we segmented the whole body of devils for the classification of DFTD, just the head could be segmented in future studies because this is where the disease is primarily evident. Such research would enable assessment of the possibility of improved accuracy.
Individual identification of devils can also be explored in future work to enable counting individuals from images, resulting in a population estimate (Weinstein 2018; Shi et al. 2023). Devils tend to have a unique combination of white pelage markings on their chest, shoulders and rump area, which makes individual identification possible, although 13% of devils are completely black (Pemberton and Renouf 1993). Further development of automated classification to identify individuals via pelage markings would be beneficial.
In this study, we focused on monitoring Tasmanian devils. However, other species captured during the devil camera monitoring program may be listed as threatened under the Tasmanian Threatened Species Protection Act 1995 and/or Federal Environment Protection and Biodiversity Conservation Act 1999. These include the spotted-tailed quoll, eastern quoll, wedge-tailed eagle and white-bellied sea eagle (Department of Natural Resources and Environment 2023). Camera trap image data for these species, as well as devils, could be used to create a wider dataset to train computer vision systems to monitor multiple species simultaneously. This will enable population and density trends in the various species to be monitored more easily and enable prompt conservation action to address any population declines identified.
Conclusions
In this study, images taken from the Save the Tasmanian Devil Program were used to train U-net architecture for segmentation. Data augmentation methods were employed for the relatively small number of samples. Once training was completed, the model was used on testing data to segment images of devils, distinguishing them from the background. The pre-trained Resnet-18 was used to extract features from the segmented images. These features were used in SVM for classification, with 92.4% accuracy. It was shown that the proposed approach was able to identify devils presenting with the physical manifestations of DFTD with a very high accuracy. To the best of our knowledge, this is the first work to classify DFTD using camera images in an automated way.
Acknowledgements
Thanks to the Save the Tasmanian Devil Program for the support and survey images used in the automation program.
References
Abdi H, Williams LJ (2010) Principal component analysis. Wiley Interdisciplinary Reviews: Computational Statistics 2, 433-459.
| Crossref | Google Scholar |
Bode M, Hawkins C, Rout T, Wintle B (2009) Efficiently locating conservation boundaries: Searching for the Tasmanian devil facial tumour disease front. Biological Conservation 142, 1333-1339.
| Crossref | Google Scholar |
Christin S, Hervet É, Lecomte N (2019) Applications for deep learning in ecology. Methods in Ecology and Evolution 10, 1632-1644.
| Crossref | Google Scholar |
Department of Natural Resources and Environment (2023) Threatened species–vertebrates. Tasmanian Government. Available at https://nre.tas.gov.au/conservation/threatened-species-and-communities/lists-of-threatened-species/threatened-species-vertebrates [Accessed 23 February 2023]
Drawert B, Matthew S, Powell M, Rumsey B (2022) Saving the devils is in the details: Tasmanian devil facial tumor disease can be eliminated with interventions. Letters in Biomathematics 9, 121-140 Available at https://lettersinbiomath.journals.publicknowledgeproject.org/index.php/lib/article/view/555.
| Google Scholar |
Escalera S, Pujol O, Radeva P (2010) On the decoding process in ternary error-correcting output codes. IEEE Transactions on Pattern Analysis and Machine Intelligence 32, 120-134.
| Crossref | Google Scholar |
Farquharson KA, McLennan EA, Cheng Y, Alexander L, Fox S, Lee AV, Belov K, Hogg CJ (2022) Restoring faith in conservation action: maintaining wild genetic diversity through the Tasmanian devil insurance program. iScience 25, 104474.
| Crossref | Google Scholar |
Fraik AK, Margres MJ, Epstein B, Barbosa S, Jones M, Hendricks S, Schönfeld B, Stahlke AR, Veillet A, Hamede R, McCallum H, Lopez-Contreras E, Kallinen SJ, Hohenlohe PA, Kelley JL, Storfer A (2020) Disease swamps molecular signatures of genetic-environmental associations to abiotic factors in Tasmanian devil (Sarcophilus harrisii) populations. Evolution 74, 1392-1408.
| Crossref | Google Scholar |
Hawkins CE, Baars C, Hesterman H, Hocking GJ, Jones ME, Lazenby B, Mann D, Mooney N, Pemberton D, Pyecroft S, Restani M, Wiersma J (2006) Emerging disease and population decline of an island endemic, the Tasmanian devil Sarcophilus harrisii. Biological Conservation 131, 307-324.
| Crossref | Google Scholar |
Iglovikov V, Shvets A (2018) TernausNet: U-net with VGG11 encoder pre-trained on ImageNet for image segmentation. arXiv https://doi.org/10.48550/arXiv.1801.05746.
| Google Scholar |
Kälin U, Lang N, Hug C, Gessler A, Wegner JD (2019) Defoliation estimation of forest trees from ground-level images. Remote Sensing of Environment 223, 143-153.
| Crossref | Google Scholar |
Kingma DP, Ba JL (2015) Adam: a method for stochastic optimization. arXiv https://doi.org/10.48550/arXiv.1412.6980.
| Google Scholar |
Krizhevsky A, Sutskever I, Hinton GE (2017) ImageNet classification with deep convolutional neural networks. Communications of the ACM 60, 84-90.
| Crossref | Google Scholar |
Laborda J, Ryoo S (2021) Feature selection in a credit scoring model. Mathematics 9, 746-23.
| Crossref | Google Scholar |
Loh R, Bergfeld J, Hayes D, O’Hara A, Pyecroft S, Raidal S, Sharpe R (2006) The pathology of devil facial tumor disease (DFTD) in Tasmanian Devils (Sarcophilus harrisii). Veterinary Pathology 43, 890-895.
| Crossref | Google Scholar |
Miao Z, Gaynor KM, Wang J, Liu Z, Muellerklein O, Norouzzadeh MS, McInturff A, Bowie RC, Nathan R, Yu SX, Getz WM (2019) Insights and approaches using deep learning to classify wildlife. Scientific Reports 9, 8137.
| Crossref | Google Scholar |
Norouzzadeh MS, Nguyen A, Kosmala M, Swanson A, Palmer MS, Packer C, Clune J (2018) Automatically identifying, counting, and describing wild animals in camera-trap images with deep learning. Proceedings of the National Academy of Sciences of the United States of America 115, E5716-E5725.
| Crossref | Google Scholar |
Novitasari DC, Hendradi R, Caraka RE, Rachmawati Y, Fanani NZ, Syarifudin A, Toharudin T, Chen RC (2020) Detection of COVID-19 chest x-ray using support vector machine and convolutional neural network. Communications in Mathematical Biology and Neuroscience 2020, 1-19.
| Crossref | Google Scholar |
Nurçin FV, Imanov E (2021) Segmentation of overlapping red blood cells for malaria blood smear images by U-net architecture. Journal of Medical Imaging and Health Informatics 11, 2190-2193.
| Crossref | Google Scholar |
Pemberton D, Renouf D (1993) A field-study of communication and social-behavior of the Tasmanian devil at feeding sites. Australian Journal of Zoology 41, 507-526.
| Crossref | Google Scholar |
Ronneberger O, Fischer P, Brox T (2015) U-net: convolutional networks for biomedical image segmentation. In ‘International conference on medical image computing and computer-assisted intervention’. (Eds N Navab, J Hornegger, W Wells, A Frangi) pp. 234–241. (Springer International Publishing: Munich, Germany)
Rout TM, Baker CM, Huxtable S, Wintle BA (2018) Monitoring, imperfect detection, and risk optimization of a Tasmanian devil insurance population. Conservation Biology 32, 267-275.
| Crossref | Google Scholar |
Save the Tasmanian Devil Program (2018) Annual monitoring project: 2018 summary report. Tasmanian Government. Available at https://dpipwe.tas.gov.au/Documents/STDP%20Annual%20Monitoring%20Project%202018%20Summary%20Report.pdf [Accessed 16 February 2021]
Shi C, Liu D, Cui Y, Xie J, Roberts NJ, Jiang G (2020) Amur tiger stripes: Individual identification based on deep convolutional neural network. Integrative Zoology 15, 461-470.
| Crossref | Google Scholar |
Shi C, Xu J, Roberts NJ, Liu D, Jiang G (2023) Individual automatic detection and identification of big cats with the combination of different body parts. Integrative Zoology 18, 157-168.
| Crossref | Google Scholar |
Weinstein BG (2018) A computer vision for animal ecology. Journal of Animal Ecology 87, 533-545.
| Crossref | Google Scholar |
Willi M, Pitman RT, Cardoso AW, Locke C, Swanson A, Boyer A, Veldthuis M, Fortson L (2019) Identifying animal species in camera trap images using deep learning and citizen science. Methods in Ecology and Evolution 10, 80-91.
| Crossref | Google Scholar |
Woods GM, Fox S, Flies AS, Tovar CD, Jones M, Hamede R, Pemberton D, Lyons AB, Bettiol SS (2018) Two decades of the impact of Tasmanian devil facial tumor disease. Integrative and Comparative Biology 58, 1043-1054.
| Crossref | Google Scholar |
Woods GM, Lyons AB, Bettiol SS (2020) A devil of a transmissible cancer. Tropical Medicine and Infectious Disease 5, 50-10.
| Crossref | Google Scholar |
Yang W, Wang K, Zuo W (2012) Fast neighborhood component analysis. Neurocomputing 83, 31-37.
| Crossref | Google Scholar |