

Hybridisation rates, population structure, and dispersal of sambar deer (Cervus unicolor) and rusa deer (Cervus timorensis) in south-eastern Australia
Erin Hill A B , Nicholas Murphy A C , Scarlett Li-Williams D , Christopher Davies E , David Forsyth F , Sebastien Comte F , Lee Ann Rollins D , Fiona Hogan G , Faye Wedrowicz G , Troy Crittle H , Elaine Thomas I , Luke Woodford J and Carlo Pacioni J K *
A Department of Environment and Genetics, La Trobe University, Melbourne, Vic., Australia.
B CSIRO Health and Biosecurity, Canberra, ACT, Australia.
C La Trobe University, Research Centre for Future Landscapes, Melbourne, Vic., Australia.
D The University of New South Wales, Evolution & Ecology Research Centre, School of Biological, Earth and Environmental Sciences, Sydney, NSW 2052, Australia.
E Parks Victoria, 65 Church Street, Morwell, Vic. 3840, Australia.
F Vertebrate Pest Research Unit, NSW Department of Primary Industries, 1447 Forest Road, Orange, NSW 2800, Australia.
G Federation University Australia, Institute of Innovation, Science and Sustainability, Churchill, Vic., Australia.
H NSW Department of Primary Industries, Biosecurity and Food Safety, 4 Marsden Park Road, Calala, NSW 2340, Australia.
I Parks Victoria, Kiewa Valley Highway, Mount Beauty, Vic. 3699, Australia.
J Department of Environment, Land, Water and Planning, Arthur Rylah Institute for Environmental Research, Heidelberg, Vic. 3084, Australia.
K Environmental and Conservation Sciences, Murdoch University, Perth, WA, Australia.
Wildlife Research 50(9) 669-687 https://doi.org/10.1071/WR22129
Submitted: 15 July 2022 Accepted: 23 February 2023 Published: 6 July 2023
© 2023 The Author(s) (or their employer(s)). Published by CSIRO Publishing. This is an open access article distributed under the Creative Commons Attribution-NonCommercial-NoDerivatives 4.0 International License (CC BY-NC-ND)
Abstract
Context: Introduced populations of sambar deer (Cervus unicolor) and rusa deer (Cervus timorensis) are present across south-eastern Australia and are subject to local population control to alleviate their negative impacts. For management to be effective, identification of dispersal capability and management units is necessary. These species also readily hybridise, so additional investigation of hybridisation rates across their distributions is necessary to understand the interactions between the two species.
Aims: Measure the hybridisation rate of sambar and rusa deer, assess broad-scale population structure present within both species and identify distinct management units for future population control, and measure the likely dispersal capability of both species.
Methods: In total, 198 sambar deer, 189 rusa deer, and three suspected hybrid samples were collected across Victoria and New South Wales (NSW). After sequencing and filtering, 14 099 polymorphic single-nucleotide polymorphism (SNP) markers were retained for analysis. Hybridisation rates were assessed before the data were split by species to identify population structure, diversity indices, and dispersal distances.
Key results: Across the entire dataset, 17 hybrids were detected. Broad-scale population structure was evident in sambar deer, but not among the sites where rusa deer were sampled. Analysis of dispersal ability showed that a majority of deer movement occurred within 20 km in both species, suggesting limited dispersal.
Conclusions: Distinct management units of sambar deer can be identified from the dataset, allowing independent population control. Although broad-scale population structure was not evident in the rusa deer populations, dispersal limits identified suggest that rusa deer sites sampled in this study could be managed separately. Sambar × rusa deer hybrids are present in both Victoria and NSW and can be difficult to detect on the basis of morphology alone.
Implications: Genetic analysis can identify broad-scale management units necessary for population control, and estimates of dispersal capability can assist in delineating management units where broad-scale population structure may not be apparent. The negative impacts associated with hybridisation require further investigation to determine whether removal of hybrids should be considered a priority management aim.
Keywords: connectivity, dispersal, hybridisation, invasive species, management units, non-native deer, pest species, wildlife management.
Introduction
The global desirability of deer as a hunting resource has prompted both historical introductions outside of their native range and contemporary anthropogenic movements of deer across landscapes (Dolman and Wäber 2008). As the abundance and distribution of non-native deer populations increase, their negative environmental, economic, and social impacts also increase (Davis et al. 2016; Honda et al. 2018; Cripps et al. 2019; Hampton and Davis 2020). In Australia, deer were first released in the 19th century, predominantly by Acclimatisation Societies, with some of these introductions establishing self-sustaining wild populations (Bentley 1998; Moriarty 2004). Today, the following six deer species are present in Australia: sambar deer (Cervus unicolor), fallow deer (Dama dama), red deer (Cervus elaphus), rusa deer (Cervus timorensis), chital deer (Axis axis), and hog deer (Axis porcinus). Deer populations have not been considered high priorities for control in Australia until the past decade (Bomford and Hart 2002; Davis et al. 2016; Forsyth et al. 2017). Now, most States and Territories list deer as a pest species (Davis et al. 2016), with localised management undertaken for all six deer species to reduce their abundances and limit range expansions. Despite these efforts, the abundance and distribution of many of these species and their undesirable impacts continue to increase (Bennett and Coulson 2010; Davis et al. 2010; Forsyth et al. 2015; Roberts et al. 2015; Forsyth et al. 2016).
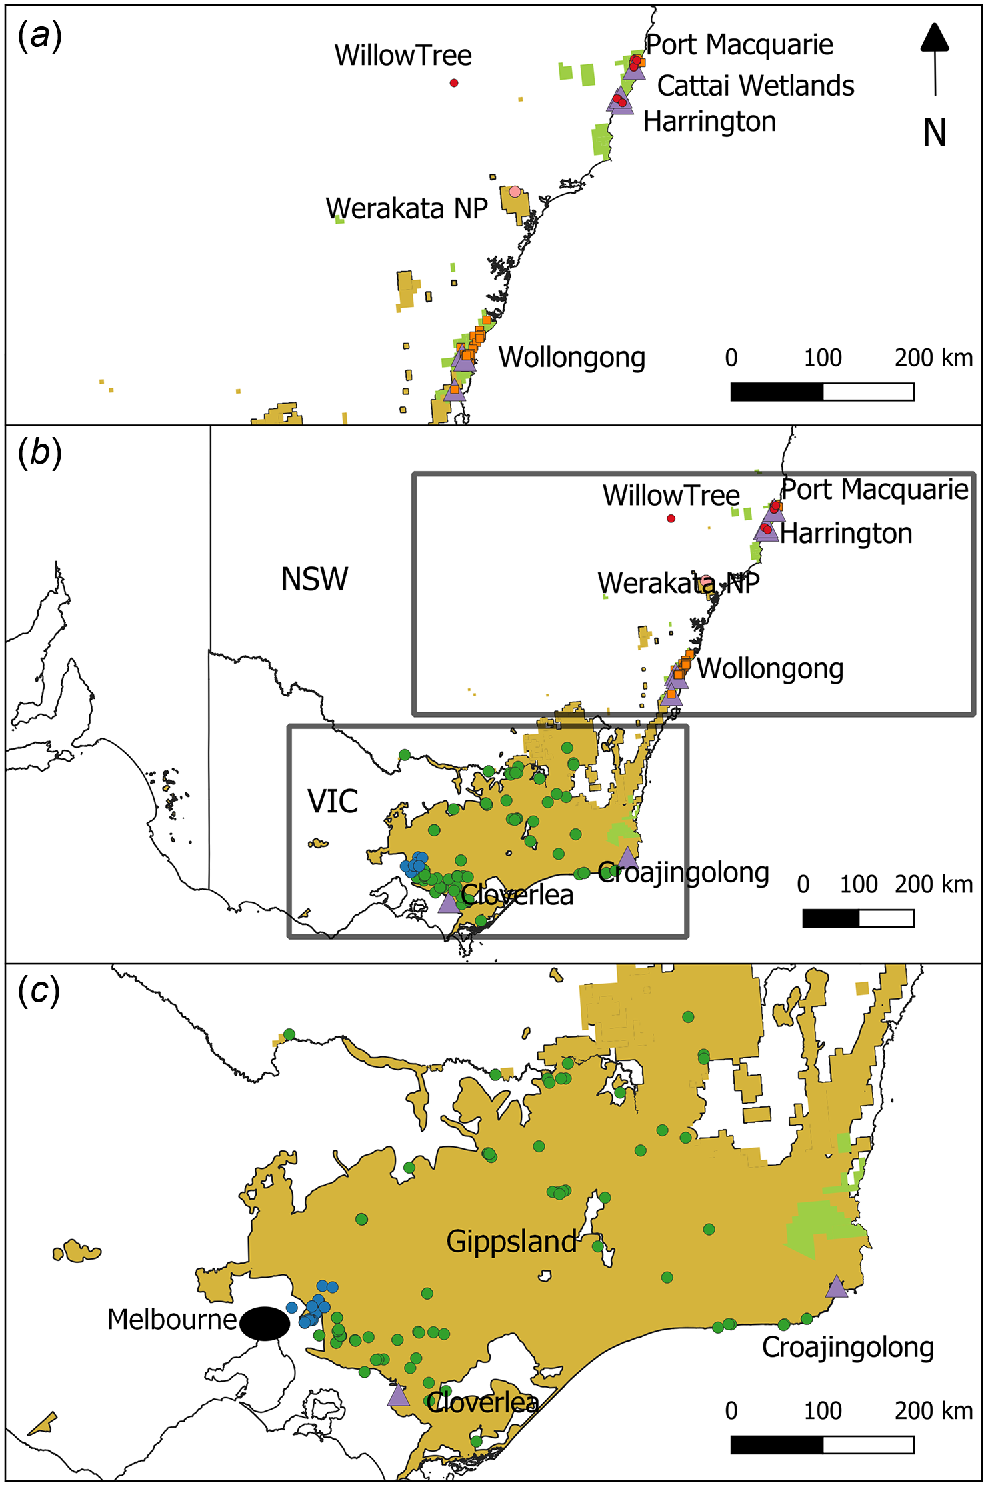
Sambar deer are one of the most successful deer introductions to Australia (Bentley 1978; Long 2003). Introduced by the Victorian Acclimatisation Society to several sites in Victoria during the 1860s and 1870s, the population has expanded to occupy ~29% of Victoria’s land area (Forsyth et al. 2015), with the population continuing to expand further north into New South Wales (NSW; Crittle and Millyn 2020). Isolated populations of sambar deer are also present in western Victoria and the Northern Territory (Moriarty 2004; Davies et al. 2022). The closely related rusa deer was also introduced to Australia by Acclimatisation Societies in the 19th century, but has a much smaller range than does sambar deer. Rusa deer were released in Victoria, NSW, Torres Strait, and Western Australia (WA); however, the WA population is thought to have failed to establish, and the population in Victoria was extirpated in the 1940s (Long 2003). Self-sustaining populations of rusa deer have also established in Queensland, likely from deer farm escapees and releases (Dryden 2000; Bengsen et al. 2022a). The current distribution of rusa deer in NSW appears to be patchy; however, large populations are present in Wollongong, Forster, and Port Macquarie (Fig. 1). The expansion of distributions for both sambar and rusa deer appear to have been additionally aided by translocations of animals to new sites, and releases or escapes from deer farms during the 1990s (Moriarty 2004). Both species are farmed in Australia; however, sambar and rusa deer farms comprise only a small proportion of all deer farming in the country (Shapiro 2010).
Map of final samples of sambar (circles) and rusa (squares) deer genotyped for this study. (b) All sites sampled, with (a) and (c) providing further detail of northern NSW and southern NSW/Gippsland/Melbourne sampling sites respectively. Samples that were either morphologically or genotypically identified as hybrids are shown as purple triangles. Colours of circles/squares indicate major geographic regions identified during population genetic analysis: sambar deer Melbourne (blue), sambar deer southern NSW/Gippsland (green), rusa deer NSW (orange), Werakata National Park (pink), and sambar deer northern NSW (red). Distributions of both species are shown in yellow (sambar) and green (rusa).
The abundance and distribution of sambar deer and rusa deer are increasing across south-eastern Australia. In Victoria, annual recreational harvesting of sambar deer has escalated over the past decade, with an estimated 131 258 sambar deer being harvested in 2019 alone (Moloney and Hampton 2020; Moloney et al. 2022). Population growth of the species in Victoria is currently estimated at 15% annually (Watter et al. 2020). Rusa deer distribution continues to expand in NSW (Crittle and Millyn 2020). As the abundance and distribution of both species rises, the negative impacts associated with deer over-abundance become apparent, including destruction of native flora through bark-stripping and trampling, soil erosion, competition with native herbivores for food sources, and wallowing (Keith and Pellow 2005; McDowell 2007; Davis et al. 2008; Bennett and Coulson 2010; Davis et al. 2016). Deer in Australia have also been shown to carry diseases that could affect livestock (Huaman et al. 2020) and deer can additionally pose risk to humans through deer–vehicle collisions, which are likely to become more commonplace as deer encroach peri-urban environments (Burgin et al. 2015; Davies et al. 2020). Rusa and sambar deer are also known to hybridise (Martins et al. 2018), with suspected hybrids thought to be present in the wild in Australia (Forsyth et al. 2015). These hybrids may pose additional negative impacts as increased genetic fitness may be associated with hybrids (heterosis), which can promote changes to life-history traits or phenotypes that may be even more detrimental to native environments than is either parent species (Iacolina et al. 2019). Sambar and rusa hybrids grow rapidly and changes in body mass can promote further damage to native environments or increase the severity of deer–vehicle collisions where larger animals are involved (Tuckwell 1998; Pacioni et al. 2021). Currently, the extent of hybridisation within sambar and rusa deer populations in Australia is unknown.
To mitigate the negative impacts of sambar and rusa deer across south-eastern Australia, population control through ground- and helicopter-based shooting is often undertaken. Such control can reduce deer densities locally (Bengsen et al. 2022b); however, understanding larger-scale population structure, connectivity and dispersal capability is important for identifying larger-scale and longer-term priorities, as well as for estimating the time needed for reinvasion. (Semiadi et al. 1994; Leslie 2011; Comte et al. 2022). Whereas determining movements of sambar and rusa deer can be difficult by using direct methods such as telemetry because of their elusive nature, genetic analysis of populations of interest can assist in determining likely dispersal rates from population structure. This in turn can identify distinct management units where control can take place without being compromised by immigration. These methods have been widely implemented for a range of invasive species globally to identify management units for population control or eradication (Cowled et al. 2008; Fraser et al. 2013; Mora et al. 2018; Sjodin et al. 2020). Whereas previous genetic studies have examined sambar deer connectivity in Victoria and southern NSW (Davies et al. 2022; Rollins et al. 2023), and fine-scale structure of rusa deer in Royal National Park, and Wollongong in NSW (Webley et al. 2004; Li-Williams et al. 2023), the present study aims to expand the sampling range of both species to include additional sites across Victoria and NSW to assess broad-scale population structure in both species across south-eastern Australia, and use 1000s of highly resolving single-nucleotide polymorphism (SNP) markers that will additionally aid in the identification of potential hybrids.
Specifically, we aim to (1) determine the interactions between sambar and rusa deer where the two species co-occur, through hybrid analysis, (2) assess any broad-scale population structure present within sambar deer and rusa deer and identify any distinct management units for each species, and (3) measure the likely dispersal capability of each species.
Methods
Sample collection
Samples of free-ranging sambar deer and rusa deer were collected over 2013–2021, predominantly during culling operations conducted by local government agencies in New South Wales and Victoria (Fig. 1, Table 1). These samples primarily consisted of tissue collected from ear tips by using sterile surgical scissors, scalpels and tweezers and stored in 5 mL vials containing 100% ethanol, or via biopsy punches using Allflex tissue-sampling applicators and tissue-sampling units. In NSW, samples were collected from three known sambar deer populations: Albury in southern NSW (possible natural range expansion), Werakata National Park in the Hunter Valley (likely to have originated from a failed sambar and rusa deer farm), and Harrington (unknown source). Additional incidental sambar deer samples were collected from a combination of culling operations and animals shot by commercial harvesters. Blood samples of sambar and rusa deer were also collected from a cull conducted at Port Macquarie in northern NSW in 2018. The sex of each animal, an indication of whether each animal was an adult or juvenile, and the sampling location were recorded. Deer that showed intermediate characteristics that may indicate that the animal was a hybrid were also noted, including atypical body size and ear morphology.
| Geographic region | Sambar deer | Rusa deer | Suspected hybrids | Total | |||
|---|---|---|---|---|---|---|---|
| Sex M/F/U | Age A/J/U | Sex M/F/U | Age A/J/U | Sex M/F/U | Age A/J/U | ||
| Melbourne | 15/34/4 | 46/0/7 | – | – | – | – | 53 |
| Gippsland/southern NSW | 34/42/33 | 48/2/59 | – | – | 2/0/0 | 0/0/2 | 111 |
| *Wollongong | – | – | 86/88/1 | 138/36/1 | – | – | 175 |
| Werakata National Park | 2/2/2 | 3/0/3 | – | – | – | – | 6 |
| *Harrington | 0/0/6 | 0/0/6 | 0/0/1 | 0/0/1 | – | – | 7 |
| *Cattai Wetlands | 7/3/0 | 10/0/0 | 1/1/0 | 2/0/0 | 1/0/0 | 1/0/0 | 13 |
| *Willow Tree | 1/0/0 | 1/0/0 | – | – | – | – | 1 |
| *Port Macquarie | 4/9/0 | 13/0/0 | 3/8/0 | 11/0/0 | – | – | 24 |
| Total | 63/90/45 | 121/2/75 | 90/97/2 | 151/36/2 | 3/0/0 | 1/0/2 | 390 |
Sites with an asterisk (*) were grouped into the geographic regions ‘sambar northern NSW’ or ‘rusa NSW’ for analysis. M/F/U indicates male/female/unknown sex, A/J/U indicates adult/juvenile/unknown age. Samples collected from Wollongong were provided by Li-Williams et al. (2023).
DNA isolation and sequencing
Blood and a subset of the tissue samples were extracted using a DNeasy Blood and Tissue Kit (Qiagen), following the manufacturers’ instructions. Approximately 150 μL of blood was used as starting material for blood extractions, and all samples were eluted using 100 μL of deionised H2O. DNA was quantified using a Qubit 2.0 Fluorometer (Invitrogen), and samples were then either diluted with deionised H2O or concentrated using an RVC 2–18 Rotational Vacuum Concentrator (John Morris Scientific) to obtain final concentrations between 5 and 15 ng/μL.
DNA extracts and the remaining tissue samples were sent to Diversity Arrays Technology (DArT) in Canberra, Australia, for DNA extraction and genotyping by sequencing. Sequencing was conducted using an Illumnina HiSeq 2500, using 1.2 million reads per sample, and reads were aligned to a red deer (Cervus elaphus) genome available on GenBank (BioProject PRJNA324173). Rusa deer samples sequenced by Li-Williams et al. (2023) were additionally combined with the dataset. A total of five samples did not provide sufficient data following sequencing, leaving 404 samples for further analysis.
SNP filtering
Sequencing returned 53 946 single-nucleotide polymorphisms (SNPs), of which 41 492 were successfully aligned to the red deer genome. Of these SNPs, 1373 were aligned to either the X or Y red deer chromosome, and to avoid any potential sex-linked markers appearing in the dataset, these SNPs were removed from further analysis. Genotypes were analysed with dartR 2.0 (Mijangos et al. 2022) except when otherwise specified. Loci were filtered with a minimum call rate of 0.95, a minimum read depth of five for each allele (i.e. the reference and alternative allele), and a minimum reproducibility of 0.99. Individuals were removed if they had less than 80% of loci genotyped. Only one SNP was kept where multiple SNPs within the same read were present, with the SNP comprising the highest repeatability and information content chosen. Monomorphic loci and loci with the minor allele observed only once (i.e. singleton) or twice in the whole dataset were discarded. At the end of these steps, the dataset comprised 390 individuals and 14 333 loci.
This dataset was initially inspected using a Pearson principal-component analysis (PCA) and analysed within a Bayesian framework by using the program fastStructure 1.0 (Raj et al. 2014), with output files being processed using StructureSelector (Li and Liu 2018). We considered the profile of the marginal likelihood and the minimum number of the model components needed to explain the structure in the data to select the optimal number of clusters (K; Raj et al. 2014). In the former approach, we consider the K value that generates the highest log-likelihood (or where further increases in K cause negligible changes in the log-likelihood). In the latter, for a model with a given K, the clusters needed to explain 99.99% of the ancestry of the sampled individuals were considered the optimum number of genetic clusters. Both beta and logistic distributions were used as suitable priors for the allele frequencies. With the beta prior, we tested a wide range of K values (1–9); however, with the logistic prior, we limited the analysis to a range of K = 1–8 as guided by the previous results with the beta prior. Up to five possible genetic clusters were subsequently identified.
Partitioning the data based on these five clusters, we evaluated possible departure from Hardy–Weinberg equilibrium (HWE) for each locus, following recommendations of Waples (2015) and De Meeûs (2018). Briefly, the exact tests (Wigginton et al. 2005) for departure from HWE were performed within each population for each locus with α = 0.05. The results were compared with the null expectations of the possible number of significant tests if these were obtained by chance alone (both overall and across multiple populations for the same locus). The Fisher’s global test (Fisher 1970) was also used to evaluate whether there is at least one test that is truly significant in the series of tests conducted (De Meeûs et al. 2009). Furthermore, we assessed the correlation between FIS and FST (Nei 1978) to investigate potential causes of departure from HWE to determine whether loci not in HWE should be removed (e.g. because of possible genotyping errors or loci under selection), or retained (e.g. small population size) because the latter can provide important biological insights. Following these filtering steps, 14 099 polymorphic SNP loci and 390 samples, in total, were retained for the final analysis, comprising 198 sambar deer samples, 189 rusa deer samples, and three suspected hybrids on the basis of morphological identification.
Data analysis
From this final dataset, we conducted several analyses, some of which required subsets of samples as summarised in the flowchart (Fig. 2) and described in more detail below.

A PCA was undertaken on the final dataset by using the gl.pcoa function in dartR and plotted by using ggplot2 3.3.6 (Wickham 2016). Analyses of fixed-locus differences between rusa and sambar deer were calculated using the gl.fixed.diff and gl.collapse functions in dartR, with all suspected hybrid samples removed for this analysis. Private alleles between rusa and sambar deer were calculated using the gl.report.pa function in dartR.
FastStructure was used for the final dataset by using the methods described above and limiting the number of possible clusters to within a range of 1–6. We additionally tested for structure by using the R package tess3r 1.1.0 (Caye et al. 2016), which provides a spatially explicit analysis of population structure. For the entire dataset, K-values 1–9 were tested with 20 repetitions per K, 100 000 iterations, and a tolerance level of e-7 by using the ‘projected.ls’ method. Best fit for K was determined via evaluation of the cross-validation criterion for each K. The program NewHybrids 1.1 (Anderson and Thompson 2002), implemented in the R package parallelnewhybrid 0.0.0.9002 (Wringe et al. 2017), was used to assess hybrid classes within the dataset. NewHybrids assigns samples to categories of either parental species, F1 and F2 hybrids, or backcrosses to either of the parental species. Because this software has a 200 loci limit, loci with missing data were removed using the gl.filter.callrate function in dartR, by using a threshold of 1, and the dataset was converted to NewHybrids format by using the gl.nhybrids function, retaining the first 200 loci ranked on information content by using the ‘AvgPIC’ method. Thirty samples of sambar deer and 15 samples of rusa deer were randomly assigned as parental species, on the basis of samples identified in fastStructure with a Q value above 0.9999 when analysed with K = 2. A burn-in of 100 000 and 500 000 sweeps were used, with five replicate runs completed.
Following the hybridisation and species-differentiation analysis, the dataset was further subdivided by species and geographic region to detect weaker structure possibly present in the data. When subsets of data were analysed, loci that were monomorphic within each dataset were also removed (Fig. 2). FastStructure, Tess3, PCA, and the fixed-differences analysis were repeated for each species separately (i.e. rusa and sambar deer), by using the same methods as described above. For the PCA and fixed-differences analysis, hybrid samples were removed.
Pairwise FST values, diversity indices, inbreeding coefficient FIS, and effective population size (Ne) were all calculated for the distinct geographic regions identified in both the rusa and sambar deer datasets. Pairwise FST was calculated using gl.fst.pop, whereas observed and expected heterozygosity (HO and HE), and FIS were calculated using the gl.report.heterozygosity function in dartR. Effective population size (Ne) was calculated using NeEstimator V2.1 implemented through the gl.LDNe function in dartR (Do et al. 2014), by using the linkage disequilibrium method. We used a 0.05 allele frequency cut-off and reported the 95% confidence intervals calculated via jack-knifing of samples. Analyses of HO, HE, FIS, and Ne were also run with hybrid samples removed.
We investigated whether the genetic data would provide any indication of the dispersal distances in sambar and rusa deer byusing a spatial autocorrelation analysis (Smouse and Peakall 1999; Peakall et al. 2003; Double et al. 2005), and analyses of kinship. Here, we consider dispersal the reciprocal distance between two related individuals, with the subsequent dispersal distances observed being reflective of how far individuals disperse from each other in a lifetime. Spatial autocorrelation aims to evaluate whether samples collected within a distance class are genetically more similar (i.e. related) than would be expected at random. A pairwise genetic distance was constructed as 1 – number of mismatches between pairs of samples, whereas a geographical distance matrix included the linear distance between sampling points (in km) computed using the R package raster (Hijmans 2022). Custom distance classes were used, with endpoints being 5, 10, 15, 20, 25, 50, 81, 243, and 729 km. Following other studies (Smouse and Peakall 1999; Peakall et al. 2003; Double et al. 2005), the null hypothesis of no spatial autocorrelation was tested using 1000 permutations and these data were used in a one-tailed test, whereas 1000 bootstraps were conducted to estimate the 95% confidence intervals around the spatial correlation coefficients. The general code used for computing these statistics (gl.spatial.autoCorr) was made publicly available in the development version of the R package dartR (https://github.com/green-striped-gecko/dartR/tree/dev). These analyses were conducted after removing all juveniles and individuals of unknown age, separately for the rusa deer samples, and the southern NSW/Gippsland and Melbourne, and northern NSW sambar deer clusters. The samples from Werakata National Park were not included in this analysis because of small sample sizes. For each dataset, these analyses were also repeated separately for males and females.
Analysis of kinship was undertaken using Colony 2.0.6.8 to assess the dispersal of closely related kin throughout the landscape (Jones and Wang 2010). Colony was run using the same datasets as described above for the spatial autocorrelation analysis, with hybrid samples being removed, and assuming polygamy in both males and females, inbreeding, and no sibship prior or candidate parents. The pairwise full likelihood combined method for analysis was chosen with high precision and updating allele frequencies, and a 0.05 allele dropout rate and false allele rate per locus were also assumed. Colony was run three times to ensure convergence of results. Distances between each sibling pair identified by Colony were measured, and histograms of dispersal distance classes were generated for the rusa deer samples, the southern NSW/Gippsland and Melbourne sambar deer samples, and the northern NSW sambar deer group by using ggplot2. Parameters for a set of candidate distributions (negative binomial, Poisson, log-normal, half-normal and pareto) were then estimated by maximum likelihood by using the R package fitdistrplus for each dataset (Delignette-Muller and Dutang 2015). Distances were expressed in metres (m) and, where pairwise distances were 0, 1 m was added to allow the fitting of a log-normal distribution. The fit was compared using the Akaike information criterion and the most supported distribution was used to plot the expected frequency distribution (Burnham and Anderson 1998).
Results
Hybridisation
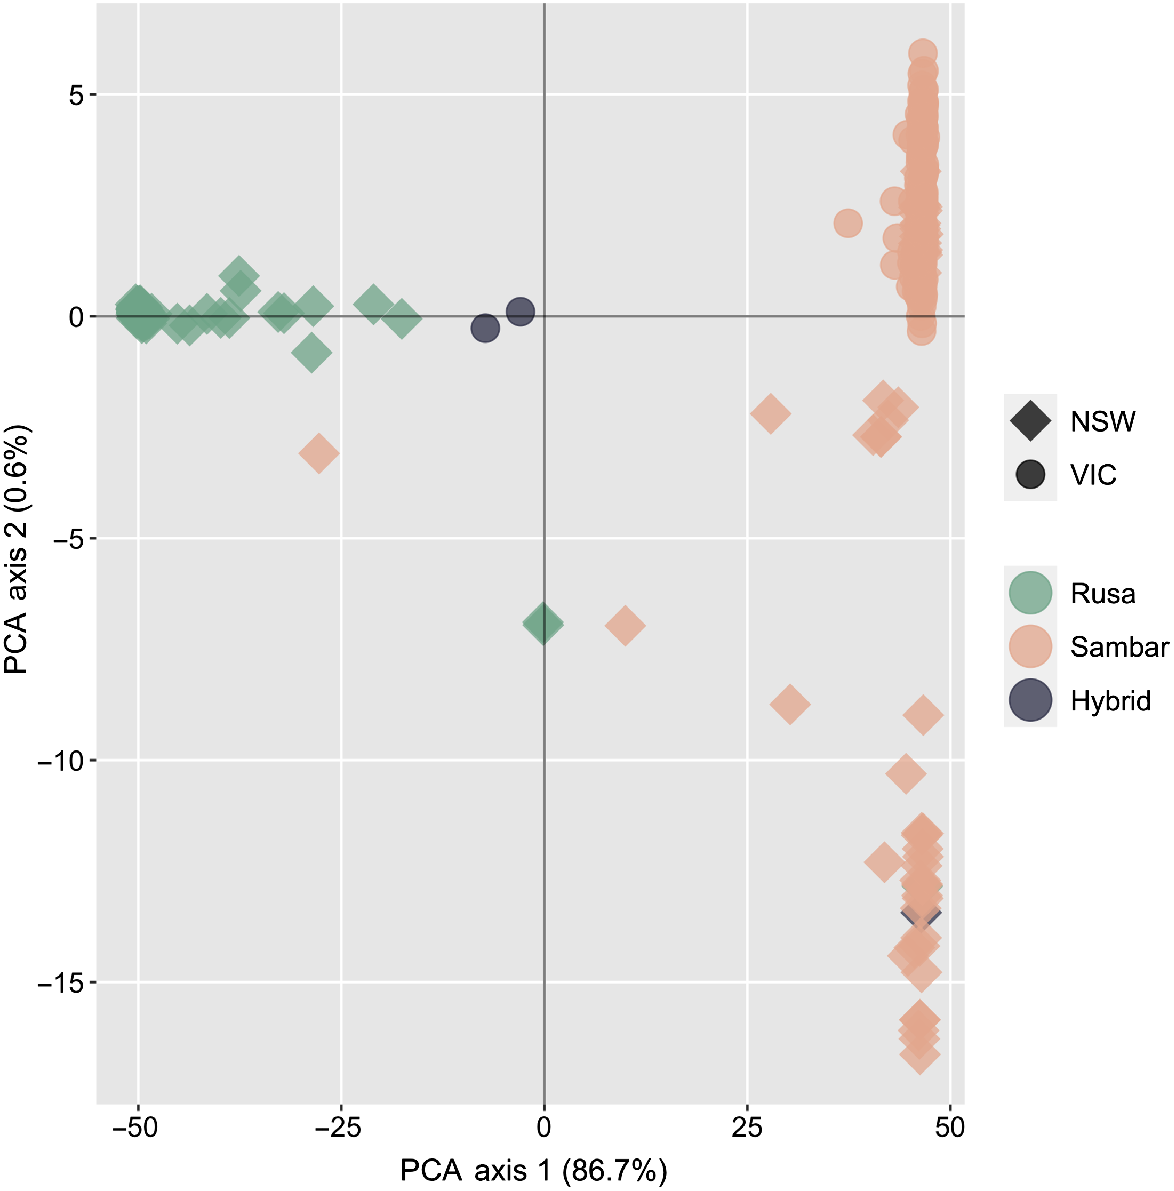
Principal-component analysis identified three distinct genetic clusters within the entire dataset, corresponding to one rusa deer group, and two groups of sambar deer broadly split into a northern NSW and southern NSW/Victoria group (Fig. 3). A number of samples from NSW fell between the rusa deer and sambar clusters, in addition to two samples from Victoria that were flagged as potential hybrids on the basis of morphology. A third sample that was identified as a potential hybrid on the basis of morphology is clustered with the NSW sambar deer group. After removing suspected hybrid samples and reclassifying two samples that had been misidentified (the morphologically identified hybrid sample clustering in the sambar NSW group, and a sample morphologically identified as rusa deer but genetically assigned as sambar deer), fixed difference analysis found that 2798 loci were fixed between the rusa and sambar deer samples (false positive expectation 0.4, P < 0.0001), with all sambar clusters identified in the PCA collapsing into a single sambar deer population (Supplementary material Fig. S1). In total, 4439 private alleles were present within the rusa deer cluster, and 9685 private alleles were present in the sambar deer cluster.
Principal-component analysis plot of rusa and sambar deer, based on 390 samples and 14 099 polymorphic SNP loci. Samples identified as hybrids in this plot are based on morphological identification prior to genotyping.
FastStructure analysis of the entire dataset indicated that K = 2 clusters were present, corresponding to the two species (Fig. 4a). Similar to the PCA, a number of samples were intermediate between the two species clusters, including seven samples from northern NSW, eight samples from Wollongong and two samples from southern NSW/Victoria. Results from Tess3 were largely congruent with the fastStructure results, with the optimal K value at K = 2 and clusters corresponding to the two species (Fig. 4b). However, additional mixing of the two clusters was evident in the Tess3 results in the northern NSW group, whereas the samples that showed intermediate genotypes between the two clusters in Wollongong from the fastStructure analysis were less evident in the Tess3 plots.
(a) Best-fit K = 2 plot generated from fastStructure analysis. (b) Best-fit K = 2 plot generated from Tess3 analysis. (c) NewHybrids plot showing individual assignment to parental or hybrid classes. Samples appear in the same order in all plots, with broad geographic range highlighted at the top of the figure.
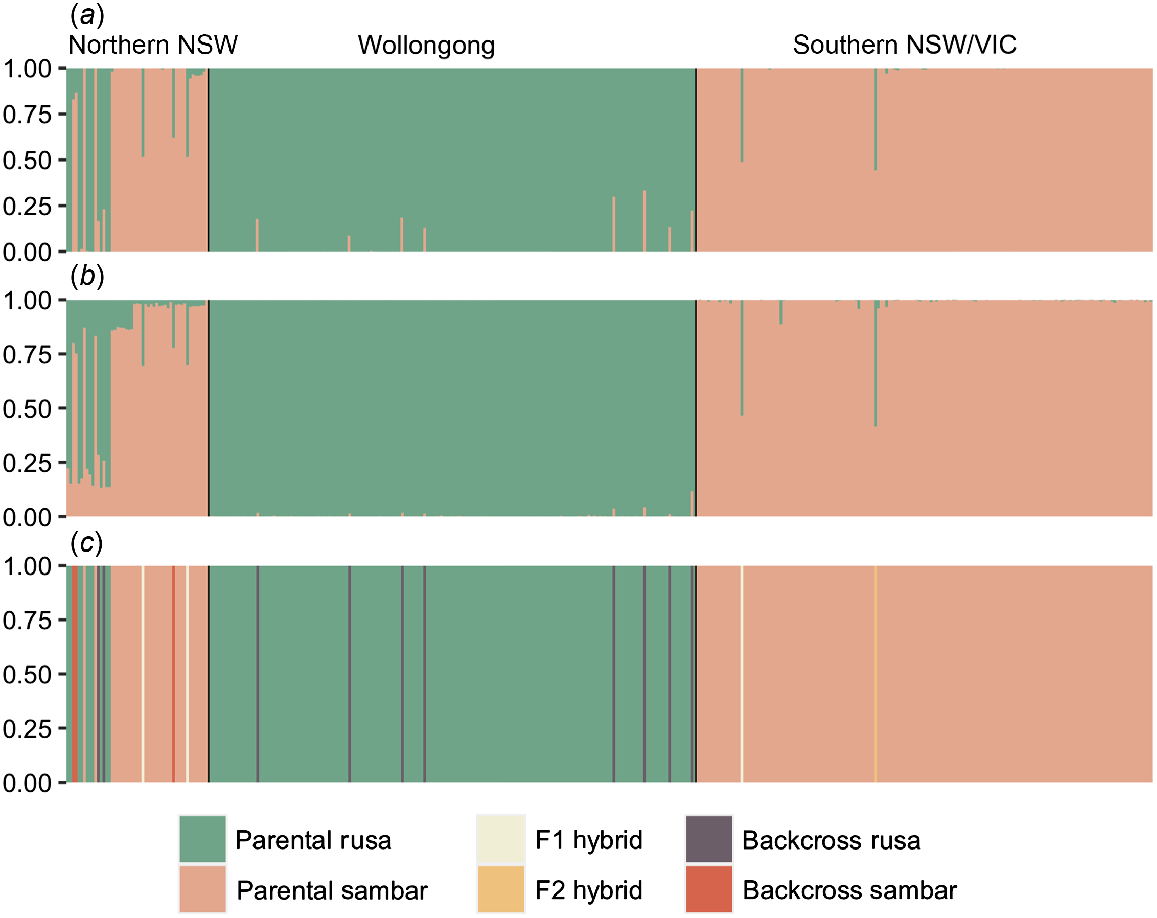
NewHybrids analysis showed that intermediate samples identified in fastStructure and Tess3 comprised a range of hybrid classes (Fig. 4c). In northern NSW, F1 hybrids, as well as hybrids backcrossed to either rusa or sambar deer, were detected in this region. Samples from Port Macquarie comprised two individuals that had backcrossed to rusa deer, with one sample each having been morphologically identified as a sambar and rusa deer, and two individuals backcrossed to sambar deer, both morphologically identified as sambar deer during sample collection. Samples obtained from Cattai Wetlands comprised one F1 hybrid that had been morphologically identified as a rusa deer, and one individual backcrossed to sambar deer, identified during sample collection as a sambar deer. A single sample from Harrington was identified as an F1 hybrid, previously classified as a rusa deer. In Wollongong, all eight samples showing intermediate genotypes from fastStructure analysis were assigned as backcrosses to rusa deer. The two suspected hybrids collected in Victoria were confirmed to be hybrid animals, with the Croajingolong sample identified as an F1 hybrid, and the Cloverlea sample assigned as an F2 hybrid. The third suspected hybrid sample collected from Cattai wetlands (northern NSW) was assigned to the parental sambar deer class and comprised a Q value of 0.999 for the sambar deer cluster in fastStructure. Finally, a second individual from Cattai Wetlands morphologically assigned as a rusa deer was in fact a sambar deer on the basis of fastStructure and NewHybrids results.
Intraspecies population structure and diversity
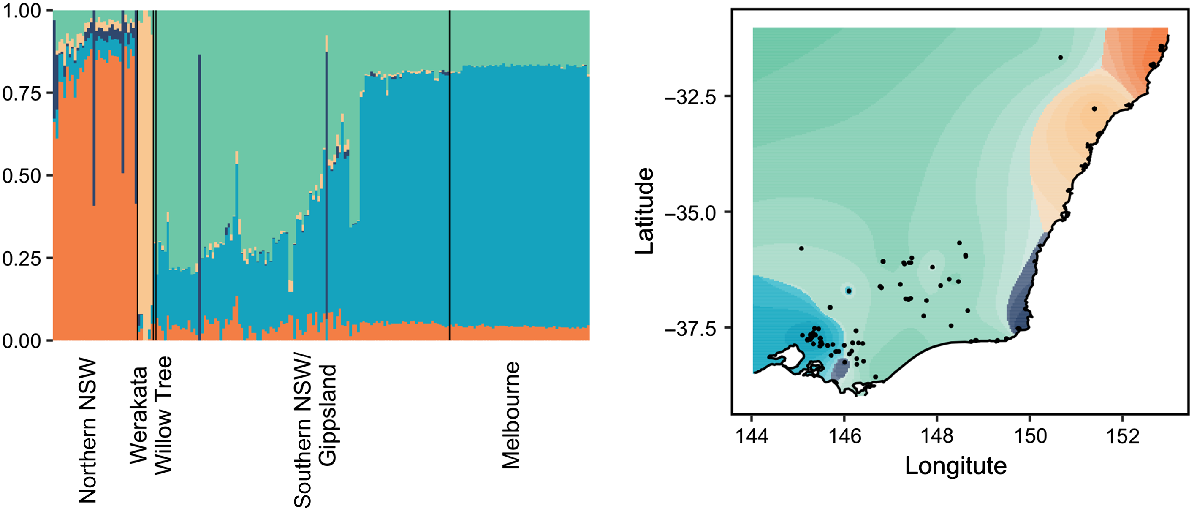
The dataset was subsequently split into a rusa deer group and a sambar deer group to further elucidate any fine-scale structure present within each species. Both fastStructure and Tess3 identified K = 2 genetic clusters in the rusa deer dataset; however, these clusters separated the parental rusa deer from the hybrid samples and were not reflective of population structure detected between sites (Supplementary material Fig. S2). Within the sambar deer samples, fastStructure indicated K = 2 genetic clusters, again separating parental sambar deer from hybrid samples (Supplementary material Fig. S3); however, Tess3 identified K = 5 genetic clusters within the sambar deer samples (Fig. 5). Whereas one of these clusters comprised only hybrid samples, the remaining four clusters were associated with geographic region, with a distinct cluster being identified in northern NSW, a second cluster specific to Werakata National Park, and the final two clusters mixed between southern NSW/Gippsland and Melbourne. Interestingly, a single sample from northern NSW collected from Willow Tree appeared to cluster with the southern NSW/Gippsland and Melbourne samples.
Best-fit K = 5 plot and map generated from Tess3 analysis for all sambar deer samples. Broad geographic range is identified at the bottom of the bar chart, along with the Werakata National Park site and Willow Tree samples, which form part of northern NSW.
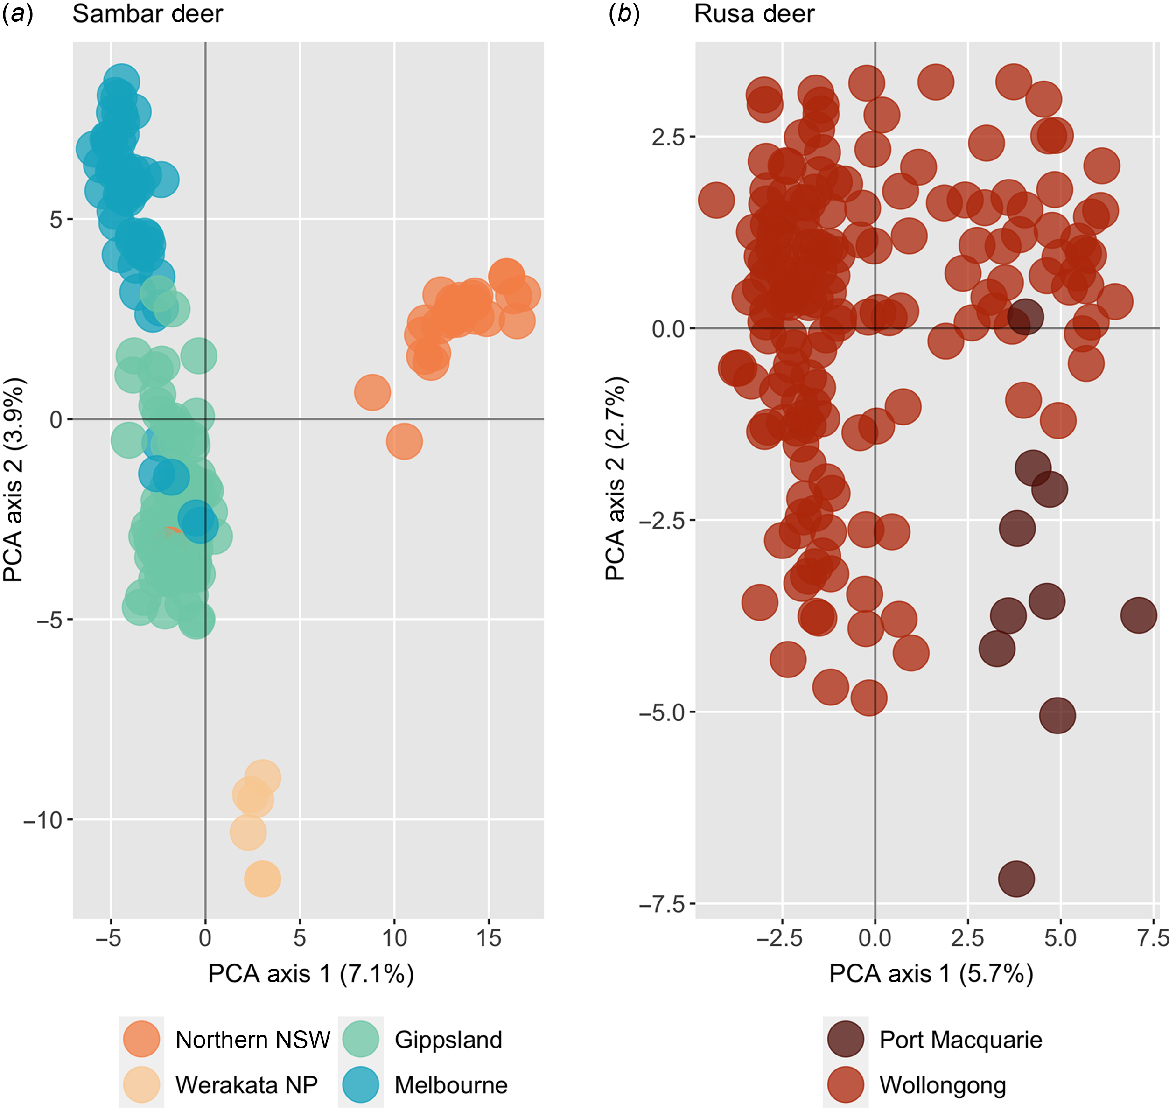
Principal-component analysis plots for each species with hybrid samples removed conformed with the sambar deer results from Tess3, with four groups broadly corresponding to northern NSW, Werakata National Park, southern NSW/Gippsland, and Melbourne, and intermixing between southern NSW/Gippsland and Melbourne, and the single Willow Tree sample clustering with the Victorian samples (Fig. 6). Fixed-differences analysis between these sambar deer populations showed fixed differences only between Werakata National Park and northern NSW, with only four fixed differences observed. No sambar deer populations were shown to be significantly different, and all collapsed into a single population. When the single Willow Tree sample was removed, and fixed-difference analysis rerun, the number of fixed differences between Werakata National Park and northern NSW rose to five; however, all populations were still not significantly different and again collapsed into a single population. Within the rusa deer samples, some slight clustering could be observed between Port Macquarie and Wollongong, which was not detected by fastStructure or Tess3 (Fig. 6). No fixed differences were detected between these two sites, with both populations collapsing into a single rusa deer group.
Principal-component analysis plot for major geographic regions of (a) sambar deer, and (b) rusa deer, with all hybrid samples removed.
Pairwise FST values between species and geographic regions for sambar deer were all statistically significant, with comparisons between rusa and sambar deer comprising the highest pairwise values of 0.884–0.912 (Table 2). Within the sambar deer geographic regions, pairwise FST values ranged from 0.035 to 0.231, with the lowest value between Werakata National Park and Gippsland, and the highest pairwise value between Melbourne and Werakata National Park.
| Item | Rusa NSW | Sambar North NSW | Sambar Werakata | Sambar Gippsland |
|---|---|---|---|---|
| Sambar northern NSW | 0.892 | |||
| Sambar Werakata | 0.906 | 0.134 | ||
| Sambar Gippsland | 0.884 | 0.097 | 0.035 | |
| Sambar Melbourne | 0.912 | 0.166 | 0.231 | 0.160 |
All pairwise comparisons were significant with P < 0.001.
Observed and expected heterozygosity within the major geographic regions identified for rusa and sambar deer showed that the rusa deer NSW population comprised the lowest values, with a HO of 0.056 and a HE of 0.057 with hybrid samples retained, and 0.043 for HO and HE with hybrid samples removed (Table 3). Sambar deer present in northern NSW comprised the highest observed and expected heterozygosity with hybrid samples included, with a value of 0.153 for each. However, when hybrid samples were removed from this analysis, the sambar deer population present in Werakata National Park comprised the highest HO and HE values, followed by southern NSW/Gippsland. FIS values were similar when hybrids were present and absent in the dataset and ranged from −0.069 in the sambar deer Werakata National Park population to 0.083/0.068 in the sambar deer southern NSW/Gippsland region. Estimates of effective population size were highest for sambar deer populations present in Victoria and southern NSW, with an estimated Ne of 126.9 across southern NSW/Gippsland, and 101.1 within the sambar deer Melbourne samples (Table 3). The rusa deer populations in NSW had an Ne of 63 with hybrids retained and 61 with hybrids removed, with the lowest estimates being observed in the sambar deer populations in northern NSW, with values of 2.8 in Werakata National Park and only 0.7 in northern NSW; however, this value increased to 11.2 when hybrids were removed (Table 3).
| Species/region | Hybrid samples retained | Hybrid samples removed | ||||||||
|---|---|---|---|---|---|---|---|---|---|---|
| N | HO | HE | FIS | Ne | n | HO | HE | FIS | Ne | |
| Rusa NSW | 187 | 0.056 (0.124) | 0.057 (0.117) | 0.021 | 63 (56–70.2) | 177 | 0.043 (0.127) | 0.043 (0.120) | 0.010 | 61 (53.5–69.9) |
| Sambar northern NSW | 33 | 0.153 (0.146) | 0.153 (0.138) | 0.014 | 0.7 (0.1–2.3) | 28 | 0.090 (0.168) | 0.089 (0.161) | 0.012 | 11.2 (6.9–18.6) |
| Sambar Werakata | 6 | 0.143 (0.231) | 0.123 (0.177) | −0.069 | 2.8 (0.9–infinite) | 6 | 0.143 (0.231) | 0.123 (0.177) | −0.069 | 2.8 (0.9–infinite) |
| Sambar southern NSW/Gippsland | 111 | 0.117 (0.162) | 0.127 (0.170) | 0.083 | 126.9 (96.1–171.3) | 109 | 0.107 (0.168) | 0.114 (0.176) | 0.068 | 126.9 (96.4–177.6) |
| Sambar Melbourne | 53 | 0.101 (0.172) | 0.103 (0.171) | 0.028 | 101.1 (92.8–204.6) | 53 | 0.101 (0.172) | 0.103 (0.171) | 0.028 | 101.1 (92.8–204.6) |
n, sample number; HO, observed heterozygosity (s.d.); HE, expected heterozygosity (s.d.); FIS, inbreeding coefficient; Ne, effective population size (95% CI).
Dispersal distances
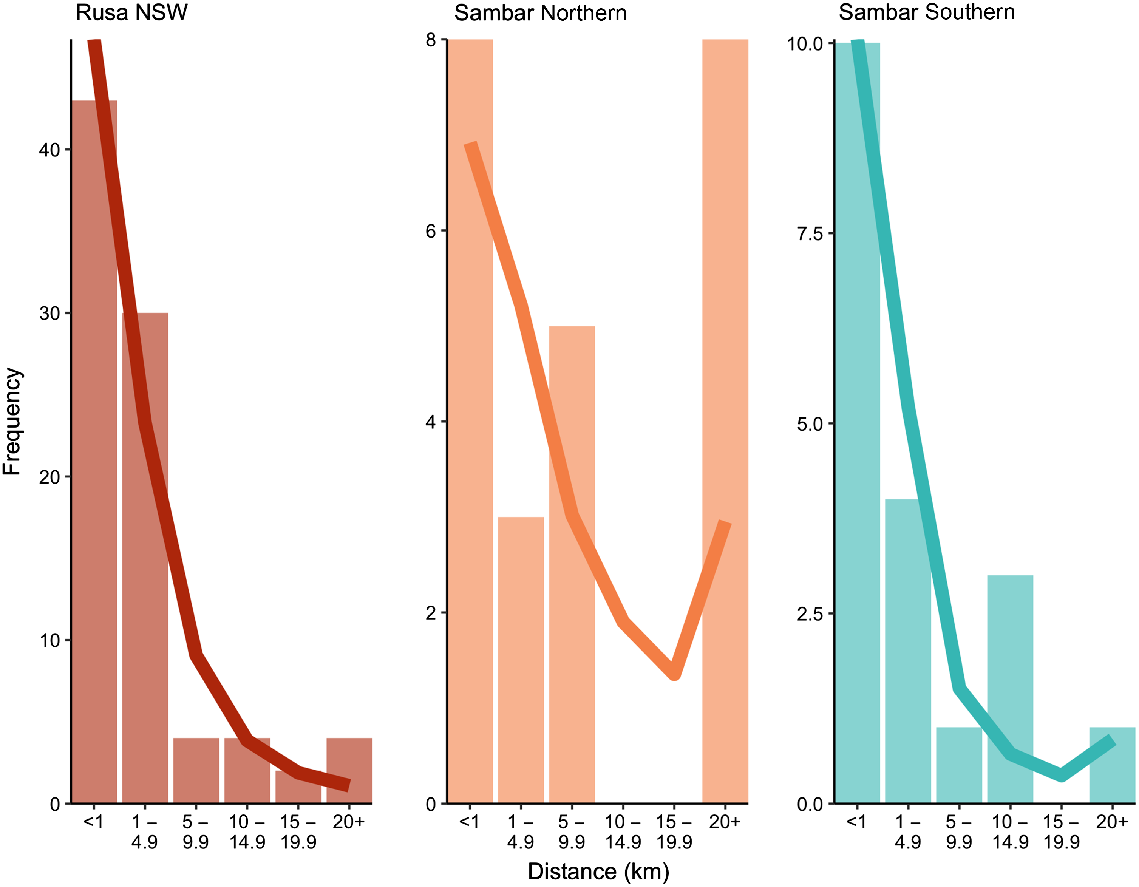
The Distance class 5–10 km was marginally significant (P = 0.047) for the rusa deer NSW dataset (r = 0.0001) (Supplementary material Fig. S4). For the same dataset, the Distance classes 20–25 and 25–50 km were also significant (P ≤ 0.028) with negative coefficients (r = −0.0002 and −0.0001 respectively). The last distance class (>243 km) was also significant (P = 0.037) and positive (r = 0.00015). No distance classes were significant when rusa deer males were analysed alone and only the Distance classes >15 km had a significant (P ≤ 0.04) and negative correlation coefficient (r ≤ 0.0003) when females were analysed alone. Kinship analysis showed 89 full sibling pairs with probabilities above 0.9 in the rusa deer NSW dataset, with no half-sibling pairs being identified. Of these sibling pairs, five were from Port Macquarie, and the remaining 84 from Wollongong, with no siblings being identified between the two sites. Within Port Macquarie, four sibling pairs were sampled less than 1 km apart, with one pair being separated by 2.6 km (Fig. 7). At Wollongong, 39 sibling pairs were sampled less than 1 km apart, 29 sibling pairs were identified between 1 and 4.9 km, four pairs were separated by a distance of 5–9.9 km, and 10 pairs sampled greater than 10 km apart, with the largest distance between two siblings recorded at 25.8 km (Fig. 7). Two sibling pairs were identified with a sample where no location information was taken, so kin dispersal could not be measured.
Bar plots showing the frequency of kinship pairs observed at a range of dispersal distances for both sambar deer and rusa deer. Lines depict the expected frequency for each distance class on the basis of the most supported distribution for each population (negative binomial for rusa NSW and sambar northern, and log-normal for sambar southern). All kinship pairs comprised a probability value of >0.9.
The overall spatial autocorrelation analyses were not significant for the northern NSW sambar deer group (Supplementary material Fig. S5) nor with males only. When females were analysed separately, only the first distance class (0–5 km) returned a significant (P = 0.007) correlation coefficient (r = 0.0057). Kinship analysis identified seven full-sibling pairs and 17 half-sibling pairs among the northern NSW sites, with 11 pairs collected from the same sites, and 13 pairs collected from different sites. Pairs sampled from the same site showed dispersal distances <2 km, whereas pairs sampled from Cattai Wetlands and Harrington showed dispersal distances of 6.6–8.7 km, accounting for five sibling pairs (Fig. 7). Surprisingly, kin pairs were identified between Cattai Wetlands and Harrington to Port Macquarie, with dispersal distances of 38.1–40 km; two individuals from Cattai Wetlands, and one individual from Harrington, are responsible for the kin pairings to Port Macquarie, with the two samples from Cattai Wetlands also relatives (Fig. 7). In total, six sibling pairs were identified between Cattai Wetlands and Port Macquarie, and two sibling pairs between Harrington and Port Macquarie.
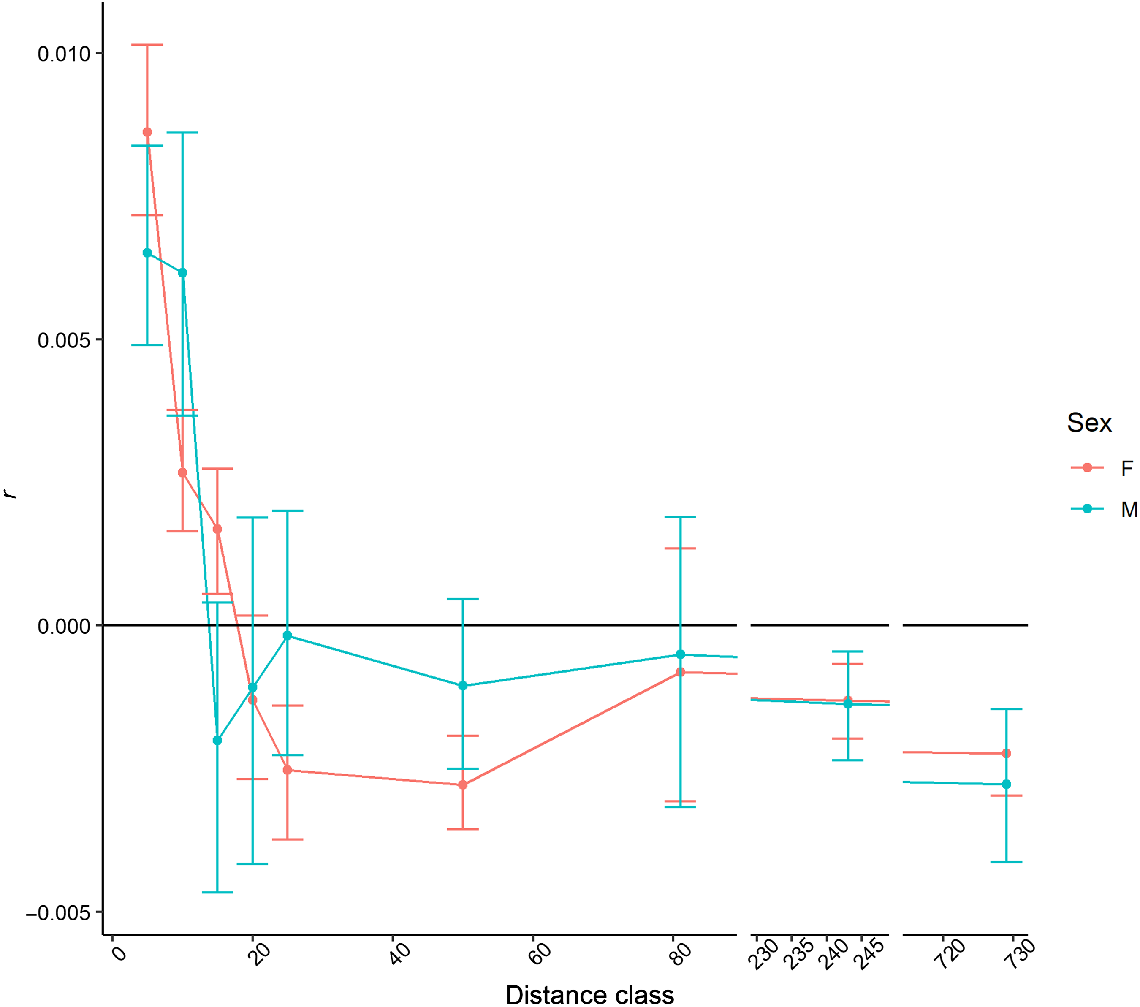
The first three distance classes (<15 km) for sambar deer from southern NSW/Gippsland and Melbourne were significant (P < 0.0001), with correlation coefficients between 0.001 and 0.008 (Supplementary material Fig. S6), and the last five (distance classes >25 km) had significant (P ≤ 0.016) negative correlation coefficients (range −0.002 to −0.001), except for the 50–81 km distance class, which had a positive correlation coefficient (r = 0.001). When the two sexes were analysed separately, this pattern was consistent in females, with all distance classes being significant except for the Distance class 50–81 km. Only the first three distance classes (<15 km) and the last two (>243 km) were significant (P < 0.0001) in males, with positive correlation coefficients in the first three and negative in the last two distance classes. When comparing the auto-correlograms for the two sexes with this dataset, although the correlation coefficients had the tendency of being higher for females, these were not greatly different, and the 95% confidence intervals generally encompassed the same distance classes for each sex (Fig. 8). Kinship analysis identified 35 full-sibling pairs with values above 0.9. Sixteen pairs had generic location coordinates for both samples, so movement could not be measured; however, all pairs were sampled from the same sites. For the other pairs identified, 10 were sampled <1 km apart, four sibling pairs were observed 1–4.9 km apart, one pair was detected 5–9.9 km apart, and four sibling pairs were sampled at a distance >10 km apart (Fig. 7). Of the sibling pairs identified at a distance greater than 10 km, two of these were between the Melbourne and southern NSW/Gippsland regions. The largest dispersal distance of 61.2 km was observed between two sambar deer in Kosciuszko National Park. The most supported distribution (Supplementary material, Table S1) was a negative binomial, with parameter size of 0.3 and μ of 3171 for the rusa deer dataset and size of 0.365 and μ of 1492 for sambar deer in northern NSW. The log-normal distribution was the most supported for the sambar deer in southern NSW/Gippsland and Melbourne (with mean of 6.76 and s.d. of 2.06 on the log scale).
Auto-correlogram with distance classes in kilometres on the x-axis and spatial correlation coefficient (r) on the y-axis for males and females from the southern sambar deer cluster. Error bars are estimates of the 95% confidence intervals obtained via bootstrap analysis. Note that the x-axis is broken to improve visibility.
Discussion
Hybridisation
In total, 17 hybrids were identified in the dataset, representing multiple hybrid classes in both NSW and Victoria. These samples comprised <1% missing data, except two samples from Port Macquarie that had between 14% and 16% missing data. Of the three samples flagged as hybrids prior to genetic analysis, only two were confirmed to be hybrids, and comprised an F1 and an F2 hybrid. On the contrary, 11 individuals identified as rusa deer and four identified as sambar deer were in fact F1, F2 hybrids or backcrosses. These results demonstrated the difficulties in distinguishing hybrids on the basis of morphology alone, and although some intermediate characteristics can be observed in sambar deer × rusa deer hybrids, particularly in antler growth patterns, ear morphology, and increased body size in the smaller rusa deer (Bentley 1978), these characteristics are likely to become less apparent as F1 and F2 hybrids backcross to parental species. Similar patterns have been observed in white-tailed deer (Odocoileus virginianus) × mule deer (Odocoileus hemionus) hybrids and hog deer (Axis porcinus) × chital deer (Axis axis) hybrids, where hybrid individuals phenotypically resemble a parental species rather than intermediate characteristics of both parents (Hill et al. 2019; Combe et al. 2022), and in sika deer (Cervus nippon) × red deer (Cervus elaphus) hybrids where hunters misidentified 21% of deer at sites where hybrids were known to occur (Smith et al. 2014). It is therefore not surprising that a majority of the hybrids detected through genetic analysis in this study were not flagged as suspected hybrids prior to analysis and this highlights the need for genetic testing of sambar and rusa deer to accurately determine hybridisation rates between the species. Deer hybrids can present as larger in body size than their parental species, and this phenomenon is often encouraged in the deer farming industry to promote larger meat yields (Pearse 1992; Tate et al. 1997; Tuckwell 1998). Hybridisation in ungulates has also been shown to increase disease resistance (Grossen et al. 2014; Barbato et al. 2017), growth rate and bodyweight (Asher et al. 1996; Ismail and Saidi 2009; Senn et al. 2010), and is suggested to aid in population growth and dispersal (Goedbloed et al. 2013; Manunza et al. 2016; Iacolina et al. 2019). These characteristics may lead to an increase in negative impacts associated with deer in areas where sambar deer, rusa deer, and their hybrids co-occur, with further research being necessary to understand the full scale of the negative impacts that are likely to be associated with the presence of rusa deer × sambar deer hybrids in the Australian landscape.
Whereas many of the hybrids identified in this study were collected from sites where both sambar and rusa deer occur (Port Macquarie, Cattai Wetlands, Harrington, Wollongong), hybrids were additionally detected at two sites in Victoria (Croajingolong and Cloverlea), where rusa deer are not believed to be established (Bentley 1978; Forsyth et al. 2015). Dispersing male rusa deer have been observed in Victoria close to the NSW border (Forsyth et al. 2015), and so it is possible that a dispersing rusa individual has encountered the Victorian sambar deer population, which has given rise to the hybrid sample collected from Croajingolong. At Cloverlea, where natural dispersal of rusa deer is highly unlikely, an escapee from a nearby local farm managed for recreational hunting is the most likely explanation for the hybrid observed at this site; however, it is unclear whether a hybrid or a pure rusa deer individual has escaped, with the parental rusa deer subsequently interbreeding with the local sambar deer population. The hybrid detected in Cloverlea also highlights the ongoing issues of deer escapees.
Population structure
Genetic structure was observed between the major geographic areas sampled for sambar deer, particularly between northern NSW and southern NSW/Gippsland and Melbourne, whereas populations of rusa deer did not appear to be genetically distinct. Fine-scale genetic analysis of rusa deer in Wollongong does show evidence of population structure (Li-Williams et al. 2023); however, the different spatial scales between the work of Li-Williams et al. (2023) and the present study, coupled with differences in SNP filtering, has likely led to the differences observed between the two studies. Also, it is important to note that Li-Williams et al. (2023) removed ‘outliers’ from their datasets, which were identified as rusa deer backcrosses in our study and the presence of these individuals in our analysis may have masked more subtle population structure within rusa deer that is present in the data. These two studies highlighted the importance of assessing genetic structure at multiple spatial scales to understand the connectivity among multiple populations and how populations may have arisen in the landscape, and additionally investigating genetic structure within more localised areas to identify fine-scale structure that can assist with local management of the species.
The genetic structure evident between Victoria and southern NSW and the northern NSW sambar deer populations is likely to be due to different founding events between the two regions and a subsequent genetic drift. Genetic structure is evident in invasive species where multiple introductions have occurred (Zalewski et al. 2010; Johansson et al. 2018; Mora et al. 2018) and can additionally be observed as invasive species continue to expand their distributions (Short and Petren 2011; Kajita et al. 2012). The lack of genetic structure observed in sambar deer in Victoria and southern NSW suggests a relatively high level of gene flow across Gippsland and southern NSW and is consistent with the findings of other studies assessing population structure of sambar deer across this region with microsatellites (Davies et al. 2022; Rollins et al. 2023). Sambar deer were released at several sites in the Gippsland region in Victoria in the 19th century by the Victorian Acclimatisation Society, with this population believed to have naturally dispersed as far as the Blue Mountains region near Sydney (Forsyth et al. 2015; Crittle and Millyn 2020). Northern NSW sambar deer are believed to have established relatively recently, with deer in Port Macquarie first being observed in the 1980s, and deer in Werakata National Park released/escaped from farms in the 1990s. The analyses of genetic diversity seem to support this, with low estimates of heterozygosity and Ne compared with the southern populations. Deer releases and escapees from farms are estimated to account for 35% of the deer populations present in Australia, second only to translocations as the source of new deer populations (Moriarty 2004). Genetic structure attributed to multiple founding events and subsequent genetic drift has been observed in sambar deer previously (Davies et al. 2022), and combined with the results from the present study, suggests that these factors are the major contributors to genetic structure observed in the species in Australia.
Although genetic structure was consistently identified in analyses between the northern NSW and southern NSW/Gippsland sambar deer groups, the extent of population structure was less apparent between southern NSW/Gippsland and Melbourne. Intermixing between these two regions is evident in the tess3 analysis and PCA; however, pairwise FST between these two regions was higher than in the comparison between southern NSW/Gippsland and northern NSW (0.16 and 0.097 respectively). While Rollins et al. (2023) sampled sambar deer from Yarra Valley, a site that was encompassed within the Melbourne population in the present study, they did not identify these samples as potentially belonging to a genetic cluster separate from southern NSW/Gippsland. This may be due to differences in the genetic markers used. Generally, SNPs are considered to have a higher resolution power than do microsatellites when many hundreds of SNPs are used (Helyar et al. 2011; Flanagan and Jones 2019). Rollins et al. (2023) sampling of Melbourne and surrounding areas was also limited. It is also possible that this site is on the fringe of the two genetic clusters, with possible contributions from both the Melbourne and southern NSW/Gippsland groups. The Melbourne population is likely to represent the range edge of sambar deer from the Gippsland population, and so the pattern observed here may be reflective of range edge effects in the Victorian population. Populations on the edges of a given species’ distribution can show reduced genetic diversity and population structure, and higher levels of inbreeding than for core-range populations; however, these findings are not always consistent across species (Arnaud-Haond et al. 2006; Eckert et al. 2008; Assis et al. 2013). Estimates of genetic diversity and inbreeding through FIS in the sambar deer Melbourne population were consistent with those from the other sambar deer regions sampled, potentially owing to the proximity of Melbourne to one of the initial release sites of sambar in Victoria in the 19th century (Kinglake; Forsyth et al. 2015). Alternatively, it is possible that landscape and urbanisation may play some role in the genetic structure observed in the Melbourne population. The sambar deer samples collected in Melbourne were predominantly from the peri-urban region of the city, and previous studies of deer have shown that urban habitats can lead to genetic differentiation within urban sites and among rural areas (Blanchong et al. 2013; Fraser et al. 2019). Genetic analysis of rusa deer in a peri-urban environment has demonstrated that a fine-scale population structure is present across the region (Li-Williams et al. 2023) and therefore additional sampling of sambar deer across peri-urban Melbourne and surrounds, and an assessment of landscape features that may facilitate or inhibit movement, are also warranted to further understand the patterns of population structure observed in the present study.
Dispersal distance
Across all datasets, shorter distance classes (<20 km) have generally positive and significant correlation coefficients for both sambar and rusa deer. The correlation coefficients rapidly drop for distances >20 km, becoming often significantly negative. Although this pattern was strongly pronounced in the southern cluster of sambar deer, it was less so in rusa deer and the northern cluster of sambar deer. The point where positive (and significant) spatial autocorrelation coefficients become not significant and close to zero are usually interpreted as the limit of the dispersal distance (as defined in the Methods) of the species. On the contrary, consistently negative coefficients may reflect sampled distance classes beyond the possible dispersal distance, causing an isolation by distance effect. Conversely, the sample size was much lower in the northern sambar deer dataset. However, given that the two sambar deer datasets have a similar pattern, these results suggest that the natural lifetime dispersal distance in sambar deer within Australia is likely to be within 20 km, and it is unlikely that sambar deer are able to disperse beyond 50 km in a lifetime. Rusa deer seem to have a more homogeneous dispersal pattern within 20 km, but similarly it would appear unlikely that individuals of this species disperse beyond 50 km. These data also suggest that both sexes have similar dispersal capacity, although the majority of females may have a slightly reduced dispersal distance. These results are also supported by the analysis via kinship. In fact, using the estimated distributions of the dispersal distances, 20 km would fall within the 77–97th percentile.
Both sambar and rusa deer are considered sedentary species (Long 2003), with home-range size estimates of rusa deer encompassing roughly 4 km2, with a core range of 1 km2 in Queensland, Australia, (Amos et al. 2023), being consistent with results elsewhere (Spaggiari and de Garine-Wichatitsky 2006; Pairah et al. 2015). Estimates of home-range size in sambar deer appear to vary on the basis of habitat, season, and sex, but most recent analyses in Taiwan have suggested average home ranges of 1.43 km2 in males and 0.7 km2 in females, which is largely consistent with previous work (Leslie 2011; Chatterjee et al. 2014; Yen et al. 2019). Dispersal via kinship analysis showed that rusa and sambar deer movements were largely within these ranges, with over half of all kin pairs moving 0–5 km for both species; however, some dispersal events were >10 km, with the highest reported distance of 61.2 km between two sambar deer. It is not possible to confirm through these analyses if a single deer has travelled this distance, or if both sibling pairs have equally dispersed at smaller distances; nonetheless, the estimates of lifetime dispersal measured through both spatial autocorrelation and kinship would suggest that movement is largely limited. However, some consideration of the drivers of dispersal and how sambar and rusa deer have come to disperse across much of Victoria and NSW is needed. Larger home ranges in male sambar deer are attributed to the exploratory nature of males during rut to find females (Chatterjee et al. 2014), and it is common for males and juveniles to be the predominant dispersers in many mammalian species (Stephen Dobson 1982; Shaw et al. 2006). Dispersal can also be observed through attempts to avoid inbreeding with relatives during breeding seasons (Long et al. 2008; Biosa et al. 2015), and environmental factors such as habitat cover, landscape features, and bushfires may also be important to understand natural deer movement (Long et al. 2005; Long et al. 2010; Kelly et al. 2014; Davis et al. 2016). However, given the distances among samples in some of the genetic clusters identified in both the sambar deer and rusa deer datasets, particularly between Willow Tree and southern NSW/Gippsland for sambar deer (~490 km between the nearest sites), and Wollongong and Port Macquarie for rusa deer, anthropogenic dispersal may also provide some explanation. Releases or escapees of deer from farms have already been discussed as a potential cause of some of the genetic structure and hybrids observed in the dataset and are additionally likely to contribute to increases in deer distributions. Additionally, translocations by hunters keen to expand hunting opportunities in their local areas can lead to increases in range of sambar and rusa deer. Given the large distance between the sample collected from Willow Tree and the other samples assigned to this cluster in southern NSW/Gippsland, and the high degree of genetic similarity, it is likely that this sample represents a translocated animal or a descendent. Translocated deer and pigs have been detected via genetic methods in Australia previously (Spencer and Hampton 2005; Hill et al. 2022), and elsewhere in the world (Frantz et al. 2006; McDevitt et al. 2009; Carden et al. 2011), with many of the deer populations present in Australia today believed to have arisen through recent translocations (Moriarty 2004). Additional genetic sampling of Willow Tree and surrounds is necessary to understand the extent of translocations in this area.
Management implications
Measurements of lifetime dispersal capabilities of rusa and sambar deer, and the presence of population structure between sambar deer sites sampled, provide some insights for population control moving forward. Although rusa deer populations in Wollongong and Port Macquarie appear genetically similar, the dispersal capability of this species suggests that they cannot rapidly disperse between these sites and can be managed separately. However, additional sampling in Port Macquarie can confirm that kin do not appear between these two sites. Assessment of genetic structure within a single population of rusa deer (Li-Williams et al. 2023) also suggests that localised management units of rusa deer can additionally be identified for further management intervention and highlights the need for localised studies in both species in the future. In sambar deer, population structure is evident, suggesting multiple management units where population control can be undertaken independently. Currently, Port Macquarie is managed separately to Cattai Wetlands and Harrington; however, the results reported here suggest that gene flow exists among these sites, with kinship pairs observed among the three areas. It would therefore be beneficial in future to coordinate population control of these sites to achieve greater reductions in deer density overall and maintain reductions at either site. Further sampling of deer at these sites would also be of value to determine whether the connectivity observed extends to additional deer species. Rusa deer occur at these sites as well, in addition to fallow deer (Dama dama), red deer, and chital deer (Axis axis) at Port Macquarie (Pacioni et al. 2021) and understanding dispersal pathways and connectivity early in the invasion process can greatly assist in successfully managing problematic species (LaRue et al. 2011; Adams et al. 2014). The Werakata National Park population appears isolated from all other sambar deer populations; however, additional monitoring is necessary to understand the range of this population.
The southern NSW/Gippsland population of sambar deer will be much more challenging to manage given the scale of gene flow across this region. Management of the species should continue in high-priority sites such as National Parks to reduce their impacts. Results of lifetime dispersal capability of sambar deer can assist in determining local scales of population control to reduce reinvasion. Further research is necessary across Gippsland and southern NSW to determine potential landscape features that may be facilitating or limiting gene flow in sambar deer. Forest cover has already been suggested as important for sambar deer dispersal (Davies et al. 2022), so confirming this in addition to identifying potential barriers can assist in using landscape or human-made features to aid control within this region. However, challenges in ensuring any artificial barriers to deer dispersal do not also negatively affect movements of native species are also likely to arise (Jones et al. 2021).
Last, further research is necessary to understand the impacts rusa × sambar deer hybrids are likely to have on the Australian landscape, and if management at sites where hybrids occur should be considered a high priority to prevent further spread. Measuring phenotypic, behavioural, and fitness changes in hybrids compared with parental species is warranted to understand the scope of this potential threat. Currently, hybridisation appears to be mostly isolated to the northern NSW region; however, further sampling of the contact zone between the two species at the Victorian–NSW border will elucidate the likelihood of hybrids further spreading throughout this region.
Data availability
Raw data have been uploaded to CloudStor and will become publicly available upon publication of the manuscript.
Conflicts of interest
David Forsyth was a guest Associate Editor for this special issue. Despite this relationship, he did not at any stage have editor-level access to this manuscript while in peer review, as is the standard practice when handling manuscripts submitted by an editor to this journal. Wildlife Research encourages its editors to publish in the journal, and they are kept separate from their manuscripts’ decision-making process. The other authors have no relevant financial or non-financial interests to disclose.
Acknowledgements
The authors acknowledge staff from Parks Victoria, Department of Environment, Land, Water and Planning, and NSW Department of Primary industry as well as Jake Haddad (VPAC), Kirk Stone (Strathbogie Wildlife), for their assistance with the sample collection. We are grateful to Bill Sherwin for his contribution to the study and useful comments on an early draft of this paper.
References
Adams A, van Heezik Y, Dickinson K, Robertson B (2014) Identifying eradication units in an invasive mammalian pest species. Biological Invasions 16, 1481-1496.
| Google Scholar |
Amos M, Pople A, Brennan M, Sheil D, Kimber M, Cathcart A (2023) Home ranges of rusa deer (Cervus timorensis) in a subtropical peri-urban environment in south east Queensland. Australian Mammalogy 45(1), 116-120.
| Crossref | Google Scholar |
Anderson EC, Thompson EA (2002) A model-based method for identifying species hybrids using multilocus genetic data. Genetics 160, 1217-1229.
| Crossref | Google Scholar |
Arnaud-Haond S, Teixeira S, Massa I, Billot C, Saenger P, Coupland G, Duarte CM, Serrao EA (2006) Genetic structure at range edge: low diversity and high inbreeding in Southeast Asian mangrove (Avicennia marina) populations. Molecular Ecology 15, 3515-3525.
| Crossref | Google Scholar |
Asher GW, Berg DK, Beaumont S, Morrow CJ, O’Neill KT, Fisher MW (1996) Comparison of seasonal changes in reproductive parameters of adult male European fallow deer (Dama dama dama) and hybrid Mesopotamian × European fallow deer (d. D. Mesopotamica × d. D. Dama). Animal Reproduction Science 45, 201-215.
| Crossref | Google Scholar |
Assis J, Castilho Coelho N, Alberto F, Valero M, Raimondi P, Reed D, Alvares Serrão E (2013) High and distinct range-edge genetic diversity despite local bottlenecks. PLoS ONE 8, e68646.
| Crossref | Google Scholar |
Barbato M, Hailer F, Orozco-terWengel P, Kijas J, Mereu P, Cabras P, Mazza R, Pirastru M, Bruford MW (2017) Genomic signatures of adaptive introgression from European mouflon into domestic sheep. Scientific Reports 7, 7623.
| Crossref | Google Scholar |
Bengsen AJ, Forsyth DM, Ramsey DSL, Amos M, Brennan M, Pople AR, Comte S, Crittle T (2022a) Estimating deer density and abundance using spatial mark–resight models with camera trap data. Journal of Mammalogy 103, 711-722.
| Crossref | Google Scholar |
Bengsen AJ, Forsyth DM, Pople A, Brennan M, Amos M, Leeson M, Cox TE, Gray B, Orgill O, Hampton JO, Crittle T, Haebich K (2022b) Effectiveness and costs of helicopter-based shooting of deer. Wildlife Research
| Crossref | Google Scholar |
Bennett A, Coulson G (2010) The impacts of sambar Cervus unicolor on the threatened shiny nematolepis Nematolepis wilsonii. Pacific Conservation Biology 16, 251-260.
| Crossref | Google Scholar |
Biosa D, Grignolio S, Sica N, Pagon N, Scandura M, Apollonio M (2015) Do relatives like to stay closer? Spatial organization and genetic relatedness in a mountain roe deer population. Journal of Zoology 296, 30-37.
| Crossref | Google Scholar |
Blanchong JA, Sorin AB, Scribner KT (2013) Genetic diversity and population structure in urban white-tailed deer. The Journal of Wildlife Management 77, 855-862.
| Crossref | Google Scholar |
Burgin S, Mattila M, McPhee D, Hundloe T (2015) Feral deer in the suburbs: an emerging issue for Australia? Human Dimensions of Wildlife 20, 65-80.
| Crossref | Google Scholar |
Carden RF, Carlin CM, Marnell F, Mcelholm D, Hetherington J, Gammell MP (2011) Distribution and range expansion of deer in Ireland. Mammal Review 41, 313-325.
| Crossref | Google Scholar |
Caye K, Deist TM, Martins H, Michel O, François O (2016) TESS3: fast inference of spatial population structure and genome scans for selection. Molecular Ecology Resources 16, 540-548.
| Crossref | Google Scholar |
Chatterjee D, Sankar K, Qureshi Q, Malik PK, Nigam P (2014) Ranging pattern and habitat use of sambar (Rusa unicolor) in Sariska Tiger Reserve, Rajasthan, western India. DSG Newsletter 26, 60-71.
| Google Scholar |
Combe FJ, Jaster L, Ricketts A, Haukos D, Hope AG (2022) Population genomics of free-ranging great plains white-tailed and mule deer reflects a long history of interspecific hybridization. Evolutionary Applications 15, 111-131.
| Crossref | Google Scholar |
Comte S, Thomas E, Bengsen AJ, Bennett A, Davis NE, Freney S, Jackson SM, White M, Forsyth DM, Brown D (2022) Seasonal and daily activity of non-native sambar deer in and around high-elevation peatlands, south-eastern Australia. Wildlife Research 49, 659-672.
| Crossref | Google Scholar |
Cowled BD, Aldenhoven J, Odeh IOA, Garrett T, Moran C, Lapidge SJ (2008) Feral pig population structuring in the rangelands of eastern Australia: applications for designing adaptive management units. Conservation Genetics 9, 211-224.
| Crossref | Google Scholar |
Cripps JK, Pacioni C, Scroggie MP, Woolnough AP, Ramsey DSL (2019) Introduced deer and their potential role in disease transmission to livestock in Australia. Mammal Review 49, 60-77.
| Crossref | Google Scholar |
Davies C, Wright W, Hogan F, Visintin C (2020) Predicting deer–vehicle collision risk across Victoria, Australia. Australian Mammalogy 42, 293-301.
| Crossref | Google Scholar |
Davies C, Wright W, Wedrowicz F, Pacioni C, Hogan FE (2022) Delineating genetic management units of sambar deer (Rusa unicolor) in south-eastern Australia, using opportunistic tissue sampling and targeted scat collection. Wildlife Research 49, 147-157.
| Crossref | Google Scholar |
Davis NE, Coulson G, Forsyth DM (2008) Diets of native and introduced mammalian herbivores in shrub-encroached grassy woodland, south-eastern Australia. Wildlife Research 35, 684-694.
| Crossref | Google Scholar |
Davis NE, Forsyth DM, Coulson G (2010) Facilitative interactions between an exotic mammal and native and exotic plants: hog deer (Axis porcinus) as seed dispersers in south-eastern Australia. Biological Invasions 12, 1079-1092.
| Crossref | Google Scholar |
Davis NE, Bennett A, Forsyth DM, Bowman DMJS, Lefroy EC, Wood SW, Woolnough AP, West P, Hampton JO, Johnson CN (2016) A systematic review of the impacts and management of introduced deer (family Cervidae) in Australia. Wildlife Research 43, 515-532.
| Crossref | Google Scholar |
Delignette-Muller ML, Dutang C (2015) fitdistrplus: an R package for fitting distributions. Journal of Statistical Software 64, 1-34.
| Crossref | Google Scholar |
De Meeûs T (2018) Revisiting FIS, FST, wahlund effects, and null alleles. Journal of Heredity 109, 446-456.
| Crossref | Google Scholar |
De Meeûs T, Guégan J-F, Teriokhin AT (2009) MultiTest v.1.2, a program to binomially combine independent tests and performance comparison with other related methods on proportional data. BMC Bioinformatics 10, 443.
| Crossref | Google Scholar |
Do C, Waples RS, Peel D, Macbeth G, Tillett BJ, Ovenden JR (2014) NeEstimator v2: re-implementation of software for the estimation of contemporary effective population size (Ne) from genetic data. Molecular Ecology Resources 14, 209-214.
| Crossref | Google Scholar |
Dolman PM, Wäber K (2008) Ecosystem and competition impacts of introduced deer. Wildlife Research 35, 202-214.
| Crossref | Google Scholar |
Double MC, Peakall R, Beck NR, Cockburn A (2005) Dispersal, philopatry, and infidelity: dissecting local genetic swtructure in superb fairy-wrens (Malurs cyaneus). Evolution 59, 625-635.
| Crossref | Google Scholar |
Dryden GM (2000) Biology and production attributes of the farmed rusa deer. Asian-Australasian Journal of Animal Sciences 13, 69-72.
| Google Scholar |
Eckert CG, Samis KE, Lougheed SC (2008) Genetic variation across species’ geographical ranges: the central–marginal hypothesis and beyond. Molecular Ecology 17, 1170-1188.
| Crossref | Google Scholar |
Flanagan SP, Jones AG (2019) The future of parentage analysis: from microsatellites to SNPs and beyond. Molecular Ecology 28, 544-567.
| Crossref | Google Scholar |
Forsyth DM, Pople T, Page B, Moriarty A, Ramsey D, Parkes J, Wiebkin A, Lane C (Eds) (2017) 2016 National wild deer management workshop proceedings, 17–18 November 2016, Adelaide, SA, Australia. (Invasive Animals Cooperative Research Centre: Canberra, ACT, Australia) Available at https://pestsmart.org.au/wp-content/uploads/sites/3/2020/06/Proceedings-2016-National-Workshop-on-Deer-Management_FINAL.pdf
Frantz AC, Pourtois JT, Heuertz M, Schley L, Flamand MC, Krier A, Bertouille S, Chaumont F, Burke T (2006) Genetic structure and assignment tests demonstrate illegal translocation of red deer (Cervus elaphus) into a continuous population. Molecular Ecology 15, 3191-3203.
| Crossref | Google Scholar |
Fraser EJ, Macdonald DW, Oliver MK, Piertney S, Lambin X (2013) Using population genetic structure of an invasive mammal to target control efforts – an example of the American mink in Scotland. Biological Conservation 167, 35-42.
| Crossref | Google Scholar |
Fraser DL, Ironside K, Wayne RK, Boydston EE (2019) Connectivity of mule deer (Odocoileus hemionus) populations in a highly fragmented urban landscape. Landscape Ecology 34, 1097-1115.
| Crossref | Google Scholar |
Goedbloed DJ, Megens HJ, Van Hooft P, Herrero-Medrano JM, Lutz W, Alexandri P, Crooijmans RPMA, Groenen M, Van Wieren SE, Ydenberg RC, Prins HHT (2013) Genome-wide single nucleotide polymorphism analysis reveals recent genetic introgression from domestic pigs into Northwest European wild boar populations. Molecular Ecology 22, 856-866.
| Crossref | Google Scholar |
Grossen C, Keller L, Biebach I, The International Goat Genome Consortium, Croll D (2014) Introgression from domestic goat generated variation at the major histocompatibility complex of alpine ibex. PLoS Genetics 10, e1004438.
| Crossref | Google Scholar |
Hampton JO, Davis NE (2020) Impacts of introduced deer in Victoria. Victorian Naturalist 137, 276-281.
| Google Scholar |
Helyar SJ, Hemmer-Hansen J, Bekkevold D, Taylor MI, Ogden R, Limborg MT, Cariani A, Maes GE, Diopere E, Carvalho GR, Nielsen EE (2011) Application of SNPs for population genetics of nonmodel organisms: new opportunities and challenges. Molecular Ecology Resources 11, 123-136.
| Crossref | Google Scholar |
Hill E, Linacre A, Toop S, Murphy N, Strugnell J (2019) Widespread hybridization in the introduced hog deer population of Victoria, Australia, and its implications for conservation. Ecology and Evolution 9, 10828-10842.
| Crossref | Google Scholar |
Hill E, Murphy N, Toop S, Linacre A, Strugnell JM (2022) Genetic analysis of hog deer (Axis porcinus) in Victoria, Australia, and its applications to invasive species and game management. European Journal of Wildlife Research 68, 45.
| Crossref | Google Scholar |
Honda T, Iijima H, Tsuboi J, Uchida K (2018) A review of urban wildlife management from the animal personality perspective: the case of urban deer. Science of The Total Environment 644, 576-582.
| Crossref | Google Scholar |
Huaman JL, Pacioni C, Forsyth DM, Pople A, Hampton JO, Carvalho TG, Helbig KJ (2020) Serosurveillance and molecular investigation of wild deer in Australia reveals seroprevalence of pestivirus infection. Viruses 12, 752.
| Crossref | Google Scholar |
Iacolina L, Corlatti L, Buzan E, Safner T, Šprem N (2019) Hybridisation in European ungulates: an overview of the current status, causes, and consequences. Mammal Review 49, 45-59.
| Crossref | Google Scholar |
Ismail I, Saidi M (2009) Somatic chromosomes of the bornean sambar deer and rusa deer interspecific hybrids. American Journal of Applied Sciences 6, 862-868.
| Crossref | Google Scholar |
Johansson ML, Dufour BA, Wellband KW, Corkum LD, MacIsaac HJ, Heath DD (2018) Human-mediated and natural dispersal of an invasive fish in the eastern Great Lakes. Heredity 120, 533-546.
| Crossref | Google Scholar |
Jones OR, Wang J (2010) COLONY: a program for parentage and sibship inference from multilocus genotype data. Molecular Ecology Resources 10, 551-555.
| Crossref | Google Scholar |
Jones PE, Tummers JS, Galib SM, Woodford DJ, Hume JB, Silva LGM, Braga RR, Garcia de Leaniz C, Vitule JRS, Herder JE, Lucas MC (2021) The use of barriers to limit the spread of aquatic invasive animal species: a global review. Frontiers in Ecology and Evolution 9, 611631.
| Crossref | Google Scholar |
Kajita Y, O’Neill EM, Zheng Y, Obrycki JJ, Weisrock DW (2012) A population genetic signature of human releases in an invasive ladybeetle. Molecular Ecology 21, 5473-5483.
| Crossref | Google Scholar |
Keith D, Pellow B (2005) Effects of Javan rusa deer (Cervus timorensis) on native plant species in the Jibbon-Bundeena area, Royal National Park, New South Wales. Proceedings of the Linnean Society of New South Wales 126, 99-110.
| Google Scholar |
Kelly AC, Mateus-Pinilla NE, Brown W, Ruiz MO, Douglas MR, Douglas ME, Shelton P, Beissel T, Novakofski J (2014) Genetic assessment of environmental features that influence deer dispersal: implications for prion-infected populations. Population Ecology 56, 327-340.
| Crossref | Google Scholar |
LaRue EA, Ruetz CR, III, Stacey MB, Thum RA (2011) Population genetic structure of the round goby in Lake Michigan: implications for dispersal of invasive species. Hydrobiologia 663, 71-82.
| Crossref | Google Scholar |
Leslie DM, Jr. (2011) Rusa unicolor (Artiodactyla: Cervidae). Mammalian Species 43, 1-30.
| Crossref | Google Scholar |
Li Y-L, Liu J-X (2018) StructureSelector: a web-based software to select and visualize the optimal number of clusters using multiple methods. Molecular Ecology Resources 18, 176-177.
| Crossref | Google Scholar |
Li-Williams S, Stuart KC, Comte S, Forsyth DM, Dawson M, Sherwin WB, Rollins LA (2023) Genetic analysis reveals spatial structure in an expanding introduced rusa deer population. Wildlife Research
| Crossref | Google Scholar |
Long ES, Diefenbach DR, Rosenberry CS, Wallingford BD, Grund MD (2005) Forest cover influences dispersal distance of white-tailed deer. Journal of Mammalogy 86, 623-629.
| Crossref | Google Scholar |
Long ES, Diefenbach DR, Wallingford BD, Rosenberry CS (2008) Multiple proximate and ultimate causes of natal dispersal in white-tailed deer. Behavioral Ecology 19, 1235-1242.
| Crossref | Google Scholar |
Long ES, Diefenbach DR, Wallingford BD, Rosenberry CS (2010) Influence of roads, rivers, and mountains on natal dispersal of white-tailed deer. The Journal of Wildlife Management 74, 1242-1249.
| Crossref | Google Scholar |
Manunza A, Amills M, Noce A, Cabrera B, Zidi A, Eghbalsaied S, de Albornoz EC, Portell M, Mercadé A, Sánchez A, Balteanu V (2016) Romanian wild boars and mangalitza pigs have a European ancestry and harbour genetic signatures compatible with past population bottlenecks. Scientific Reports 6, 29913.
| Crossref | Google Scholar |
Martins RF, Schmidt A, Lenz D, Wilting A, Fickel J (2018) Human-mediated introduction of introgressed deer across Wallace’s line: historical biogeography of Rusa unicolor and R. timorensis. Ecology and Evolution 8, 1465-1479.
| Crossref | Google Scholar |
McDevitt AD, Edwards CJ, O’Toole P, O’Sullivan P, O’Reilly C, Carden RF (2009) Genetic structure of, and hybridisation between, red (Cervus elaphus) and sika (Cervus nippon) deer in Ireland. Mammalian Biology 74, 263-273.
| Crossref | Google Scholar |
McDowell R (2007) Water quality in headwater catchments with deer wallows. Journal of Environmental Quality 36, 1377-1382.
| Crossref | Google Scholar |
Mijangos JL, Gruber B, Berry O, Pacioni C, Georges A (2022) dartr v2: an accessible genetic analysis platform for conservation, ecology and agriculture. Methods in Ecology and Evolution 13, 2150-2158.
| Crossref | Google Scholar |
Moloney PD, Hampton JO (2020) Estimates of the 2019 deer harvest in Victoria: results from surveys of game licence holders in 2019. Unpublished client report for the game management authority. Arthur Rylah Institute for Environmental Research, Department of Environment, Land, Water and Planning, Melbourne, Vic., Australia.
Moloney PD, Gormley AM, Toop SD, Flesch JS, Forsyth DM, Ramsey DSL, Hampton JO (2022) Bayesian modelling reveals differences in long-term trends in the harvest of native and introduced species by recreational hunters in Australia. Wildlife Research 49, 673-685.
| Crossref | Google Scholar |
Mora M, Medina-Vogel G, Sepúlveda MA, Noll D, Álvarez-Varas R, Vianna JA (2018) Genetic structure of introduced American mink (Neovison vison) in Patagonia: colonisation insights and implications for control and management strategies. Wildlife Research 45, 344-356.
| Crossref | Google Scholar |
Moriarty A (2004) The liberation, distribution, abundance and management of wild deer in Australia. Wildlife Research 31, 291-299.
| Crossref | Google Scholar |
Nei M (1978) Estimation of average heterozygosity and genetic distance from a small number of individuals. Genetics 89, 583-590.
| Crossref | Google Scholar |
Pacioni C, Hill E, Murphy NP (2021) Population estimates and connectivity of deer populations in Port Macquarie. Unpublished client report for the NSW Department of Industry. Arthur Rylah Institute for Environmental Research, Department of Environment, Land, Water and Planning, Melbourne, Vic., Australia.
Pairah , Santosa Y, Prasetyo LB, Mustari AH (2015) Home range and habitat use of reintroduced Javan Deer in Panaitan Island, Ujung Kulon National Park. Journal of Asia-Pacific Biodiversity 8, 203-209.
| Crossref | Google Scholar |
Peakall R, Ruibal M, Lindenmayer DB (2003) Spatial autocorrelation analysis offers new insights into gene flow in the Australian bush rat, Rattus fuscipes. Evolution 57, 1182-1195.
| Crossref | Google Scholar |
Raj A, Stephens M, Pritchard JK (2014) fastSTRUCTURE: variational inference of population structure in large SNP data sets. Genetics 197, 573-589.
| Crossref | Google Scholar |
Roberts C, Westbrooke M, Florentine S, Cook S (2015) Winter diet of introduced red deer (Cervus elaphus) in woodland vegetation in Grampians National Park, western Victoria. Australian Mammalogy 37, 107-112.
| Crossref | Google Scholar |
Rollins LA, Lees D, Woolnough AP, West AJ, Perry M, Forsyth DM (2023) Origins and population genetics of sambar deer (Cervus unicolor) introduced to Australia and New Zealand. Wildlife Research. doi:10.1071/WR22120
Semiadi G, Muir PD, Barry TN (1994) General biology of sambar deer (Cervus unicolor) in captivity. New Zealand Journal of Agricultural Research 37, 79-85.
| Crossref | Google Scholar |
Senn HV, Swanson GM, Goodman SJ, Barton NH, Pemberton JM (2010) Phenotypic correlates of hybridisation between red and sika deer (genus Cervus). Journal of Animal Ecology 414-425.
| Crossref | Google Scholar |
Shaw JC, Lancia RA, Conner MC, Rosenberry CS (2006) Effect of population demographics and social pressures on white-tailed deer dispersal ecology. Journal of Wildlife Management 70, 1293-1301.
| Crossref | Google Scholar |
Short KH, Petren K (2011) Fine-scale genetic structure arises during range expansion of an invasive gecko. PLoS ONE 6, e26258.
| Crossref | Google Scholar |
Sjodin BMF, Irvine RL, Ford AT, Howald GR, Russello MA (2020) Rattus population genomics across the Haida Gwaii Archipelago provides a framework for guiding invasive species management. Evolutionary Applications 13, 889-904.
| Crossref | Google Scholar |
Smith SL, Carden RF, Coad B, Birkitt T, Pemberton JM (2014) A survey of the hybridisation status of Cervus deer species on the island of Ireland. Conservation Genetics 15, 823-835.
| Crossref | Google Scholar |
Smouse PE, Peakall R (1999) Spatial autocorrelation analysis of individual multiallele and multilocus genetic structure. Heredity 82, 561-573.
| Crossref | Google Scholar |
Spaggiari J, de Garine-Wichatitsky M (2006) Home range and habitat use of introduced rusa deer (Cervus timorensis russa) in a mosaic of savannah and native sclerophyll forest of New Caledonia. New Zealand Journal of Zoology 33, 175-183.
| Crossref | Google Scholar |
Spencer PBS, Hampton JO (2005) Illegal translocation and genetic structure of feral pigs in Western Australia. The Journal of Wildlife Management 69, 377-384.
| Crossref | Google Scholar |
Stephen Dobson F (1982) Competition for mates and predominant juvenile male dispersal in mammals. Animal Behaviour 30, 1183-1192.
| Crossref | Google Scholar |
Tate ML, Goosen GJ, Patene H, Pearse AJ, McEwan KM, Fennessy PF (1997) Genetic analysis of père david’s × red deer interspecies hybrids. Journal of Heredity 88, 361-365.
| Crossref | Google Scholar |
Waples RS (2015) Testing for Hardy–Weinberg proportions: have we lost the plot? Journal of Heredity 106, 1-19.
| Crossref | Google Scholar |
Watter K, Thomas E, White N, Finch N, Murray PJ (2020) Reproductive seasonality and rate of increase of wild sambar deer (Rusa unicolor) in a new environment, Victoria, Australia. Animal Reproduction Science 223, 106630.
| Crossref | Google Scholar |
Webley LS, Zenger KR, English AW, Cooper DW (2004) Low levels of genetic variation within introduced Javan rusa deer (Cervus timorensis russa) in Australia. European Journal of Wildlife Research 50, 137-140.
| Crossref | Google Scholar |
Wigginton JE, Cutler DJ, Abecasis GR (2005) A note on exact tests of Hardy–Weinberg equilibrium. The American Journal of Human Genetics 76, 887-893.
| Crossref | Google Scholar |
Wringe BF, Stanley RR, Jeffery NW, Anderson EC, Bradbury IR (2017) parallelnewhybrid: an R package for the parallelization of hybrid detection using newhybrids. Molecular Ecology Resources 17, 91-95.
| Crossref | Google Scholar |
Yen S-C, Wang Y, Yu P-H, Kuan Y-P, Liao Y-C, Chen K-H, Weng G-J (2019) Seasonal space use and habitat selection of sambar in Taiwan. The Journal of Wildlife Management 83, 22-31.
| Crossref | Google Scholar |
Zalewski A, Michalska-Parda A, Bartoszewicz M, Kozakiewicz M, Brzeziński M (2010) Multiple introductions determine the genetic structure of an invasive species population: American mink Neovison vison in Poland. Biological Conservation 143, 1355-1363.
| Crossref | Google Scholar |