

Diet and impacts of non-native fallow deer (Dama dama) on pastoral properties during severe drought
Naomi E. Davis A * , David M. Forsyth B and Andrew J. Bengsen B
A School of BioSciences, The University of Melbourne, Parkville, Vic. 3010, Australia.
B Vertebrate Pest Research Unit, New South Wales Department of Primary Industries, 1447 Forest Road, Orange, NSW 2800, Australia.
Wildlife Research 50(9) 701-715 https://doi.org/10.1071/WR22106
Submitted: 18 June 2022 Accepted: 21 March 2023 Published: 31 July 2023
© 2023 The Author(s) (or their employer(s)). Published by CSIRO Publishing. This is an open access article distributed under the Creative Commons Attribution-NonCommercial-NoDerivatives 4.0 International License (CC BY-NC-ND)
Abstract
Context: There is concern about potential competition between non-native fallow deer (Dama dama) and livestock for food, particularly during times of low rainfall when pasture is scarce.
Aims: We aimed to estimate the extent to which a high-density fallow deer population (~37 deer per km2) competed with livestock for food during a severe drought on pastoral properties on the Liverpool Plains, New South Wales, Australia.
Methods: We collected rumen contents from 125 fallow deer shot from helicopters during control operations in June and August 2018, and used microhistology to quantify their diets. We then used the diet data to adjust published estimates of stock unit equivalence from farmed fallow deer. Fallow deer sex and age class abundances and stock unit equivalences were multiplied to estimate the grazing pressure of the fallow deer population pre- and post-control relative to recommended sheep and cattle stocking rates. Finally, we estimated density–impact relationships for fallow deer.
Key results: Fallow deer diet was dominated by monocots (primarily grasses), but some individuals consumed large amounts of dicots (commonly Eucalyptus). Fallow deer were grazers to intermediate mixed feeders. Fallow deer dry-sheep equivalents (DSEs, based on a 50-kg merino wether) varied from 1.01 (juveniles) to 1.85 (adult females and adult males). Assuming complete diet overlap, the pre-control fallow deer population was equivalent to approximately 60.3 DSEs per km2 and reduced the potential stocking rate of domestic livestock by 50.2%. Discounting the fallow deer DSEs by the amount of browse in the diet resulted in a pre-control population of 45.7 DSEs per km2. The helicopter-based shooting reduced the fallow deer population by 26%, increasing the stocking rate in natural pasture by 22.0% (complete overlap) or 13.8% (discounting for browse).
Conclusions: When food is limiting, fallow deer at high density can exert strong competitive pressure on livestock, reducing carrying capacity. Browsing, including on Eucalyptus, likely helped fallow deer to persist at high densities during the severe drought of 2018, when properties had destocked.
Implications: Helicopter-based shooting reduced the competitive effects of fallow deer on livestock in our study area to only a small extent, but more intensive shooting would have led to a greater reduction. The helicopter-based shooting of deer was received positively by landholders at a time of severe stress, suggesting that deer control in agricultural areas can have other important benefits.
Keywords: agricultural impacts, Australia, competition, culling, density–impact relationships, dry stock equivalents, DSE, helicopter-based shooting, invasive species, livestock, microhistological analysis, rumen.
Introduction
Globally, non-native species from a wide range of taxonomic groups have become established in agricultural areas, where they can have undesirable impacts (Pyšek and Richardson 2010). In Australasia, non-native deer are colonising agricultural areas through natural dispersal, farm escapes and human-assisted liberations (Moriarty 2004; Nugent and Asher 2021; Nugent and Forsyth 2021; Cunningham et al. 2022). The consumption of forage that would otherwise be eaten by sheep and cattle (hereinafter livestock) has been identified as a key agricultural impact of wild deer in Australasia (Forsyth et al. 2017; Latham et al. 2020; Watter et al. 2020). On a 382 km2 cattle property in northern Queensland, Watter et al. (2020) estimated that the forage consumed by 100 non-native chital deer (Axis axis) would have supported 14 and 25 cattle in the dry and wet seasons respectively.
The fallow deer (Dama dama; adult females 38 kg, adult males 59 kg; Bentley 1995) is the most numerous and most widely distributed non-native deer species in the world (Chapman and Chapman 1997; Long 2003; Nugent et al. in press). The species occupies a wide range of biomes and climates, but prefers pasture and cropping areas interspersed with scrub, forest or woodland; hence, the distribution of fallow deer almost entirely coincides with vegetation modified by humans or domesticated livestock where mosaics of grassland and woodland meet their requirements for both forage and cover (Chapman and Chapman 1997; Cunningham et al. 2022).
Introduced to Australia in the early 19th century, fallow deer are now widespread in south-eastern mainland Australia and Tasmania, and their abundance and distribution continues to increase (Moriarty 2004; Mulley 2008; Crittle and Millynn 2020; Cunningham et al. 2022). As elsewhere in their global range, Australian fallow deer populations inhabit open grassy woodland and agricultural (i.e. pastoral and cropping) landscapes (Bengsen et al. 2022a; Bentley 1995; Cunningham et al. 2022). Fallow deer are intermediate feeders tending towards grass/roughage feeders (Hofmann 1989), and have been observed feeding on pasture and crops in Australia (Bentley 1998). Fallow deer have attained population densities of 37 deer per km2 in Australian pastoral habitats (Bengsen et al. 2022a; see below), and primary producers are concerned about the potential for this species to compete with livestock for forage. Given evidence that deer can reduce pasture biomass (Trdan and Vidrih 2008; Smith et al. 2012), consumption of forage could reduce livestock carrying capacity, particularly when forage availability is low during severe drought.
The food requirements of livestock and wild herbivores such as deer can be compared using grazing equivalents (Munn et al. 2016; Latham et al. 2020; Watter et al. 2020). In Australia, dry-sheep equivalents (DSEs) are used so that pastoralists can sustainably manage grazing on their properties by sheep, cattle and other livestock (Standing Committee on Agriculture and Resource Management: Ruminants Subcommittee 1990; Turner and Alcock 2000; Pahl 2019a). One DSE is the metabolisable energy (ME) required to maintain one 45- or 50-kg merino wether at a constant weight, with the current larger value of 50 kg adjusting for long-term increases in sheep mass (NSW Department of Primary Industries 2015; Graham 2017). DSEs have been estimated for commonly farmed deer species in Australia, including fallow deer (see below). However, wild deer can easily jump standard sheep and cattle fences (Chapman and Chapman 1997), and hence their diet can include items on improved pasture and crops and also native vegetation communities that livestock are excluded from. Wild deer have plastic diets, utilising foods that are rare (in space or time), but fallow deer consume more grass than do other European deer species (i.e. red deer (Cervus elaphus), roe deer (Capreolus capreolus) and moose (Alces alces); Spitzer et al. 2020). Fallow deer can stand up and browse trees (up to ≥1.5 m), and litterfall can be an important component of their diet in New Zealand native forest (Nugent 1990).
Estimates of production losses to wild mammalian herbivores are often limited by a lack of information regarding their food requirements (Munn et al. 2016) and population densities. Estimating the density of wild deer populations with useful precision is difficult, particularly at large spatial scales (Forsyth et al. 2022). If the grazing equivalents (e.g. DSEs) and population densities of wild mammalian herbivores are known, then density–impact relationships can be estimated (Latham et al. 2020).
Landholder concerns about the impacts of wild fallow deer in agricultural areas in Australia during the severe drought that occurred in New South Wales during 2016–2019 led to large-scale helicopter-based shooting operations there (Bengsen et al. 2022a; Hampton et al. 2022). Some of that shooting occurred on the Liverpool Plains, where helicopter mark–recapture distance sampling indicated that fallow deer were at a very high density (37 ± 15 per km2 in a 492-km2 area) prior to control (Bengsen et al. 2022a). The objective of this study was to estimate the extent to which this high-density fallow deer population reduced the carrying capacity of the study area for livestock (i.e. DSEs) during a severe drought. First, we quantified the diet of fallow deer by analysing the rumen contents of animals shot by helicopters. Second, we estimated the stock unit equivalence (DSEs) for fallow deer before and after correcting for the amount of browse in the diet. Third, we multiplied fallow deer population sex and age class abundances by stock unit equivalences to estimate the effect of this high-density population on livestock carrying capacity in the Liverpool Plains, before and after helicopter-based shooting (Bengsen et al. 2022a). Fourth, we estimated the density–impact relationship for fallow deer affecting livestock stocking rates on the dominant pasture type in our study area.
Materials and methods
Study area and deer abundance
Our study was conducted on five agricultural properties spanning the eastern Liverpool Plains and the western Liverpool Range, Northern Slopes region, New South Wales, Australia (−31.77°, 150.60°; Fig. 1). The properties represented a spatial sample of the broader study region, which comprised 492 km2 of mixed farming land on undulating terrain grading to native woodlands on the steeper basalt slopes of the Liverpool Range. The rich black soils of the Liverpool Plains support intensive cropping enterprises, whereas the peripheral ranges are dominated by livestock grazing. The properties on which our study was conducted consisted of some intensively used (i.e. small paddocks that were sometimes cropped) flat land that was mostly devoid of trees, surrounded by steeper slopes and ridges that were dominated by pasture and grassy woodlands and used for grazing livestock. The dominant pasture type was Natural (no seed or fertiliser), with smaller areas of Improved Natural (Natural + seed + fertiliser) and Perennial (grass/clover + fertiliser) (NSW Department of Primary Industries 2015). Tree species in the grassy woodlands included white box (Eucalyptus albens) and white cypress pine (Callitris glaucophylla) (NSW Office of Environment and Heritage 2017).
(a) Location of our study area in the Northern Slopes region, New South Wales, Australia (−31.77°, 150.60°), and (b) typical landscape, August 2018. In b, note the low forage biomass, absence of domestic livestock, and the adult male fallow deer shot from a helicopter and sampled for this study. Image: D. M. Forsyth.
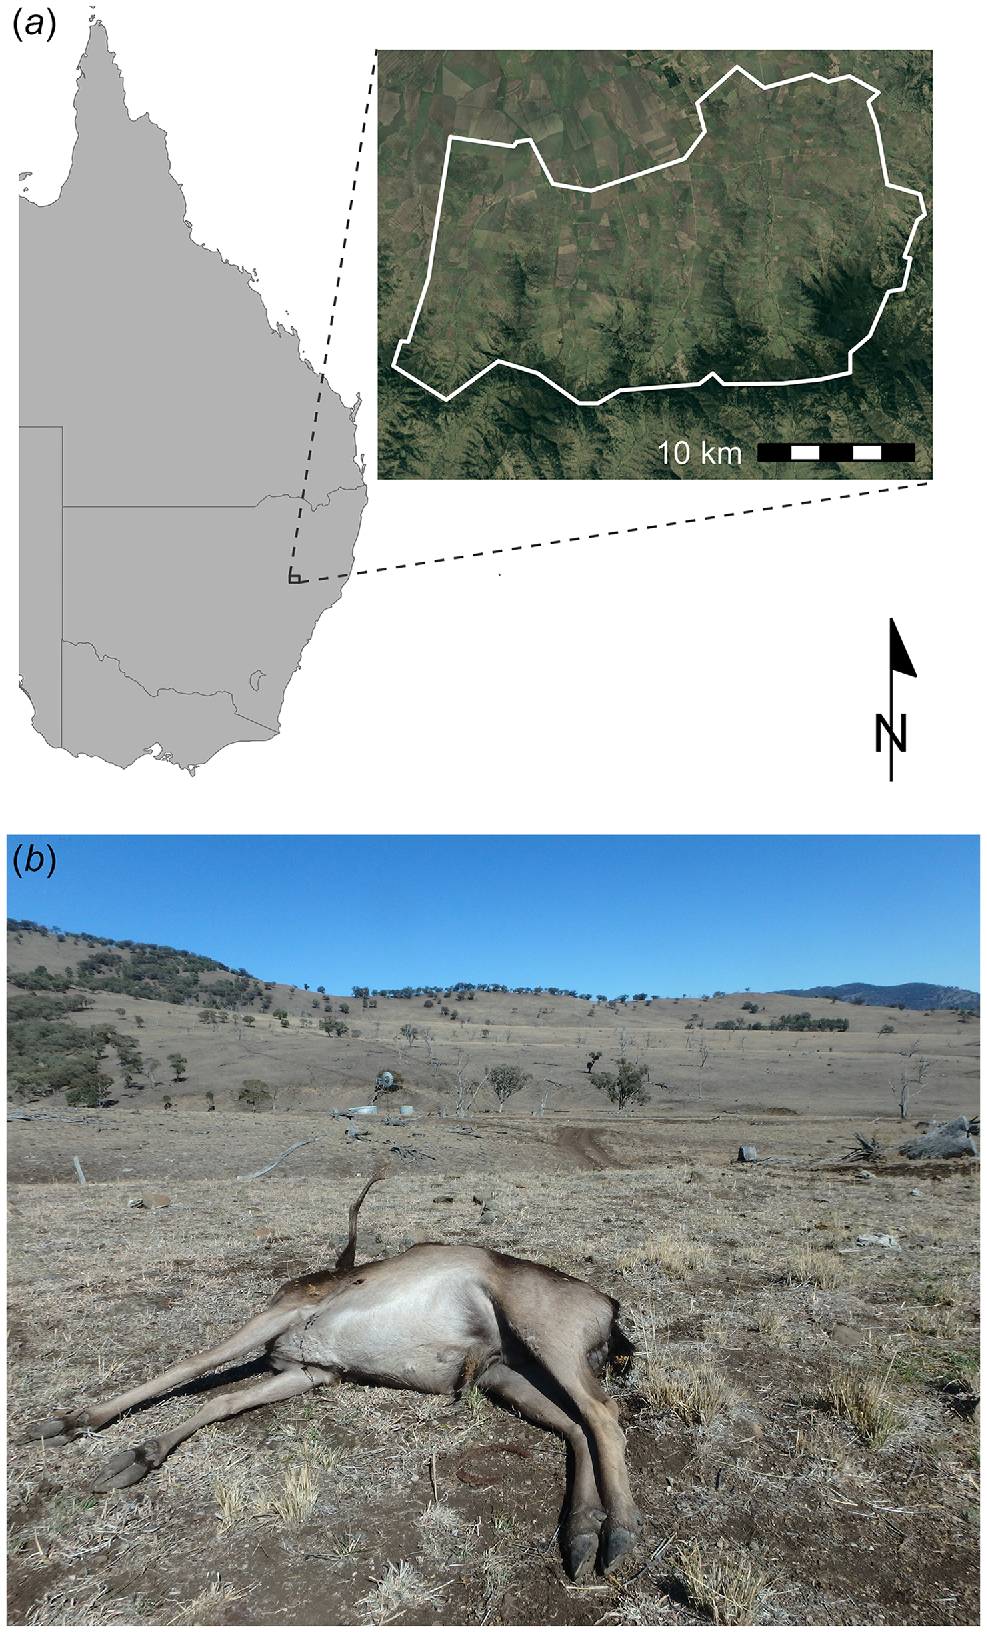
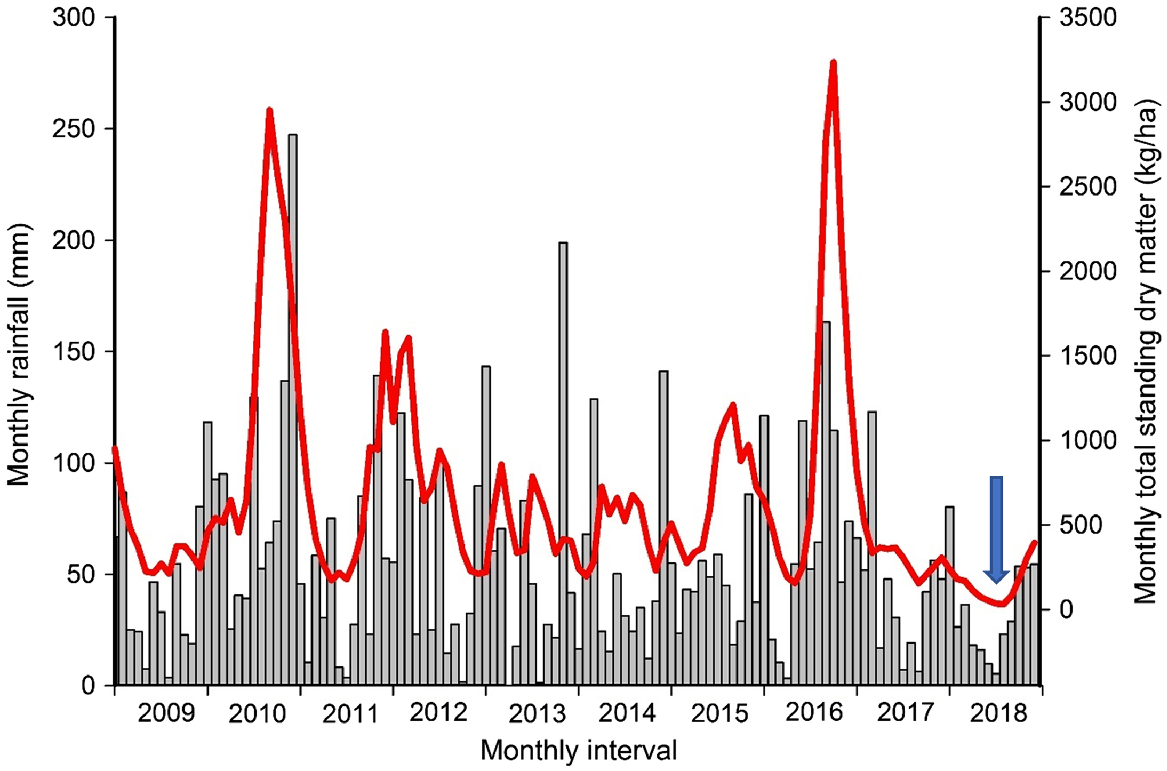
Our study was conducted in a period of severe drought (King et al. 2020) (Fig. 2). During the 85 years preceding our study, the mean annual September to August rainfall at one of the properties we sampled deer at (Parraweena Highlands) was 683 (s.d. = 170) mm, and during the 12 months up to and including our study (i.e. September 2017 to August 2018), the rainfall was 368 mm (Fig. 2). Monthly total standing dry matter in the Liverpool Plains Local Government area during our study was low relative to that in the preceding 9 years (Fig. 2). The predominant domestic livestock in the area are cattle and sheep, but during our study the properties had destocked because of the low forage biomass. The only crop observed on the five properties we worked on was one paddock of oat (Avena sativa) in August 2018.
Monthly rainfall (grey bars) at the Parraweena property, January 2009–December 2018, and modelled total standing dry matter (TSDM, kg/ha; red line) for the Liverpool Plains LGA (AussieGRASS), Northern Slopes region, New South Wales, Australia. The timing of our study (June and August 2018) is approximately as indicated by the arrow.
The abundance and density of deer in our study area were estimated using helicopter mark–recapture distance sampling (MRDS; Burt et al. 2014) during 21–25 May 2018. Full details of the survey methodology and data analysis are described by Bengsen et al. (2022a). Briefly, the survey was conducted over five survey blocks in the southern section of the Liverpool Plains. The study area was crossed by six transects, four of which were surveyed on three occasions (on different days to enable any deer that were disturbed by the previous survey to redistribute themselves on or near the transect lines), to obtain more observations to reliably model the detection function, providing a total of 225 km of survey effort. A zig-zag transect design based on north–south parallel lines 5 km apart was used to balance efficiency, survey area coverage, and visibility for the pilot. A Bell 206 Jetranger helicopter carrying two observers (front-left and rear-left seats) was flown at ~150 feet (46 m) above the ground at 50 knots (93 km h−1) airspeed with the doors removed. Sighting bars fitted to the helicopter, and calibrated with markers set at known distances on the ground prior to undertaking the surveys, allowed observers to group each deer observation into one of five classes of perpendicular distance to the observer (up to 150 m). Fallow deer (91% of observations) and red deer (9%) were observed in these surveys. The estimated (±s.d.) density of fallow deer was 37 ± 15 per km2.
Fallow deer diet
To reduce the perceived impacts of the high-density deer population in the study area, helicopter-based shooting was conducted in June and August 2018 (i.e. 1 and 3 months after the aerial survey). The June control operation removed 2814 deer from the study area, and a further 2499 deer were removed in August, which together included a total of 4197 fallow deer. The aerial shooting protocol followed the Feral Animal Aerial Shooting Team (FAAST) Manual (2020). Briefly, deer were shot from helicopters (Bell 206 Jetranger) at distances of 4–40 m by using an FN SCAR-H semi-automatic rifle chambered in .308 Winchester® (Fabrique National Herstal, Herstal, Belgium), fitted with a non-magnified red-dot scope. Ammunition was 135 grain hollow-point lead-based bullets. Repeat shooting was mandatory, with at least one shot in the thorax or the head, and a fly-back procedure was required to confirm that the animal was dead. Further details of the helicopter-based shooting protocol have been provided by Hampton et al. (2022) and Bengsen et al. (2022a).
We collected rumen contents from 125 fallow deer shot on five properties during the two control operations. The helicopter-based shooting team provided the locations of the dead deer at the end of their ~2-h shooting runs. We located the dead deer as soon as possible thereafter, always on the day that they were shot. When a dead deer was located, it was assigned to one of four sex and age classes according to its external genitalia (distinguishing males and females), the presence and configuration of antlers (distinguishing juvenile, yearling and adult males; Chapman and Chapman 1997), body size (age classes) and tooth eruption (Fraser and Sweetapple 1993). Following Mulley (1989: 41) and Focardi et al. (1996), the four sex and age classes were juveniles (Juv; males and females younger than 12 months), yearling males (YM; males aged between 12 and 24 months), adult females (AF; females older than 12 months), and adult males (AM; males older than 24 months). These four sex and age classes match with published estimates of fallow deer DSEs (see below). The date of sampling and latitude and longitude were also recorded for each deer. We collected ≥1000 mL of rumen contents from each deer. The rumen sample was double-bagged, labelled, and kept as cool as possible (usually in a vehicle fridge) until it was frozen later that day. Following thawing, we thoroughly mixed each sample prior to analysis. The same observer (N.E.D.) prepared and analysed all rumen contents.
We prepared a reference herbarium of 107 plant species for both macroscopic and microhistological analyses. We collected plant specimens during 1 day of searching, with the aim of collecting all vascular plants occurring within the study area. We prepared the macroscopic reference herbarium using pressed plant specimens, including stems, foliage, and, where possible, flowers and fruits. We prepared the microhistological reference herbarium by drying plants and cutting leaf material into 1-mm2 fragments by using fine scissors or a mortar and pestle, depending on the plant species. To simulate plant digestion and render the epidermis identifiable, we digested 10-mL portions of plant species in 4% sodium hypochlorite (White KingTM, Sara Lee, Sydney, Australia) for 1–48 h, depending on the species, and prepared reference slides using the standard microhistological techniques described below for microhistological diet analysis. We photographed reference plant material at ×20 and ×40 magnification by using a Nikon CoolScope CS1 (Nikon Corporation, Sakae-ku, Yokohama, Japan) digital microscope and camera.
All fallow deer rumen samples were analysed microhistologically following the methods described by Forsyth and Davis (2011), with modified digestion times and subsampling. Briefly, we prepared rumen samples using standard microhistological techniques (Anthony and Smith 1974; Norbury 1988). To render the epidermis of plant fragments identifiable, we digested 10-mL portions of each sample in 4% sodium hypochlorite (White KingTM) for 4 h, thereby removing mesophyll tissue (Holechek 1982). We then stained digested fragments by rinsing under running tap water in a 143-mm sieve, standing in a 1% aqueous solution of Gentian violet for 60 s, rinsing under running water, standing in 70% ethanol solution, then rinsing in running water. We used a fine brush to transfer four 1-mL subsamples per rumen to a corn syrup medium (KaroTM, Summit, IL, USA) on microscopic slides. We estimated percentage composition of categories of plant epidermal fragments by using point quadrat analysis (Norbury 1988). We scored the frequency of fragment types under a cross-hair graticule in one of the ocular lenses of a compound binocular microscope at ×100 magnification. We moved the slide systematically, half a field of view (900 μm) at a time, along longitudinal transects 1 mm apart. In each field of view, we identified the fragment under the intersection of the cross-hair until we had identified 100 fragments per rumen sample, on the basis of the microhistological reference herbarium photographs, coupled with descriptions of major diagnostic features (Storr 1961).
A subsample of 20 fallow deer rumens (10 males and 10 females collected in August 2018 from three properties) was analysed macroscopically. We used a simplified version of the sorting method outlined by Forsyth and Davis (2011) and Nugent (1983), because rumen contents were too finely masticated to allow detailed macroscopic sorting. Briefly, we washed rumen contents (500–1000 mL) over a 5.6-mm sieve to remove fine, unidentifiable material. We sorted the retained fragments into broad taxonomic categories [i.e. monocotyledons (monocots) vs eudicotyledons (dicots)], to genus level where possible, and by plant part. Identifications were macroanalytical (i.e. based on gross features of the ingested plant material; Kessler et al. 1981), aided by the macroscopic herbarium. Because the bulk of the rumen samples were highly fragmented, we used macroscopic sorting to detect the presence of plant categories only; we did not quantify the proportion of plant categories.
Statistical analyses
To summarise the microhistological estimates of the fallow deer diet, we constructed the following five levels of classification, each of which contained ≥2 categories into which we assigned identified plants: (1) broad taxonomic (monocots or dicots); (2) functional group [forbs, shrubs–trees, climbers, ferns, grasses, non-grass graminoid species (sedges, rushes and lilies)]; (3) plant origin (native to Australia or non-indigenous); (4) family; and (5) species. Pteridophytes (ferns) comprised <0.1% of the diet and were included with dicots for broad taxonomic comparisons, and excluded from functional group comparisons.
We graphically compared the estimated mean percentage of epidermal fragments identified per stomach sample in each category of Levels 1–2 between fallow deer collected during June and those collected during August, and between two sex–age classes, namely (1) adult males, and (2) adult females and their young (both male and female). We used these sexually segregated groups because sample sizes were too small to examine diets for each of the four sex–age classes separately. We used a Bayesian mixed-effects model to estimate change in the proportion of dicots in samples between June and August. Sampling period was specified as a fixed effect, and group (1:11) was specified as a random effect to account for autocorrelation among samples taken from individuals shot at the same place and time. The model was implemented using JAGS [v.4.3.0 (Plummer 2003), called via the runjags package (v.2.0.4-20) (Denwood 2016) in R (v3.3.3) (R Core Team 2020)]. We used a total of 300 000 Monte Carlo Markov chain draws after discarding 5000 burn-in draws from each of three chains.
To compare fallow deer diet composition among sampling periods and sex–age classes, we calculated the percentage contribution of each plant family to the total identifiable component of the fallow deer diet, and the percentage frequency of occurrence of each plant family (i.e. number of rumens containing each family/total number of rumens examined). We then used non-metric multidimensional scaling (NMDS) to graphically represent differences in diet composition between sampling periods and sexes. We based these three-dimensional ordination spaces on Bray–Curtis dissimilarity matrices (Clarke 1993) for the percentage composition of each plant family identified per rumen. We standardised within families to reduce the influence of abundant groups on the NMDS. For the ith variable
where χ is the percentage composition by the frequency of fragments of each plant family identified per individual. Prior to creating the dissimilarity matrix, we excluded plant families that occurred in only one sample, as they did not contribute to systematic compositional differences among samples.
We assessed differences in estimates of plant family compositions among sex–age classes and between sampling periods by using the multivariate analysis of similarities (ANOSIM) routine in Primer 6 (Clarke and Warwick 2001), and we determined the statistical significance by using a permutation procedure (n = 999). ANOSIM produces a statistic, R, that indicates the degree of discrimination among groups of samples. The statistic R equals 1 only if all replicates within groups are more similar to each other than to any replicates from different groups, indicating that the communities differ completely among defined groups. The statistic R is approximately zero if the null hypothesis is true, so that similarities among and within groups will be the same on average (Clarke and Warwick 2001). To compute the percentage contribution each plant family made to the difference observed among family composition estimates for each sex–age class and each sampling period, we used the similarity percentages (SIMPER) routine (Clarke 1993; Clarke and Warwick 2001). Similarity percentages also identified families that typified the diet of fallow deer according to each sex–age class and each sampling period. A family typifies a group if the family is found at a consistent abundance throughout, so that the standard deviation of its contribution to the average similarity within a group s.d.(Si) is low and the ratio of the average similarity within a group to s.d.(Si) is high (this does not indicate whether a family is a good discriminator of one group from another; it may be very typical of a number of groups; Clarke and Warwick 2001).
Feeding type, or the extent to which browse and grasses are used by wild herbivores, is of particular interest in determining impacts in production systems (e.g. species that predominately graze conflict more with the production of agricultural crops and livestock pasture; Spitzer et al. 2020). We therefore used microhistological analysis to classify the feeding type (sensuHofmann and Stewart 1972) of fallow deer as (1) bulk and roughage eaters (i.e. grass eaters), (2) selectors of juicy, concentrated herbage, or (3) intermediate feeders (which can adapt in different seasons or in different areas towards either types 1 or 2). In addition, we used microhistological analysis to classify the feeding type (sensuHansen et al. 1985) of fallow deer as (1) grazers (>50% monocots) or (2) browsers (>50% dicots).
Stock unit equivalence measures can be used to standardise animal units per unit area (Pahl 2019a). This approach is limited by variation in energy requirements and dry-matter consumption with age, physiological condition, season, and location (which have been quantified for domestic livestock in some locations but not for wild herbivores; Mulley and Flesch 2001; Latham et al. 2020), and technical difficulties in accurately estimating energy use and stock units (Munn et al. 2016). Nonetheless, in the absence of species-specific studies measuring per-capita forage off-take, we used this approach to address the knowledge gap of quantifying the extent to which fallow deer reduced the carrying capacity of the study area for domestic livestock. Both cattle (Chippendale 1962; Squires 1980) and sheep (Wilson et al. 1975; Harrington 1986; Munn et al. 2014) increase the amount of browse in their diet during drought, but these livestock were not present in our study area during our study (i.e. had been destocked) and therefore we could not estimate their diets.
We therefore quantified the extent to which fallow deer reduced the carrying capacity of the study area for domestic livestock in two ways. First, we assumed complete diet overlap between fallow deer and domestic livestock. Second, we reduced estimates of stock unit equivalence for fallow deer by the proportion of browse present in the diet, as was suggested by Latham et al. (2020). We then approximated the grazing pressure of the Liverpool Plains fallow deer population assuming likely sex and age class abundances and estimates of stock unit equivalence, before and after correcting for the amount of browse in the diet. Finally, we estimated the potential effect of forage depletion by fallow deer at varying population densities on livestock carrying capacity, assuming a linear relationship between deer density and pasture depletion (Fleming et al. 2002; Latham et al. 2020).
We used the following baseline DSEs for our four fallow deer age and sex classes: 1.1 for juveniles, 1.3 for yearling males, and 2.0 for both adult females and adult males (Mulley and Flesch 2000; Mulley and Flesch 2001; Mulley 2007). Adult male fallow deer (~85 kg) are almost twice the mass of adult females, and the equivalent DSEs arise because of the high energtic demands of adult females when lactating (Mulley 2007). These baseline DSEs were all estimated on the basis of a 45-kg merino wether (R. Mulley, pers. comm.). We therefore adjusted those baseline DSEs for a 50-kg wether, using the allometric constant W0.75, where W is body mass (Kleiber 1932; Shipley et al. 1994; Weckerly 2013), to more accurately reflect current average Merino wether mass and stocking rate recommendations in New South Wales (Graham 2017; NSW Department of Primary Industries 2015). The adjusted DSEs are 1.01 for juveniles, 1.20 for yearling males and 1.85 for adult females and adult males (Table 1).
| Fallow deer sex–age class | Merino wether mass | Corrected for % browse (for 50-kg merino wether) | |
|---|---|---|---|
| 45 kg | 50 kg | ||
| Males and females <1 year old | 1.1 | 1.01 | 0.77 |
| Females >1 year old | 2.0 | 1.85 | 1.40 |
| Males 1 year old | 1.3 | 1.20 | 0.91 |
| Males ≥2 years old | 2.0 | 1.85 | 1.40 |
The proportion of dry-matter intake from pasture compared with other food sources (e.g. browse) differs between domestic and wild mammalian herbivores (Gentle et al. 2015). The baseline DSE estimate for fallow deer assumed 100% dietary overlap between sheep and fallow deer (Mulley and Flesch 2001), but wild fallow deer can consume large amounts of browse (e.g. Jackson 1977; Nugent 1990). Following the approach suggested by Latham et al. (2020), we multiplied the adjusted fallow deer DSE by the proportion of pasture plants (i.e. grass, forb and non-grass graminoid species) in their diet. Forbs are dicots and therefore often grouped with browse, but for the purposes of estimating diet overlap with livestock, we included forbs with monocots in our definition of pasture plants, because forbs are an important component of livestock pasture (NSW Department of Primary Industries 2023). For cattle, a DSE of 7.0 for a 400-kg dry cow or steer at maintenance was used (McLaren 1997).
We estimated the grazing pressure of the Liverpool Plains fallow deer population prior to the shooting operation by multiplying the estimated deer density (assuming an age and sex distribution within that density) by the fallow deer DSEs adjusted to a 50-kg merino wether (Table 1). Our sex and age class distribution was from the 125 deer that we sampled. There is uncertainty as to the extent to which cattle and sheep in the Liverpool Plains can use non-pasture plants to obtain metabolisable energy during severe drought (see Discussion), and hence we estimated the grazing pressure without and with a discount for the proportion of browse in the diet.
To account for the uncertainty in deer population density, we drew 120 000 samples from a gamma distribution corresponding to the estimated population density and standard deviation (α = 7.4, β = 0.2). We used these samples to estimate the distribution of potential forage depletion by fallow deer on livestock carrying capacity, on the basis of recommended stocking rates in our study area for Natural pasture (average and range of DSE per km2 based on a 50-kg merino wether at maintenance is 0.021 and 0.012–0.038 respectively; NSW Department of Primary Industries 2015) and the expected sex and age distribution of the population, using the function
where D̂ is the number of deer in that sex and age class per square kilometre, the fallow deer DSE multipliers make them equivalent to a 50 kg merino wether (Table 1) and the subscripts are the sex and age classes previously defined.
We also estimated the benefits of the fallow deer population reduction achieved by the combined June and August 2018 control operations on the stocking rate. To do this, we estimated the population reduction only for fallow deer (rather than combined with red deer) by using the methods described by Bengsen et al. (2022a). The post-control fallow deer density was estimated by subtracting the number of fallow deer known to be killed during the control operation from the gamma distribution representing uncertainty in the pre-control density. We assumed that the post-control sex and age class composition did not change, a realistic assumption given that there was not deliberate targeting of a particular sex and age class in the helicopter-based shooting (Bengsen et al. 2022a). We calculated a potential or available stocking rate before and after population reduction as the difference between the recommended stocking rate and the depleted stocking rate (i.e. with fallow deer), and then estimated the improvement in potential stocking as a result of fallow deer population reduction.
We estimated the density–impact relationships for fallow deer in Natural pasture, assuming a linear relationship between deer density (0–40 deer per km2) and potential stocking rate (Latham et al. 2020). We estimated these relationships by using the recommended average, lower and upper stocking rates for sheep and cattle on Natural pasture (NSW Department of Primary Industries 2015), without and with discounting for the proportion of browse in fallow deer diet.
Results
Fallow deer diet
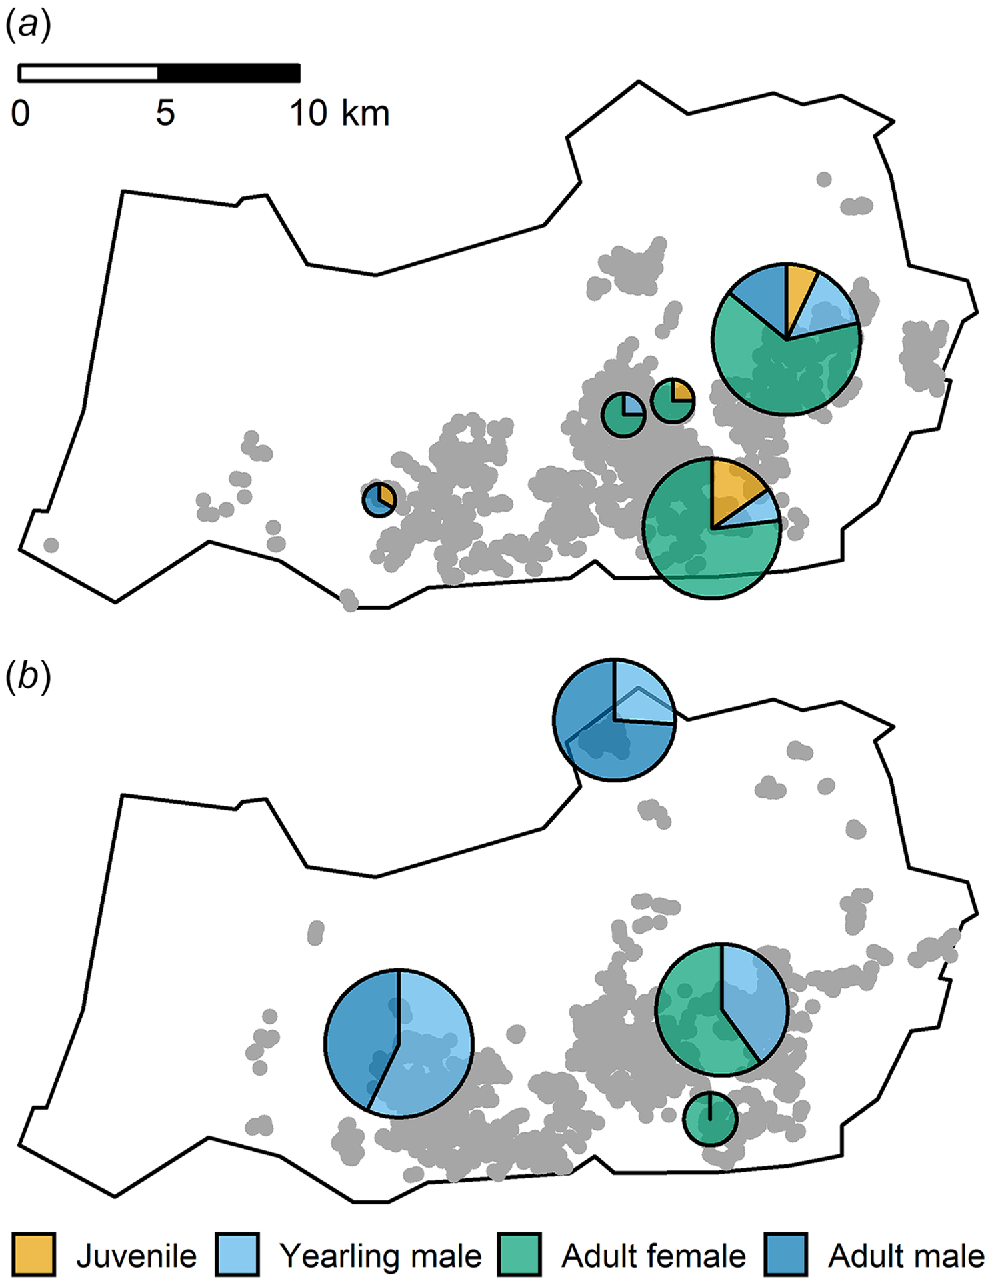
The majority of fallow deer rumens were collected in August and most were male (Table 2). Samples were sexually segregated in both periods (Fig. 3).
| Sampling period | Sex | Age | ||||
|---|---|---|---|---|---|---|
| Female | Male | Not recorded | Adult | Yearling (male) | Juvenile | |
| June | 26 | 12 | 0 | 29 | 4 | 5 |
| August | 25 | 61 | 1 | 54 | 32 | 0 |
| Total | 51 | 73 | 1 | 83 | 36 | 5 |
Sample locations for rumens collected from four classes of fallow deer (juvenile, yearling male, adult female and adult male) overlaid on helicopter-based-shooting fallow deer kills (grey circles) during the (a) June, and (b) August control operations in the Northern Slopes region, New South Wales, Australia. Pie charts show the sex composition and relative size (within sampling periods) of each deer group sampled.
Microhistological analysis
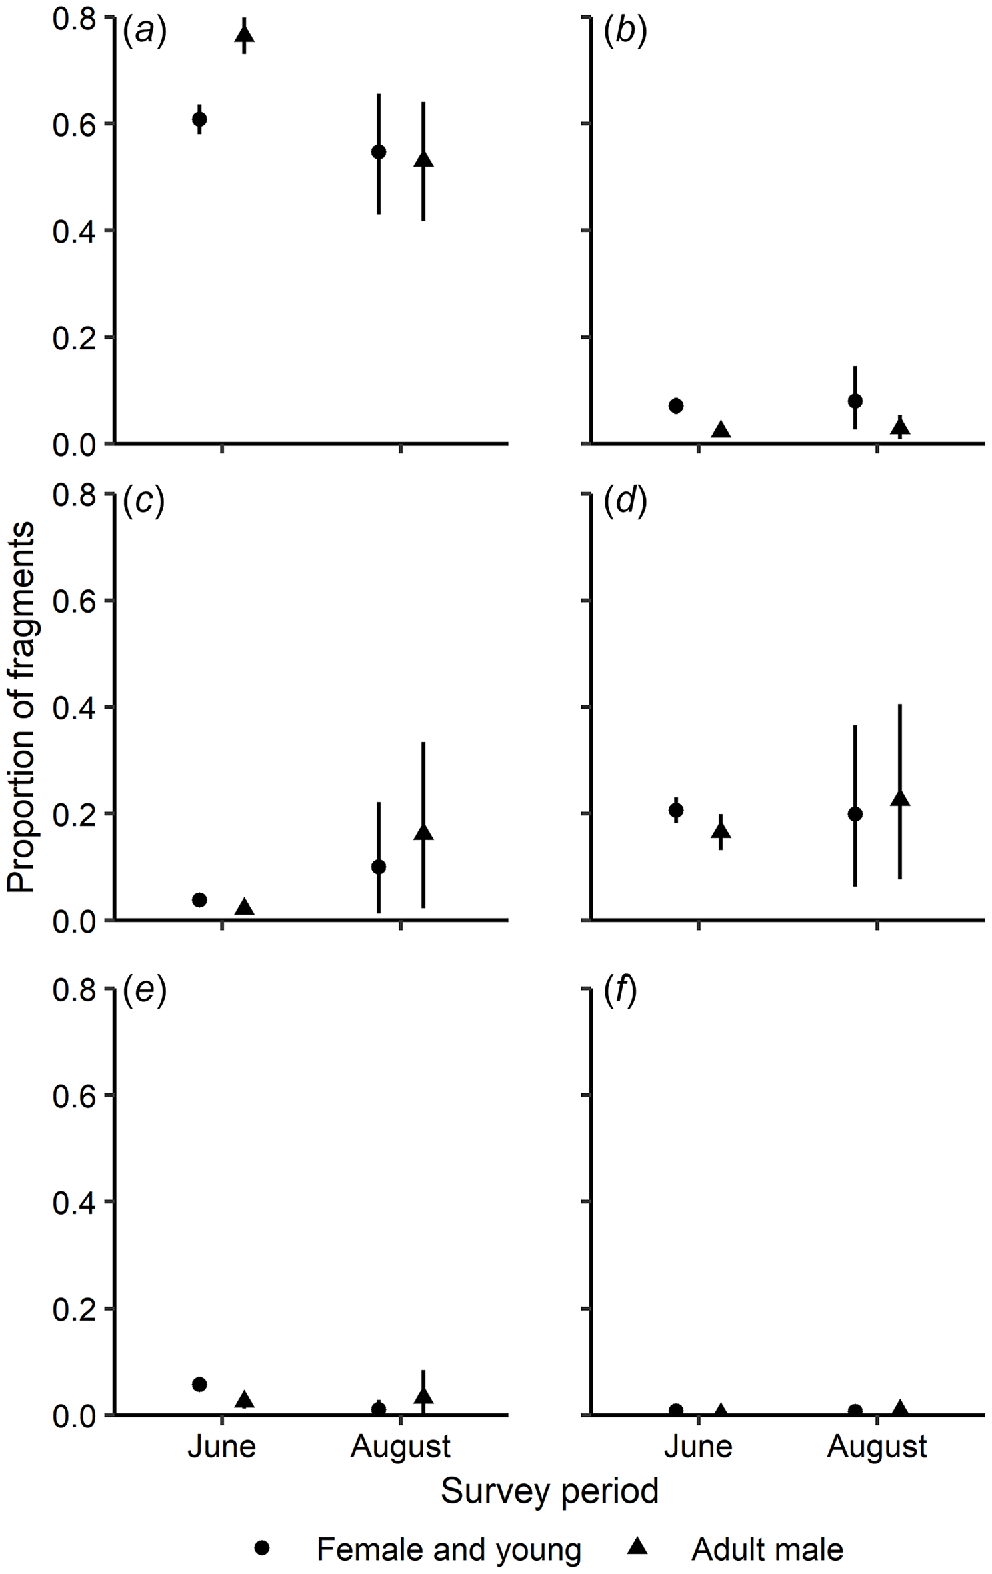
Microhistological analysis of rumen contents showed that, overall, the diet of fallow deer was dominated by monocots [ = 62.9%, 95% confidence interval (CI): 60.0–65.8, n = 125], primarily grasses (Fig. 4a). Dicots comprised a smaller component of the diet and included tree and forb material in similar quantities, and smaller quantities of shrub material (Fig. 4e). However, some individual deer consumed large amounts (up to 80%) of dicot material, primarily forbs and tree material. There were greater differences in the diets of adult female deer pooled with young of both sexes and adult male fallow deer in June than in August (Fig. 4a, b and e). Females ate proportionally less grasses, but more non-grass graminoid species, shrubs and climbers in June than did males. Using the classifications of Hansen et al. (1985) and Hofmann (1989), fallow deer were grazers and intermediate mixed feeders respectively.
Estimated mean (with 95% credible intervals) proportion of plant fragments of six functional groups identified microhistologically from rumen samples of fallow deer adult males (n = 33) or adult females and young of both sexes (n = 92). Samples were collected during June (n = 38) and August (n = 87) 2018 from five pastoral properties in the Northern Slopes region, New South Wales, Australia: (a) grasses, (b) non-grass graminoid species, (c) forbs, (d) trees, (e) shrubs and (f) climbers. Means with 95% credible intervals that do not overlap are considered different.
There was large overlap in the family-level composition of fallow deer diet among sex–age classes and between sampling periods (Fig. 5). ANOSIM showed minor separation in diet composition among sex–age classes (R = 0.13, P < 0.01), and similarity percentages indicated that these small differences in family composition estimates among sex–age classes were caused by many families contributing small amounts, rather than a few families contributing large amounts (i.e. 18 families contributed almost 80% of the difference). Myrtaceae (9%), Poaceae and Asteraceae (7% each) contributed most to differences in diet composition among sex–age classes, with all other families contributing ≤5% to differences. Poaceae (42%), Myrtaceae (13%), Cyperaceae (8%), Lomandraceae (7%) and Zygophyllaceae (6%) typified the diet of young and adult female fallow deer. Similarly, the diet of adult males was typified by Poaceae (36%) and Myrtaceae (30%), but diet composition of this sex–age class was also typified by Lomandraceae and Asteraceae (both 6%). All other families contributed ≤5% to similarities in diet composition within sex–age classes.
Non-metric multidimensional scaling three-dimensional configuration (each axis displayed in two dimensions) of the diets of 125 fallow deer on pastoral properties in the Northern Slopes region, New South Wales, in June and August 2018 by (a) sex–age class [adult female and young of both sexes (n = 92, dark grey circle); adult male (n = 33, light grey circle)] and (b) sampling period [June (n = 38, dark grey circle); August (n = 87, light grey circle)], based on a Bray–Curtis matrix of dissimilarities among the percentages of each plant family identified in rumen samples by microhistological diet analysis (stress = 0.21). We applied standardisation (1) within plant families, and we excluded families occurring in only one rumen.
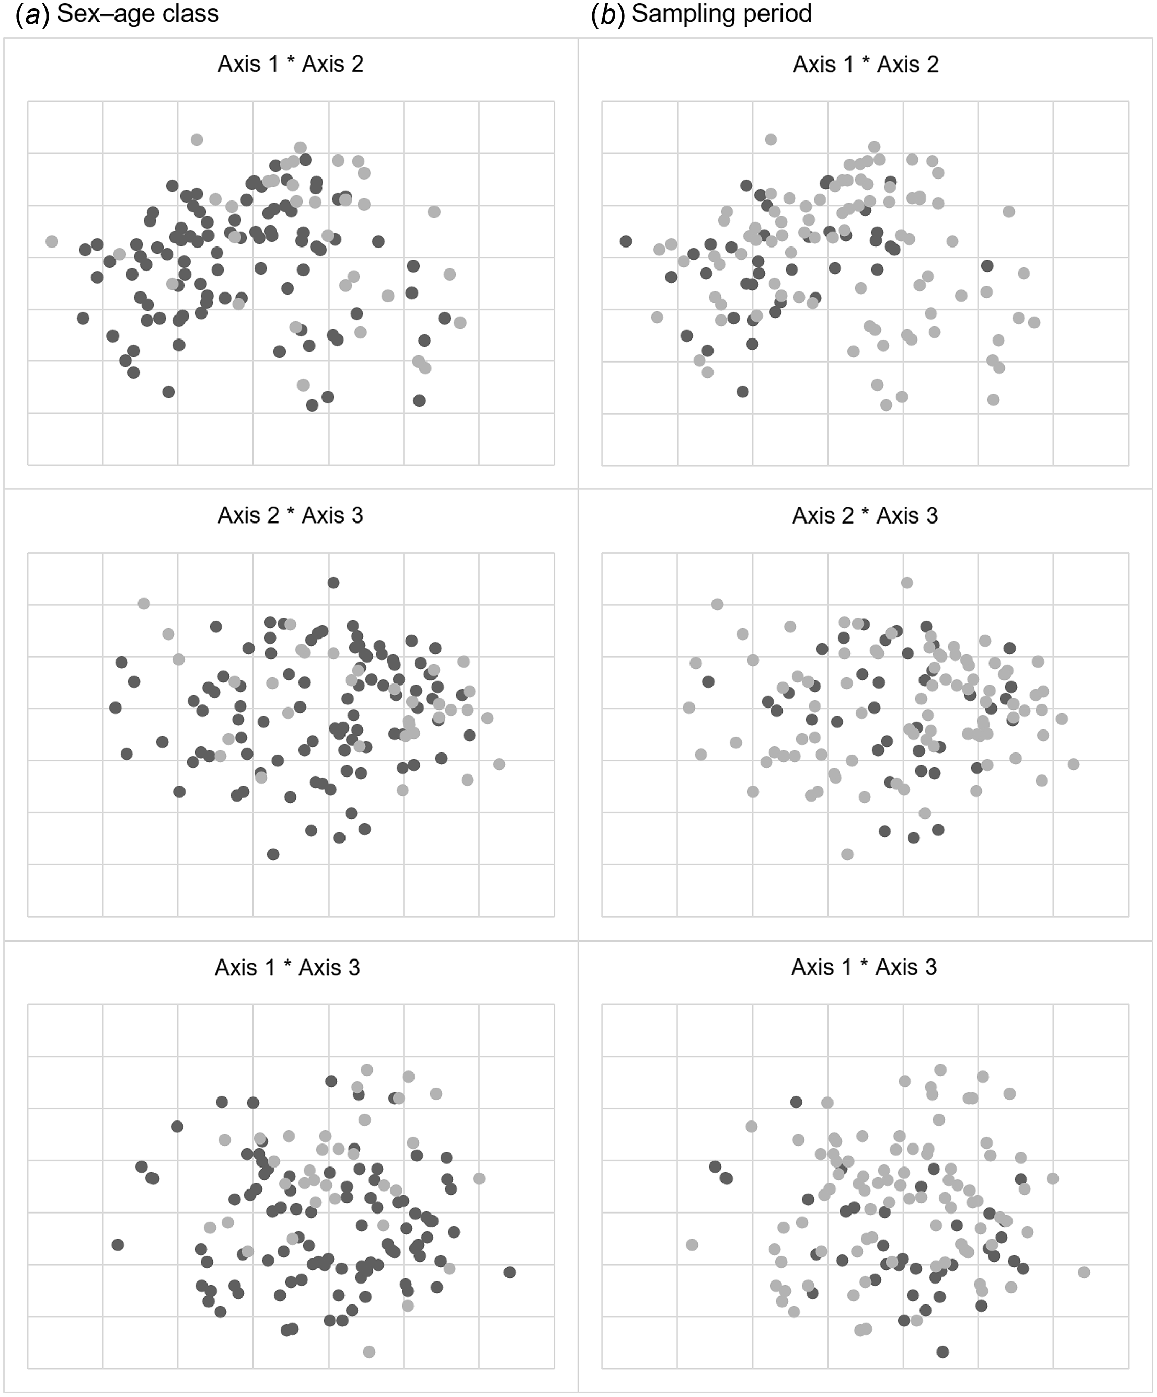
The composition of the diet in June was a subset of the August diet (Fig. 5). The minor variation in estimates of family composition between sampling periods suggested by NMDS was supported by ANOSIM, with no significant difference between sampling periods (R = 0.03, P > 0.2). Similarity percentages indicated that small differences in family composition estimates between sampling periods were caused by many families contributing small amounts rather than few families contributing large amounts (i.e. 18 families contributed almost 80% of the difference). Myrtaceae (7%), Lamiaceae, Poaceae, Lomandraceae and Zygophyllaceae (6% each) contributed most to differences in diet composition between sampling periods, with all other families contributing ≤5% to differences. In June, Poaceae, Lomandraceae, Myrtaceae and Cyperaceae dominated the diet of fallow deer, contributing 44%, 11%, 8% and 8% to similarity respectively, with all other families contributing ≤5% to similarity. In August, Poaceae and Myrtaceae again typified the diet, contributing 39% and 21% to similarity in diet composition respectively, with all other families contributing ≤5%.
On the basis of the percentage of fragments identified microhistologically, the diet of fallow deer consisted mostly of native species ( = 75.9%, 95% CI 73.2–78.7, n = 125) rather than introduced species ( = 24.1%, 95% CI 21.3–26.8, n = 125). Most species comprised a very small proportion (<1%) of the diet. The only species that contributed >5% of the overall diet were native and introduced grasses (family Poaceae) and one Eucalyptus species (family Myrtaceae), a native tree.
Macroscopic analysis
Macroscopic sorting was ineffective for quantifying the diet of the subsample of 20 fallow deer, with an average of 97.0% (95% CI 95.5–98.5) dry weight of rumen samples consisting of highly fragmented material that could not be identified macroscopically. However, macroscopic analysis did enable fruit, seed, inflorescence, stem, bark and root material to be identified in 85% of the 20 rumens. Macroscopic sorting also supported evidence from microhistological analysis that Eucalyptus was present in the diet.
Competition between fallow deer and livestock
Using the DSE estimate of Mulley and Flesch (2001), adjusted for a 50-kg wether, the population of 37 ± 15 fallow deer per km2 in April 2018 (1 month before helicopter-based shooting started) was equivalent to 60.3 merino wethers per km2 [95% credible interval (CrI): 24.9, 111.0]. After adjusting for the percentage of pasture plants in the diet, the population was equivalent to 45.7 (95% CrI: 18.9, 84.0) 50-kg merino wethers per km2.
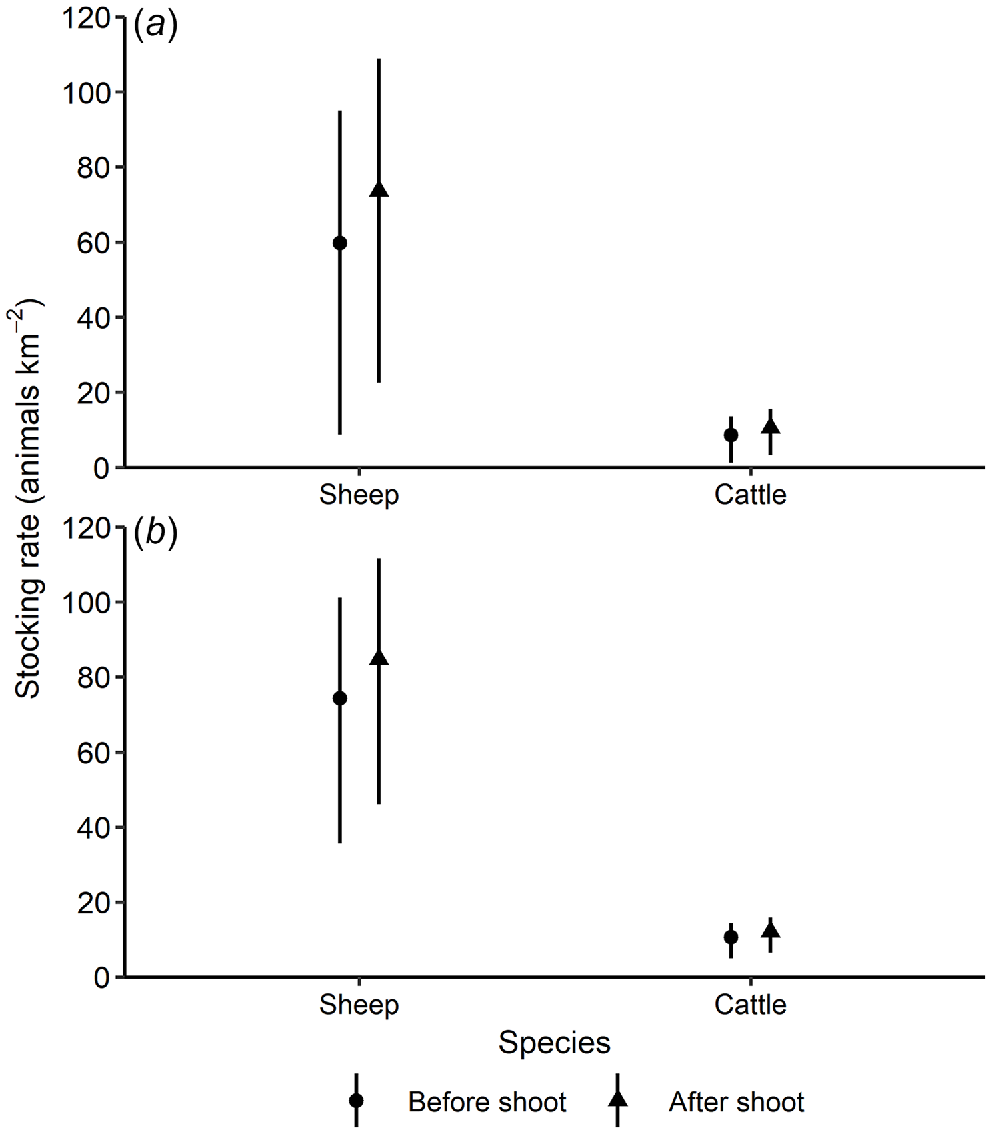
Natural pasture, the dominant pasture type in our study area, should support ~210 merino wethers or 30 cattle per km2 in average conditions (Table 2; NSW Department of Primary Industries 2015). However, since forage biomass was low during our study (Fig. 2), we used the recommended lower range of 120 merino wethers or 17 cattle per km2. Using the lower value, the pre-control fallow deer population reduced the stocking rate by 50.2% (95% CrI: 20.8, 92.7%) in Natural pasture, or 38.1% (95% CrI: 15.8, 70.4%) after adjusting for the percentage of pasture plants in the diet. The June and August 2018 helicopter-based shooting reduced the fallow deer population by 26% (95% CrI: 12.5, 55.3%). This reduction in fallow deer density increased the mean potential stocking rates by 22.0% in Natural pasture (95% CrI: 14.1, 92.3%), or 13.8% after adjusting for pasture consumption (95% CrI: 10.4, 29.4%; Fig. 6).
Expected mean (and 95% credible intervals) stocking rate (number of sheep and cattle per km2) before and after the helicopter-based fallow deer shooting in June and August 2018 in Natural pasture in the Northern Slopes region, New South Wales. Stocking rates are based on estimated deer densities and the DSEs for fallow deer (a) before, and (b) after correcting using % pasture plants (grass, forb and non-grass graminoid species) in the diet (Table 1).
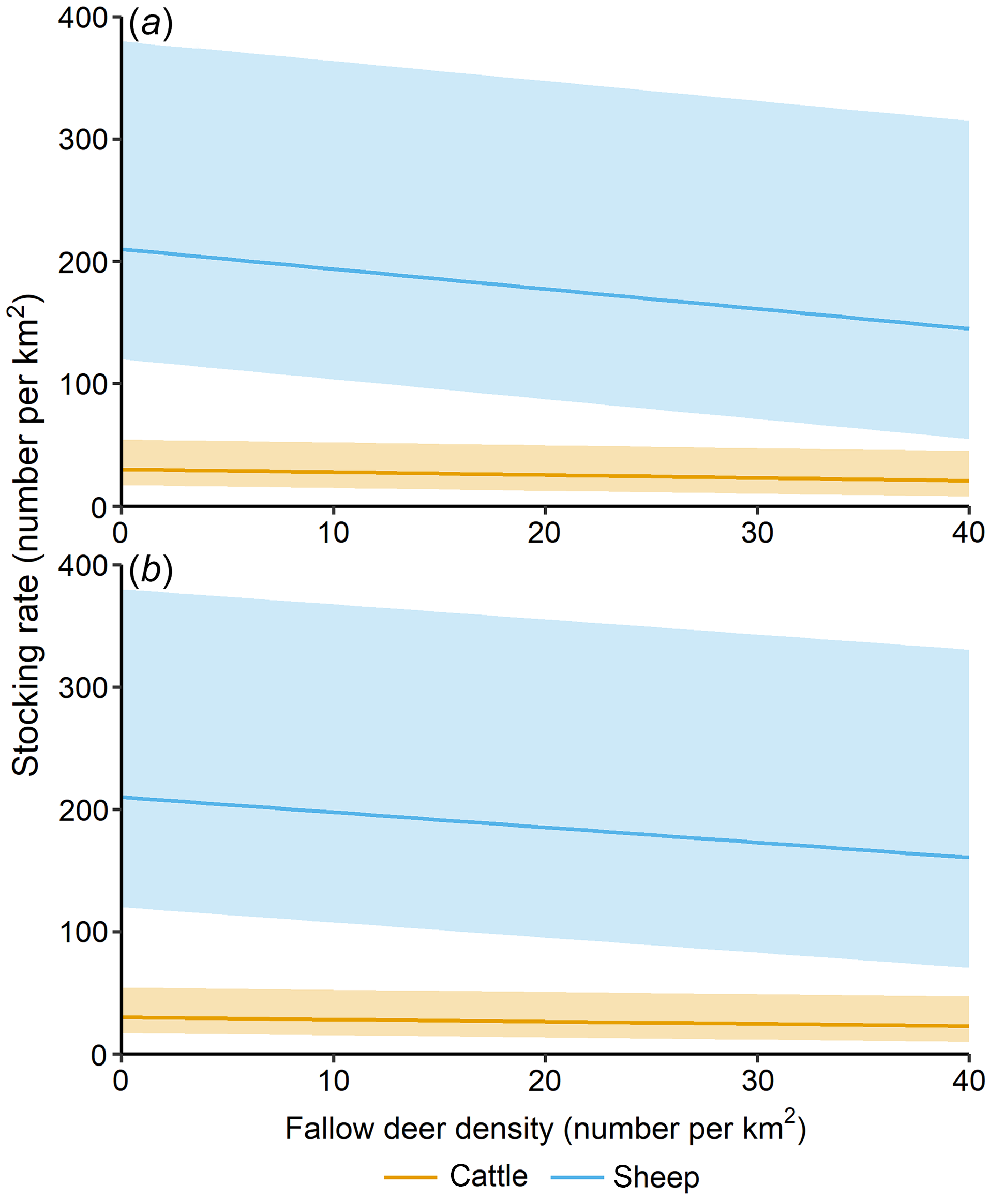
The expected relationship between deer density and potential stocking rate declined more sharply when deer DSEs were not discounted for the proportion of browse in the diet (Fig. 7). Given the expected sex and age class distribution of the population and the different estimated DSEs for each age class, a one unit increase in the number of fallow deer per square kilometre equated to a decrease in the potential stocking rate of 1.63 sheep or 0.23 cattle. When discounted for the proportion of browse, each increase of one fallow deer per square kilometre was equivalent to a decrease in the potential stocking rate of 1.23 sheep or 0.18 cattle.
Predicted effect of fallow deer density on cattle and sheep stocking rates in Natural pasture in the Northern Slopes region, New South Wales, Australia. The DSEs for fallow deer are shown (a) before, and (b) after correcting using % pasture plants (grass, forb and non-grass graminoid species) in the diet (Table 1). Lines represent the expected average stocking rate, for the given fallow deer density, and shaded polygons represent the expected range of stocking rates.
Discussion
The five properties in our study had been partially or completely destocked during the severe drought of 2018, yet fallow deer persisted at remarkably high densities. Fallow deer in the Northern Slopes region of New South Wales were grazers (sensuHansen et al. 1985), with the average proportion of grass in their diet (56%) being similar to average values recorded in their native range (Spitzer et al. 2020). However, as intermediate feeders that can adapt towards either bulk and roughage eaters or selectors of concentrated herbage (sensuHofmann and Stewart 1972), fallow deer can switch between grass- and browse-dominated diets (Kerridge and Bullock 1991; Spitzer et al. 2020). The remainder of the diet of fallow deer in our study area consisted almost entirely of dicots, with some individuals consuming substantial quantities (up to 80%). The large amounts of browse in the diet of fallow deer in our study is likely to reflect the reduced availability of more-preferred grasses and forbs (Spitzer et al. 2020) during the severe drought conditions, and presumably enabled them to persist at such a high density during severe drought when little forage biomass was available (Kerridge and Bullock 1991).
Given that fallow deer did not eat Eucalyptus leaves during captive feeding trials (Philipps 1985), there were surprisingly high proportions of Eucalyptus species in some fallow deer rumens. Browse such as Eucalyptus species have high concentrations of tannins (Rhoades and Gates 1976) that reduce the digestibility of proteins in leaves by deer (Robbins et al. 1987). It is unclear how long fallow deer could survive on a diet dominated by Eucalyptus. The large amounts of browse in the diet of fallow deer in our study could indicate consumption of leaf litter. For fallow deer in New Zealand native forest, woody species were the most important food and the main source was litterfall (Nugent 1990). Litterfall was less preferred than was broadleaf foliage, but its production was much greater than that of living broadleaf within the reach of deer (Nugent 1990). Other foods may also have helped fallow deer persist on the pastoral properties at a time of low forage availability. Macroscopic sorting was not effective for quantifying the diet of fallow deer because of high levels of fragmentation, but it did confirm the presence of fruit, seed, inflorescence, stem, bark and root materials in the diet. These foods have previously been recorded in the diet of fallow deer [e.g. lichens and fungi (Nugent 1990), woody fruits, flowers, roots (Long 2003) and bark (Thirgood 1995)] and are likely to have helped fallow deer survive the severe drought of 2017–2019.
Fallow deer are gregarious and exhibit ecological sexual segregation; females and juveniles form groups that are spatially segregated from adult males, except during the autumn breeding season (Apollonio et al. 1998). In England, female fallow deer in single-sex groups ate significantly more grass than did males, and even in mixed-sex groups (when differences were less pronounced), males consumed higher proportions of coarser grasses and browse (Putman et al. 1993). In our study area, adult female and young fallow deer of both sexes contained a smaller proportion of grasses than did adult males in June, but not in August. The greater similarity in diets in August could reflect broadening of the diet by both groups because of declining food availability as the drought worsened and pasture availability further declined.
The baseline DSEs we used for fallow deer were estimated in New South Wales on the basis of their energetic requirements in ‘ideal’ conditions (i.e. individually penned and fed a diet of know energetic content; Mulley and Flesch 2001, and references therein), whereas wild fallow deer in Australia live in unimproved grasslands and grassy woodlands (Bengsen et al. 2022a, 2022b; Cunningham et al. 2022). The energetic requirements of wild fallow deer would be greater than those of penned deer, because the former need to move longer distances to feed. Energy requirements (and hence DSEs) for deer within an age and sex class will also vary with body mass, pregnancy and lacatation status, season, and forage quality and quantity (Mulley 2007; Mulley and Flesch 2001). These issues limit the usefulness of DSEs as a measure of competition between wild mammalian herbivores and domestic livestock (Latham et al. 2020; Pahl 2019a; Pahl 2019b). We therefore emphasise that DSEs, although being a widely used livestock equivalence system in Australia, are only approximate estimates for both domestic livestock and wild mammalian herbivores such as fallow deer.
We estimated the extent of potential competition between fallow deer and domestic livestock without and with a discount for the proportion of browse in fallow deer diet because there is uncertainty about the extent to which cattle and sheep could have increased their consumption of browse in our study area, if they had been present. Diet studies conducted elsewhere in Australia have indicated that both sheep (Wilson et al. 1975; Munn et al. 2014) and cattle (Chippendale 1962; Squires 1980) can increase their consumption of browse during dry conditions. However, both species had been destocked, indicating that landholders had decided that there was insufficient food in our study area to sustain domestic livestock. Improved knowledge of the diets of wild fallow deer, and sympatric domestic livestock when present, are needed in a range of Australian agricultural environments and seasonal conditions.
Discounting for the proportion of browse in the diet has been used by others to estimate competition between wild deer and livestock in Australia (Watter et al. 2020) and New Zealand (Latham et al. 2020). In our study, discounting based on the percentage of pasture plants in the diet reduced fallow deer DSEs (adjusted for a 50-kg merino wether) by ~25%. A potential methodological limitation of this approach is error in diet analysis, resulting from differential digestibility of forage types (Barker 1986). This source of error, although commonly negligible (e.g. Johnson et al. 1983), could result in over- or under-estimates of some forage types (Leslie et al. 1983).
A strength of our study was having robust estimates of fallow deer density in our study area (sensuForsyth et al. 2022) immediately prior to rumen contents being collected (Bengsen et al. 2022a). Fallow deer in the study area were at a high density for this species in Australia (Bengsen et al. 2022a). The density of 37 ± 15 fallow deer per km2 in our study area was equivalent to 45.7 to 60.3 DSEs per km2, depending on whether DSEs were discounted for browse content. This provides a more quantitative measure of competitive pressure than previous Australian work has done.
In northern Queensland, Watter et al. (2020) found that the grass consumed by 100 chital deer could support an additional 25 cattle during the wet season, when both ungulates principally consumed grass, and an additional 14 cattle during the dry season, when grass was still dominant, but senesced more than browse, and chital diet comprised only 50% grass. The reliance of chital deer and cattle on grass differed, with cattle preferring grass, consuming both actively growing and senescent material at a total constant proportion of ~90%, whereas chital (intermediate feeders predicted to optimise their diet through plant selection) varied the proportion of grass intake between seasons, selecting for the most actively growing plants (Watter et al. 2020).
The extent of competition among grazing animals will also depend on spatial overlap (Kuiters et al. 2005; Pahl 2019b), and a limitation of our approach is the unknown spatial and temporal variability in the amount of food wild mammalian herbivores obtain from agricultural land. In New Zealand, Latham et al. (2020) showed that increasing proprtions of pasture in the diet would cause greater reductions in stocking units. For fallow deer, this will depend on proximity to the woodland–agricultural edge (Bleier et al. 2017). The extent of competition among grazing animals will also depend on whether food is limiting (Watter et al. 2020). In northern Queensland, for example, chital deer do not pose a limitation to cattle production during the wet season when forage is abundant, but their presence during the wet season reduces the available grass in the following dry season, and during the dry season when food availability is restricted, competition between grazers is expected to increase (Watter et al. 2020). Similar conclusions have been drawn regarding the effects of kangaroos on stock production in rangelands, with competition occurring primarily when pasture is sparse during dry periods and in degraded environments (Dawson and Munn 2007). In Tasmania, competition between fallow deer and eastern grey kangaroos (Macropus giganteus) is likely to occur during winter, when diet overlap is significant and food is scarce (Duncan 1987). However, culling fallow deer when food is not limiting could be considered as ‘insurance’ to minimise potential future impacts when food is limiting.
Quantifying the impacts of grazing by deer on forage availability is difficult (Putman and Moore 1998; Putman et al. 2011). Using the indirect method of Latham et al. (2020), we estimated that fallow deer reduced stocking rates by 16.3 DSEs for every increase in density of 10 deer per km2, or 12.3 DSEs when discounted for the amount of browse in the diet. This density–impact relationship can be used to guide management of fallow deer in the Northern Slopes region of New South Wales when forage availability is low. We assumed a linear relationship between fallow deer density and stocking units, yet density–impact functions can be non-linear (Norbury et al. 2015; Latham et al. 2020). Exclosures or enclosures could be used to estimate deer density–impact relationships in Australian agricultural settings, but these are difficult to implement in the field (Langbein and Rutter 2003), particularly when other mammalian herbivores (e.g. macropods) are present.
Helicopter-based shooting can quickly and substantially reduce the abundance of deer in agricultural landscapes, with the magnitude of the reduction depending on the control effort per deer per km2 (Bengsen et al. 2022a). In our study area, helicopter-based shooting in June and August 2018 reduced the fallow deer population by 26%. This reduction in deer density increased the potential stocking rate by 22.0% in Natural pasture, or 13.8% after discounting for browse. Landholders had already de-stocked most or all of their domestic livestock when the helicopter-based shooting was undertaken, but reducing the fallow deer population was considered important by the landholders because lower deer densities would enable faster recovery of pasture when the drought ended. Indeed, the helicopter-based shooting was received extremely positively by the landholders at a time of severe stress (B. Gray, North West Local Land Services, pers. comm.). This observation suggests that deer control in agricultural areas can have important social benefits. To further reduce deer density, an additional 94 h of helicopter-based shooting removed 3628 fallow deer, 112 red deer and 15 chital deer from the study area in March 2019. The two successive years of shooting substantially reduced deer density in the study area relative to April 2018 (Bengsen et al. 2022a).
Conclusions
Our study indicated that wild fallow deer persisted at a high density during a severe drought by browsing trees and shrubs. The higher browse height of fallow deer (≥1.5 m; Nugent 1990) than of sheep and cattle (0.87 and 1.47 m respectively; Sanon et al. 2007), and their ability to jump sheep and cattle fences, would also enable fallow deer to eat a broader spectrum of plants than would otherwise be available to domestic livestock. Fallow deer at high densities (37 ± 15 per km2) reduced stocking rates by between 45% and 60% in unimproved pasture. Helicopter-based shooting reduced fallow deer densities by 26%, increasing potential domestic livestock stocking rates by at least 13%. Our density–impact relationships can be used to guide management of fallow deer in the Northern Slopes region of New South Wales when forage availability is low.
Data availability
The data that support this study will be shared upon reasonable request to the corresponding author.
Conflicts of interest
David Forsyth was guest Associate Editor for this special issue. Despite this relationship, he did not at any stage have editor-level access to this manuscript while in peer review, as is the standard practice when handling manuscripts submitted by an editor to this journal. Wildlife Research encourages its editors to publish in the journal, and they are kept totally separate from the decision-making process for their manuscripts. The authors have no further conflicts of interest to declare.
Acknowledgements
We thank the five landholders for letting us sample deer shot on their properties. Bec Gray (North West Local Land Services) coordinated the helicopter-based shooting and liaised between us, the shooting teams and the landholders. Troy Crittle, Quentin Hart (both NSW Department of Primary Industries), Bob McKinnon, Amy Sheridan (both North West Local Land Services) and Jose Luis Alfredo Huaman Torres (La Trobe University) helped collect rumen samples. John Hosking (volunteer, N.C.W. Beadle Herbarium, University of New England, Armidale) and James Shannon (La Trobe University) assisted with plant identification, and Warwick Badgery (NSW Department of Primary Industries) provided useful background information on livestock feeding preferences. Robert Mulley (University of Western Sydney) patiently answered our questions about the estimation of DSEs for fallow deer. We also thank two anonymous reviewers and the Associate Editor for comments that greatly improved this paper.
References
Anthony RG, Smith NS (1974) Comparison of rumen and fecal analysis to describe deer diets. Journal of Wildlife Management 38, 535-540.
| Crossref | Google Scholar |
Apollonio M, Focardi S, Toso S, Nacci L (1998) Habitat selection and group formation pattern of fallow deer Dama dama in a submediterranean environment. Ecography 21, 225-234.
| Crossref | Google Scholar |
Barker RD (1986) An investigation into the accuracy of herbivore diet analysis. Australian Wildlife Research 13, 559-568.
| Crossref | Google Scholar |
Bengsen AJ, Forsyth DM, Pople A, Brennan M, Amos M, Leeson M, Cox TE, Gray B, Orgill O, Hampton JO, Crittle T, Haebich K (2022a) Effectiveness and cost of helicopter-based shooting of deer. Wildlife Research
| Crossref | Google Scholar |
Bengsen AJ, Forsyth DM, Ramsey DSL, Amos M, Pople AR, Brennan M, Comte S, Crittle T (2022b) Estimating deer density and abundance using spatial mark–resight models with camera trap data. Journal of Mammalogy 103, 711-722.
| Crossref | Google Scholar |
Bleier N, Kovács I, Schally G, Szemethy L, Csányi S (2017) Spatial and temporal characteristics of the damage caused by wild ungulates in maize (Zea mays L.) crops. International Journal of Pest Management 63, 92-100.
| Crossref | Google Scholar |
Burt ML, Borchers DL, Jenkins KJ, Marques TA (2014) Using mark–recapture distance sampling methods on line transect surveys. Methods in Ecology and Evolution 5, 1180-1191.
| Crossref | Google Scholar |
Chippendale G (1962) Botanical examination of kangaroo stomach contents and cattle rumen contents. Australian Journal of Science 25, 21-22.
| Google Scholar |
Clarke KR (1993) Non-parametric multivariate analyses of changes in community structure. Australian Journal of Ecology 18, 117-143.
| Crossref | Google Scholar |
Cunningham CX, Perry GLW, Bowman DMJS, Forsyth DM, Driessen MM, Appleby M, Brook BW, Hocking G, Buettel JC, French BJ, Hamer R, Bryant SL, Taylor M, Gardiner R, Proft K, Scoleri VP, Chiu-Werner A, Travers T, Thompson L, Guy T, Johnson CN (2022) Dynamics and predicted distribution of an irrupting ‘sleeper’ population: fallow deer in Tasmania. Biological Invasions 24, 1131-1147.
| Crossref | Google Scholar |
Denwood MJ (2016) runjags: an R package providing interface utilities, model templates, parallel computing methods and additional distributions for MCMC models in JAGS. Journal of Statistical Software 71, 1-25.
| Crossref | Google Scholar |
Fleming PJS, Croft JD, Nicol HI (2002) The impact of rabbits on a grazing system in eastern New South Wales. 2. sheep production. Australian Journal of Experimental Agriculture 42, 917-923.
| Crossref | Google Scholar |
Focardi S, Toso S, Pecchioli E (1996) The population modelling of fallow deer and wild boar in a Mediterranean ecosystem. Forest Ecology and Management 88, 7-14.
| Crossref | Google Scholar |
Forsyth DM, Davis NE (2011) Diets of non-native sambar deer in Australia estimated by macroscopic versus microhistological rumen analysis. Journal of Wildlife Management 75, 1488-1497.
| Crossref | Google Scholar |
Forsyth DM, Comte S, Davis NE, Bengsen AJ, Côté SD, Hewitt DG, Morellet N, Mysterud A (2022) Methodology matters when estimating deer abundance: a global systematic review and recommendations for improvements. Journal of Wildlife Management 86, e22207.
| Crossref | Google Scholar |
Gentle M, Speed J, Marshall J (2015) Consumption of crops by feral pigs (Sus scrofa) in a fragmented agricultural landscape. Australian Mammalogy 37, 194-200.
| Crossref | Google Scholar |
Graham P (2017) ‘PROGRAZETM: profitable, sustainable grazing.’ 9th edn. (NSW Department of Primary Industries: Orange, NSW, Australia). Available at https://www.dpi.nsw.gov.au/__data/assets/pdf_file/0009/1363509/Prograze-manual-full.pdf [Accessed 16 December 2022]
Hampton JO, Bengsen AJ, Pople A, Brennan M, Leeson M, Forsyth DM (2022) Animal welfare outcomes of helicopter-based shooting of deer in Australia. Wildlife Research 49, 264-273.
| Crossref | Google Scholar |
Hansen RM, Mugambi MM, Bauni SM (1985) Diets and trophic ranking of ungulates of the Northern Serengeti. Journal of Wildlife Management 49, 823-829.
| Crossref | Google Scholar |
Harrington GN (1986) Herbivore diet in a semi-arid Eucalyptus populnea woodland. 1. Merino sheep. Australian Journal of Experimental Agriculture 26, 413-421.
| Crossref | Google Scholar |
Hofmann RR (1989) Evolutionary steps of ecophysiological adaptation and diversification of ruminants: a comparative view of their digestive system. Oecologia 78, 443-457.
| Crossref | Google Scholar |
Hofmann RR, Stewart DRM (1972) Grazer or browser: a classification based on the stomach-structure and feeding habits of East African ruminants. Mammalia 36, 226-240.
| Crossref | Google Scholar |
Holechek JL (1982) Sample preparation techniques for microhistological analysis. Journal of Range Management 35, 267-268.
| Crossref | Google Scholar |
Jackson J (1977) The annual diet of the fallow deer (Dama dama) in the New Forest, Hampshire, as determined by rumen content analysis. Journal of Zoology 181, 465-473.
| Crossref | Google Scholar |
Johnson MK, Wofford H, Pearson HA (1983) Digestion and fragmentation: influence on herbivore diet analysis. Journal of Wildlife Management 47, 877-879.
| Crossref | Google Scholar |
Kerridge FJ, Bullock DJ (1991) Diet and dietary quality of red deer and fallow deer in late summer. Journal of Zoology 224, 333-337.
| Crossref | Google Scholar |
Kessler WB, Kasworm WF, Bodie WL (1981) Three methods compared for analysis of pronghorn diets. Journal of Wildlife Management 45, 612-619.
| Crossref | Google Scholar |
King AD, Pitman AJ, Henley BJ, Ukkola AM, Brown JR (2020) The role of climate variability in Australian drought. Nature Climate Change 10, 177-179.
| Crossref | Google Scholar |
Kleiber M (1932) Body size and metabolism. Hilgardia 6, 315-353.
| Crossref | Google Scholar |
Kuiters AT, Bruinderink GWTAG, Lammertsma DR (2005) Facilitative and competitive interactions between sympatric cattle, red deer and wild boar in Dutch woodland pastures. Acta Theriologica 50, 241-252.
| Crossref | Google Scholar |
Latham ADM, Latham MC, Norbury GL, Forsyth DM, Warburton B (2020) A review of the damage caused by invasive wild mammalian herbivores to primary production in New Zealand. New Zealand Journal of Zoology 47, 20-52.
| Crossref | Google Scholar |
Leslie DM, Vavra M, Starkey EE, Slater RC (1983) Correcting for differential digestibility in microhistological analyses involving common coastal forages of the Pacific northwest. Journal of Range Management 36, 730-732.
| Crossref | Google Scholar |
McLaren C (1997) Dry sheep equivalents for comparing different classes of livestock. Agriculture notes. Department of Primary Industries, Vic., Australia. Available at http://www.agronomy.com.au/download/DSEratings.pdf [Accessed 5 June 2021]
Moriarty A (2004) The liberation, distribution, abundance and management of wild deer in Australia. Wildlife Research 31, 291-299.
| Crossref | Google Scholar |
Mulley RC, Flesch JS (2000) Energy intake of farmed fallow deer of two genotypes during pregancy, lactation, and growth to slaughter weight. In ‘Proceedings of the 9th Congress of the Asian–Australasian Association of Animal Production Societies and 23rd Biennial Conference of the Australian Society of Animal Production’, 3–7 July 2000. Vol. 13C (Supplement), pp. 295–299. (University of NSW, Sydney, NSW, Australia)
Munn AJ, Skeers P, Kalkman L, McLeod SR, Dawson TJ (2014) Water use and feeding patterns of the marsupial western grey kangaroo (Macropus fuliginosus melanops) grazing at the edge of its range in arid Australia, as compared with the dominant local livestock, the Merino sheep (Ovis aries). Mammalian Biology 79, 1-8.
| Crossref | Google Scholar |
Munn AJ, Kalkman L, Skeers P, Roberts JA, Bailey J, Dawson TJ (2016) Field metabolic rate, movement distance, and grazing pressures by western grey kangaroos (Macropus fuliginosus melanops) and Merino sheep (Ovis aries) in semi-arid Australia. Mammalian Biology 81, 423-430.
| Crossref | Google Scholar |
Norbury GL (1988) Microscopic analysis of herbivore diets – a problem and a solution. Australian Wildlife Research 15, 51-57.
| Crossref | Google Scholar |
Norbury GL, Pech RP, Byrom AE, Innes J (2015) Density-impact functions for terrestrial vertebrate pests and indigenous biota: guidelines for conservation managers. Biological Conservation 191, 409-420.
| Crossref | Google Scholar |
NSW Department of Primary Industries (2015) Using DSEs and carrying capacities to compare sheep industries. Available at https://www.dpi.nsw.gov.au/agriculture/budgets/livestock/sheep-gross-margins-october-2015/background/dse [Accessed 20 January 2020]
NSW Department of Primary Industries (2023) Pasture species and varieties. Available at https://www.dpi.nsw.gov.au/agriculture/pastures-and-rangelands/species-varieties [Accessed 16 June 2023]
NSW Office of Environment and Heritage (2017) The NSW State Vegetation Type Map: methodology for a regional-scale map of NSW plant community types. pp. 1–18. NSW Office of Environment and Heritage, Sydney, NSW, Australia. Available at https://www.environment.nsw.gov.au/resources/vegetation/nsw-state-vegetation-type-map-methodology-170134.pdf [Accessed 22 January 2021
Nugent G (1990) Forage availability and the diet of fallow deer (Dama dama) in the Blue Mountains, Otago. New Zealand Journal of Ecology 13, 83-95.
| Google Scholar |
Pahl L (2019a) Macropods, feral goats, sheep and cattle: 1. Equivalency in how much they eat. The Rangeland Journal 41, 497-518.
| Crossref | Google Scholar |
Pahl L (2019b) Macropods, feral goats, sheep and cattle. 2. Equivalency in what and where they eat. The Rangeland Journal 41, 519-533.
| Crossref | Google Scholar |
Plummer M (2003) JAGS: a program for analysis of Bayesian graphical models using Gibbs sampling. In ‘Proceedings of the 3rd International Workshop on Distributed Statistical Computing (DSC 2003)’, 20–22 March 2003, Vienna, Austria. (Eds K Hornik, F Leisch, A Zeileis) pp. 1–10. (Technische Universität Wien: Vienna, Austria)
Putman RJ, Moore NP (1998) Impact of deer in lowland Britain on agriculture, forestry and conservation habitats. Mammal Review 28, 141-164.
| Crossref | Google Scholar |
Putman RJ, Culpin S, Thirgood SJ (1993) Dietary differences between male and female fallow deer in sympatry and in allopatry. Journal of Zoology 229, 267-275.
| Crossref | Google Scholar |
Putman R, Langbein J, Green P, Watson P (2011) Identifying threshold densities for wild deer in the UK above which negative impacts may occur. Mammal Review 41, 175-196.
| Crossref | Google Scholar |
Pyšek P, Richardson DM (2010) Invasive species, environmental change and management, and health. Annual Review of Environment and Resources 35, 25-55.
| Crossref | Google Scholar |
Robbins CT, Hanley TA, Hagerman AE, Hjeljord O, Baker DL, Schwartz CC, Mautz WW (1987) Role of tannins in defending plants against ruminants: reduction in protein availability. Ecology 68, 98-107.
| Crossref | Google Scholar |
Sanon HO, Kaboré-ZoungranaI C, Ledin I (2007) Behaviour of goats, sheep and cattle and their selection of browse species on natural pasture in a Sahelian area. Small Ruminant Research 67, 64-74.
| Crossref | Google Scholar |
Shipley LA, Gross JE, Spalinger DE, Hobbs NT, Wunder BA (1994) The scaling of intake rate in mammalian herbivores. American Naturalist 143, 1055-1082.
| Crossref | Google Scholar |
Smith RW, Statham M, Norton TW, Rawnsley RP, Statham HL, Gracie AJ, Donaghy DJ (2012) Effects of wildlife grazing on the production, ground cover and plant species composition of an established perennial pasture in the Midlands region, Tasmania. Wildlife Research 39, 123-136.
| Crossref | Google Scholar |
Spitzer R, Felton A, Landman M, Singh NJ, Widemo F, Cromsigt JPGM (2020) Fifty years of European ungulate dietary studies: a synthesis. Oikos 129, 1668-1680.
| Crossref | Google Scholar |
Squires VR (1980) Chemical and botanical composition of the diets of oesophageally fistulated sheep, cattle and goats in a semi-arid Eucalyptus populnea woodland community. Australian Rangeland Journal 2, 94-103.
| Crossref | Google Scholar |
Storr GM (1961) Microscopic analysis of faeces, a technique for ascertaining the diet of herbivorous mammals. Australian Journal of Biological Sciences 14, 157-165.
| Crossref | Google Scholar |
Thirgood SJ (1995) The effects of sex, season and habitat availability on patterns of habitat use by fallow deer (Dama dama). Journal of Zoology 235, 645-659.
| Crossref | Google Scholar |
Trdan S, Vidrih M (2008) Quantifying the damage of red deer (Cervus elaphus) grazing on grassland production in southeastern Slovenia. European Journal of Wildlife Research 54, 138-141.
| Crossref | Google Scholar |
Turner BW, Alcock D (2000) The dry sheep equivalent – redefining a ‘standard’. Asian-Australasian Journal of Animal Sciences 13, 215-251.
| Google Scholar |
Watter K, Baxter GS, Pople A, Murray PJ (2020) Dietary overlap between cattle and chital in the Queensland dry tropics. The Rangeland Journal 42, 221-225.
| Crossref | Google Scholar |
Weckerly FW (2013) Conspecific body weight, food intake, and rumination time affect food processing and forage behavior. Journal of Mammalogy 94, 120-126.
| Crossref | Google Scholar |
Wilson AD, Leigh JH, Hindley NL, Mulham WE (1975) Comparison of the diets of goats and sheep on a Casuarina cristata–Heterodendrum oleifolium woodland community in western New South Wales. Australian Journal of Experimental Agriculture and Animal Husbandry 15, 45-53.
| Crossref | Google Scholar |