Bayesian modelling reveals differences in long-term trends in the harvest of native and introduced species by recreational hunters in Australia
Paul D. Moloney A , Andrew M. Gormley B , Simon D. Toop C , Jason S. Flesch C , David M. Forsyth D , David S. L. Ramsey A and Jordan O. Hampton
  C E F *
A Department of Environment, Land, Water and Planning, Arthur Rylah Institute for Environmental Research, PO Box 137, Heidelberg, Vic. 3084, Australia.
B Manaaki Whenua – Landcare Research, PO Box 69040, Lincoln 7640, New Zealand.
C Game Management Authority, 535 Bourke Street, Melbourne, Vic. 3000, Australia.
D Vertebrate Pest Research Unit, NSW Department of Primary Industries, 1447 Forest Road, Orange, NSW 2800, Australia.
E Harry Butler Institute, Murdoch University, 90 South Street, WA 6150, Australia.
F Present address: Faculty of Veterinary and Agricultural Sciences, University of Melbourne, Parkville, Vic. 3052, Australia.
Wildlife Research 49(8) 673-685 https://doi.org/10.1071/WR21138
Submitted: 22 September 2021 Accepted: 27 February 2022 Published: 2 May 2022
© 2022 The Author(s) (or their employer(s)). Published by CSIRO Publishing. This is an open access article distributed under the Creative Commons Attribution-NonCommercial-NoDerivatives 4.0 International License (CC BY-NC-ND)
Abstract
Context: Little is known about wildlife harvesting by licensed recreational hunters in Australia, where both native and introduced species are hunted. It is important to understand harvest trends to assess sustainability for native species and implications for population control of introduced species.
Aim: The aim of this study was to analyse trends in hunter participation, activity and efficiency, and wildlife harvest, including effects of climate, in Victoria, Australia, for three game species groups: introduced deer, native waterfowl (ducks) and one native grassland species, stubble quail (Coturnix pectoralis).
Methods: Telephone surveys of a random sample of licenced Victorian hunters were performed annually from 2009 to 2019. Hunters were asked to quantify their hunting effort and the number of animals harvested. The respondents’ answers were analysed to estimate measures of hunter success, activity and efficiency. Bayesian modelling was applied to these data, accounting for changes over time, differences between survey periods for all licence types, and random effects for over-dispersion. The effect of climate on game bird hunter activity and harvest was estimated, as measured by the El Niño-Southern Oscillation (ENSO).
Results: Over 11 years, annual deer harvest (all species) increased exponentially, at a mean annual rate of 17% (95% credible interval: 14–21%), and the number of deer hunters increased at 8% (5–11%). In contrast, for ducks and stubble quail, hunter numbers remained relatively unchanged, with no evidence of consistent change to total harvests over time, unrelated to changes in environmental conditions or regulations. The annual duck harvest was influenced by ENSO and hunting regulations. The annual stubble quail harvest exhibited ‘boom-and-bust’ dynamics, with an exceptionally large harvest immediately after a La Niña season.
Conclusions: Long-term monitoring of harvest trends in south-eastern Australia revealed stark differences between introduced deer and native birds: harvest of deer increased rapidly whereas equivalent rates for game birds were either stable or declining. Seasonal effects had a strong influence on game bird harvest. Environmental and regulatory conditions were influential for harvest outcomes for ducks and stubble quail.
Implications: This study filled a key knowledge gap around managing harvesting of game species, but increased scrutiny is warranted in this field.
Keywords: conservation status, game species, harvest trends, human dimensions, invasive species, population dynamics, recreational hunting, wildlife management.
Introduction
Management of the effects of recreational hunting is an important focus of wildlife management worldwide (Imperio et al. 2010). Recreational hunting has a long history in Australia (Kinghorn 1926), but is under-represented in peer-reviewed wildlife management publications, with relatively little scientific literature published (Finch et al. 2014). This dearth of information is particularly clear when Australia is compared with other continents such as North America (Rupp et al. 2000; Otis 2006). Native and introduced species can be legally hunted in Australia (Sharp and Wollscheid 2009); thus, it is important to understand trends in harvest and hunter participation to ensure that hunting is sustainable (Ginsberg and Milner‐Gulland 1994). This is true with respect to protecting the conservation status of native species as well as managing any negative impacts from introduced species. The critical value of long-term datasets in Australia is recognised for conservation of native species (Lunney et al. 2018). Such studies are relatively common for game species in other parts of the world (e.g. Europe; Rivrud et al. 2013), but are lacking in Australia.
In Victoria, south-eastern Australia, legal recreational hunting is restricted to: one native ground-dwelling grassland bird species – the stubble quail (Coturnix pectoralis; Kinghorn 1926); eight species of native ducks (Loyn 1991; see details below); and six species of introduced deer (Davis et al. 2016). In addition, several introduced ground-dwelling gamebirds can be hunted in game reserves, where they are reared and released for hunting. These are all recognised as ‘game’ species and subject to harvest monitoring by the Victorian government. Other introduced mammal species, feral pigs (Sus scrofa), feral goats (Capra hircus), European rabbits (Oryctolagus cuniculus), and red foxes (Vulpes vulpes), are also hunted but considered to be ‘pests’; there are few regulatory controls over when, how and how many of these species may be hunted (Game Management Authority 2021).
Licensed deer hunters can hunt five deer species year-round in Victoria: sambar (Cervus unicolor); fallow (Dama dama); red (Cervus elaphus); chital (Axis axis); and rusa (Rusa timorensis), with no bag limits. However, in effect only the first three species are hunted because there are no wild populations of chital and rusa deer now present in Victoria. Hog deer (Axis porcinus) (Hill et al. 2019) can only be hunted during April and only one male and one female may be taken by each hunter during the regulated season. Limited balloting allows selected hunters to take small numbers outside the April season. The most commonly harvested deer species in Victoria is sambar, accounting for at least 70% of the deer harvest each year (Moloney and Hampton 2020). There are eight declared game species of duck in Victoria: Pacific black duck (Anas superciliosa); Australian wood duck (Chenonetta jubata); Australian shelduck (Tadorna tadornoides); grey teal (Anas gracilis); chestnut teal (Anas castanea); pink-eared duck (Malacorhynchus membranaceus); hardhead (Aythya australis); and blue-winged shoveler (Anas rhynchotis) (Moloney and Hampton 2020). For ducks, hunting is restricted to a prescribed season, occurring in Autumn each year, but season length (normally 12 weeks) and daily bag limits (normally 10 birds per day) vary according to environmental conditions, with seasons sometimes cancelled due to dry conditions. For stubble quail, there is also a prescribed Autumn season (April–June) and a daily bag limit (20 birds) that has not varied during the study period (Moloney and Powell 2019). For stubble quail, season length and daily bag limit did not vary with environmental conditions over the study period, nor were stubble quail seasons ever cancelled due to dry conditions.
The Victorian State Government game management agency has, since 2009, commissioned regular telephone surveys of randomly selected licenced hunters endorsed to hunt game deer, ducks or stubble quail. These surveys are used to estimate the total harvest of game animals, total days spent hunting, and the resulting efficiency of hunting each year (Moloney and Hampton 2020). These estimates are used to monitor resource use and to inform management actions. Annual harvest reports for deer and game birds have been produced using consistent methods for 11 years (2009–2019; Moloney and Powell 2019; Moloney and Hampton 2020).
In this paper, we collated data from 11 years of telephone surveys of licenced Victorian recreational hunters and modelled long-term harvest trends. We recorded additional information, such as where animals were harvested and the hunting method used. We acknowledge that 11 years is not necessarily ‘long-term’ when compared with wildlife monitoring programs collating multiple decades of data (e.g. >100 years; Monteith et al. 2013), but it is a substantial improvement on the temporal scale of any published work describing Australian recreational harvest trends. We explicitly modelled harvest and hunter activity in a Bayesian framework, enabling the estimation of these statistics and the factors hypothesised to influence them. We included hunting season arrangements and climatic factors as factors thought to affect harvest (Norman and Nicholls 1991; Briggs et al. 1993; Guthery et al. 2004). A Bayesian analysis is a more natural framework for expressing the uncertainty in estimates of total harvest and other derived statistics, which are key components of the modelled statistics (Lindström and Bergqvist 2020).
Materials and methods
Victorian hunting regulations
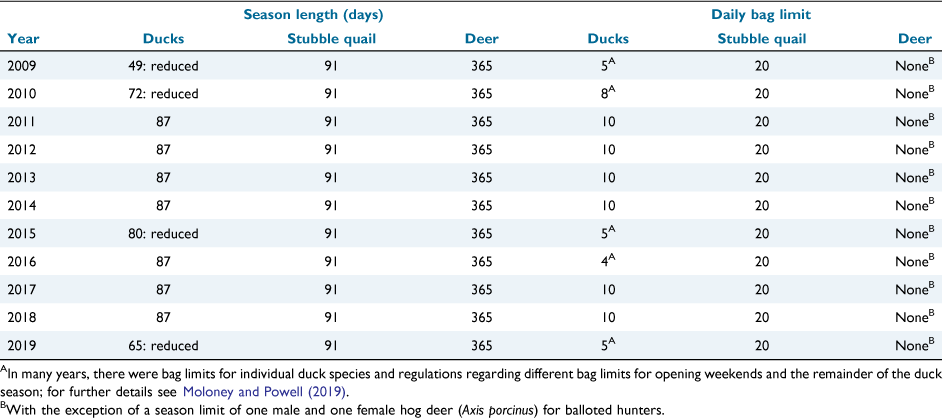
During the study period (2009–2019), only duck harvest regulations had substantial changes (Table 1). Of the 11 duck hunting seasons, five had a reduced daily bag limit (i.e. fewer than 10 ducks per hunter per day, but typically five ducks per hunter per day) due to dry conditions that reduced available habitat, restricted breeding and resulted in reduced abundance (Kingsford et al. 2020; Ramsey and Fanson 2021). Licensed hunters endorsed to hunt ducks are automatically endorsed to hunt stubble quail, but the reverse is not true. Generally, the duck hunting season lasts for around 12 weeks starting in March, with a prescribed daily bag limit of 10 ducks. In 2009 and since 2016, it has been prohibited to hunt the blue-winged shoveler due to low abundance, and this species has never exceeded 2% of the duck harvest since the telephone surveys began (Moloney and Powell 2019). There were few changes to deer hunting season dates. Restrictions on red deer hunting were lifted in 2012, extending the 2-month season to year-round, but they account for less than 2% of the total deer harvest in most years (Moloney and Hampton 2020), and therefore any effect on harvest would be negligible. The stubble quail season lasts for 12 weeks, starting in April, with a daily bag limit of 20 quail; this bag limit did not change during the study (Moloney and Powell 2019).
|
Telephone surveys
Separate surveys were conducted for deer (Supplementary Table S1), ducks (Supplementary Table S2) and stubble quail (Supplementary Table S3) hunters, with all following a similar format, also described in Gormley and Turnbull (2009). At set times during the hunting season for each group of game species, a random sample of hunters was surveyed via telephone. The set survey periods for deer were once every 2 months, for ducks, after opening weekend and then fortnightly, and for stubble quail, after opening weekend and then monthly. Different hunters were surveyed in each period. The target sample sizes for surveyed licensed hunters were 200 for deer and 200 for ducks for all years. For stubble quail the target initially was also 200, but after the first year of surveys it was recognised that more surveys were required, so it was increased to 300 per survey from 2010. Achieved sample sizes closely approximated targets once non-responders were removed, with mean numbers of respondents per survey across the 11 years of 200 (deer), 200 (ducks) and 293 (stubble quail), with standard deviations of 1.8, 4.3 and 25.3 respectively. Participation in the telephone survey was voluntary. Response rates for contacted licensed hunters were consistently >95% (Moloney and Powell 2019; Moloney and Hampton 2020). Hunters were asked questions about their hunting activities during that period related to the specific game species targeted by the survey. The respondents’ answers were then analysed to estimate measures of hunter success, activity and efficiency for each survey period and that year’s season overall. The annual statistics from the telephone surveys were collated for all three game species groups from 2009 to 2019.
Licensed hunter numbers
For each telephone survey, the database maintained by the Victorian government was analysed to quantify precisely the number of licenced hunters for each game species group.
Statistical analyses
For each game species group (deer, duck or stubble quail) there are seven statistics of interest: (1) the number of licenced hunters; (2) the total number of hunting days; (3) the total harvest; (4) the proportion of active hunters; (5) the average number of hunting days per active hunter; (6) the average harvest per active hunter; and (7) hunter efficiency. The total harvest for each game species group per survey period was estimated by multiplying the average harvest per active hunter by the total number of licenced hunters and the proportion of active hunters. The estimate of the total harvest for each game species group per year was calculated as the sum of the estimated harvest for each survey period. It is thought that hunter behaviour may be affected by hunting season arrangements and environmental conditions (Briggs et al. 1993; Guthery et al. 2004). The variables used in the models are defined in Table 2.

|
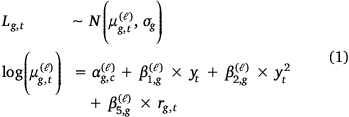
Data related to numbers of licenced hunters were treated differently to the other statistics of interest, because these were not estimates but were known with certainty at any given time. Therefore, although the trend in the number of licences was modelled over time, this model was separate from the model of the surveyed statistics. The model for the number of licences during a survey period (Lg,t) was modelled using a normal distribution on log-transformed data in a Bayesian framework. It covered the (bi-) monthly licence numbers for that licence type, where g are the licence types deer, ducks and stubble quail and t is the survey period. The time-of-year cohort (c) was different for each taxon but included the month of the survey for all licence types and opening weekend for ducks and quail. Time since the survey started (yt) was included as linear and quadratic terms. Management changes for duck season arrangements (rg,t) was 1 if daily bag limits were fewer than 10 and the licence type was duck, and 0 otherwise. The model for the expected number of licences  for licence type g in survey t is given in Eqn 1.
The proportion of active hunters, the average harvest per active hunter, and the average number of hunting days per active hunter were directly modelled from the survey data. The other three statistics were derived from those models.
Active hunters were defined as hunters that hunted at least once during the survey. There were Ag,t active hunters from the Qg,t licenced hunters surveyed with licence type g in survey t. Knowing the proportion of active hunters allowed for greater precision in the estimates, because we knew inactive hunters had zero harvest and hunting days to contribute to the total harvest and total hunting days. As a consequence, the relevant harvest and hunting day rates to model were the harvest per active hunter and hunting days per active hunter.
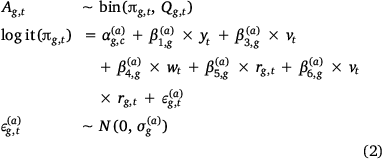
The proportion of active hunters (πg,t) was modelled using a mixed binomial model, accounting for linear changes over time (yt) as well as differences between survey periods for all licence types. The effect of weather on total harvest of game birds (ducks pooled and stubble quail) was included, as measured over the antecedent 12 months by the El Niño-Southern Oscillation (ENSO) as either El Niño (drier than normal in south-eastern Australia), La Niña (wetter than normal in south-eastern Australia) or neutral (average rainfall) phase (the three phases of the ENSO). We used the ENSO because it better explains changes in animal abundance over regional scales than local weather variables (Norman and Nicholls 1991; Hallett et al. 2004). vt and wt were used as indicators for El Niño and La Niña being active, respectively. The effect of having a reduced daily bag limit (rg,t) for ducks was included for the duck models. The model for the proportion of active hunters per survey (πg,t) including linear effects over time, La Niña and El Niño status and harvest restriction as categorical variables is given in Eqn 2.
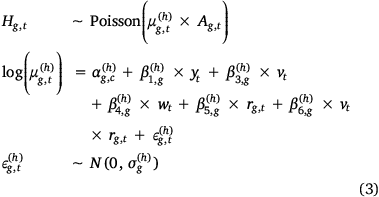
The mean harvest rate per active hunter  was modelled using a mixed Poisson model accounting for the same explanatory variables as the proportion of hunting days for that licence type, and is given in Eqn 3. The total harvest by active hunters per survey (Hg,t) is a result of the harvest rate per active hunter
  and the number of active hunters (Ag,t) for licence type g in survey t.
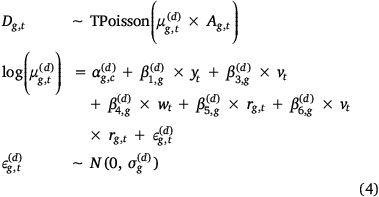
The mean hunting days per active hunter  was modelled using a mixed zero-truncated Poisson model accounting for the same explanatory variables as the proportion of hunting days for that licence type. The zero-truncated Poisson distribution was used because any active hunter must have hunted at least 1 day. This was not the case for the harvest rate of active hunters as it is sometimes common for active hunters to have zero harvest. The model for the hunting days of active hunters per survey (Dg,t) is given in Eqn 4.
Hunter efficiency (harvest per hunting day), total harvest per year and total hunting days per year for deer, ducks and stubble quail were derived from a combination of the key hunting rates and licenced hunter numbers. Hunter efficiency per survey (Eg,t) was the ratio of harvest per active hunter per survey and hunting days per active hunter per survey (Eqn 5):

Total harvest per year was the sum of the estimated total harvest per survey from that year. The total harvest per survey  was the product of the number of licence holders, the proportion of active hunters and the harvest per active hunter for licence type g in survey t, as given in Eqn 6. This formulation was analogous to a zero-inflated Poisson model for the harvest per licence holder scaled to the total licence holder cohort (Lambert 1992; Hall 2000).

Total hunting days per year was the sum of the estimated total hunting days per survey from that year. The total hunting days per survey  was the product of the number of licenced hunters, the proportion of active hunters and the hunting days per active hunter for licence type g in survey t, as given in Eqn 7. This formulation was analogous to a hurdle Poisson model for the harvest per licence holder scaled to the total licence holder cohort (Mullahy 1986; Potts and Elith 2006).

Estimating change over time for derived statistics, like hunter efficiency or total annual harvest, used the geometric mean of the ratio of the current value compared with the previous value from their posterior distributions. Estimating differences between weather conditions or harvest restrictions for derived statistics used the ratio of the value under the scenario of interest compared with the value under neutral weather with no harvest restrictions (excluding year terms) from the relevant posterior distributions. Estimates of the deseasonalised trends for a derived statistic were done by estimating the derived statistic using the arithmetic mean of the intercepts for each time-of-year cohort (c), instead of the intercepts for each specific time-of-year cohort from the relevant posterior distributions.
All models were constructed in a Bayesian framework using JAGS via R (R Core Team 2020) using the package R2jags (Su and Yajima 2015). Vague prior distributions were employed for all response variables, with coefficients having a prior of U(−10, 10) and scale parameters a prior of Г(0.0001, 0.0001). Parameters were estimated from four chains of 30 000 iterations, 10 000 of which were used as burn-in periods (total posterior samples = 80 000). Code is provided in Supplementary material for deer (Code S1), ducks (Code S2) and stubble quail (Code S3). Chains were considered converged using visual assessment, and if all Gelman and Rubin’s convergence diagnostic potential scale reduction factors were <1.05 (Gelman and Rubin 1992). Data are presented as mean values with 95% credible intervals (CIs) in parentheses.
Results
Introduced deer
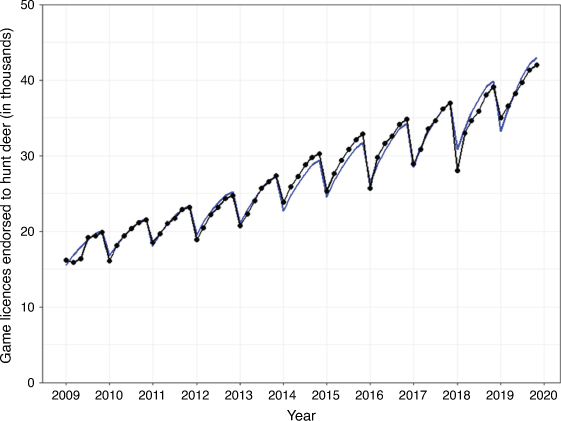
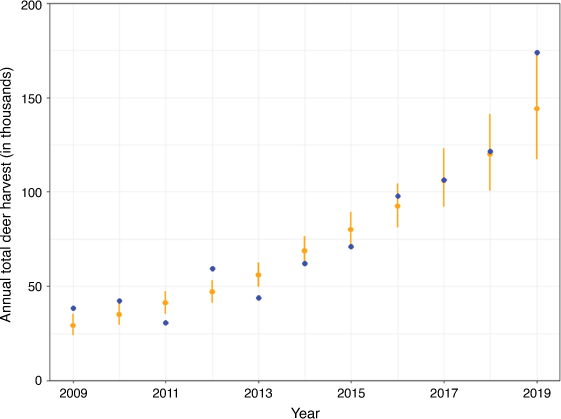
Both the number of deer hunters and the number of deer harvested increased considerably during the 11-year study. The number of licensed deer hunters increased from 16 193 in 2009 to 41 985 in 2019, with the reported annual harvest increasing from 39 418 (33 300–46 700) in 2009 to 173 800 (141 400–213 500) in 2019. The number of game licence holders endorsed to hunt deer increased consistently over the survey period (Fig. 1), with an annual increase of 7.9% (7.9–8.0%) ( in Supplementary Table S4). The proportion of active deer hunters changed little during the survey period (
 in Supplementary Table S5), but there were seasonal differences. The proportion of active hunters was highest in July–August (33%; 29–37%), stable in the remaining months from March–October (~28% on average), and then was lowest in November–December (17%; 15–20%), with even fewer deer hunters active in January–February (14%; 11–16%) (Supplementary Fig. S1 and
  in Supplementary Table S5).
|
The deer harvest per active deer hunter increased between 2009 and 2019 (Supplementary Table S6), with an annual increase of 8.3% (5.3–11.4%,  in Supplementary Table S6). The number of deer hunting days per active hunter remained consistent over the same period (
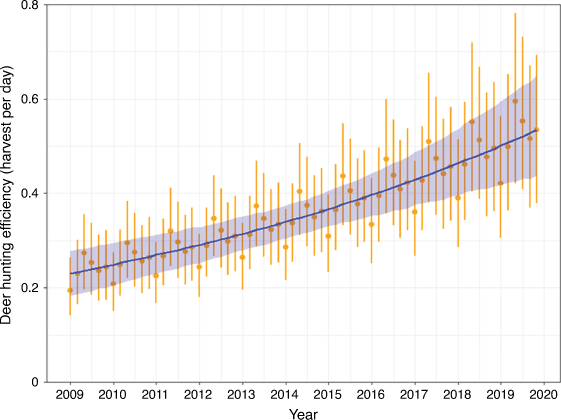
 in Supplementary Table S7). Deer hunting efficiency (deer harvest per hunting day) increased, with an annual increase of 8.1% (4.7–11.6%; Fig. 2). The estimated annual total deer hunting days increased at 8.5% (3.5–14.4%) per year. The net result was that annual total deer harvest increased exponentially (Fig. 3), at 17.3% (13.5–21.0%) per year.
|
|
Native ducks
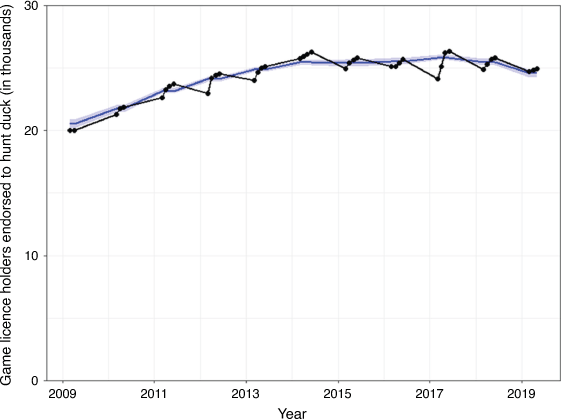
The number of licensed duck hunters increased consistently from 2009 to 2013, before plateauing at approximately 25 000 (Fig. 4 and  and
and  in Supplementary Table S8). Seasons with reduced bag limits (<10 ducks per day) reduced licensed duck hunter numbers by 1.5% (0.3–2.5%) (
 in Supplementary Table S8). The proportion of active duck hunters decreased over time (
 in Supplementary Table S9), with duck hunters being active during a survey period decreasing by 6% per year (3–8%) (Supplementary Fig. S2). There was strong evidence that in the 30 observations across five seasons with reduced daily bag limits, the duck harvest per active duck hunter per survey was reduced (
 in Supplementary Table S10). The reduction was larger if the season was an El Niño (reduced by 34% (25–43%),
  in Supplementary Table S10, from 16 observations across three seasons), compared with neutral conditions (reduced by 23% (12–34%),
  in Supplementary Table S10, from 14 observations across three seasons). There was also some evidence that duck harvest per active duck hunter was greater under La Niña conditions (94% of parameter’s posterior distribution was positive from 16 observations across three seasons) and El Niño conditions with typical (i.e. not reduced) daily bag limits (95% of parameter’s posterior distribution was positive from four observations across one season). The grouping of all non‐full bag limits together as ‘reduced’ may have had some effect on our results, although it is unlikely this was significant because the majority of reductions were to half of the full quota.
|
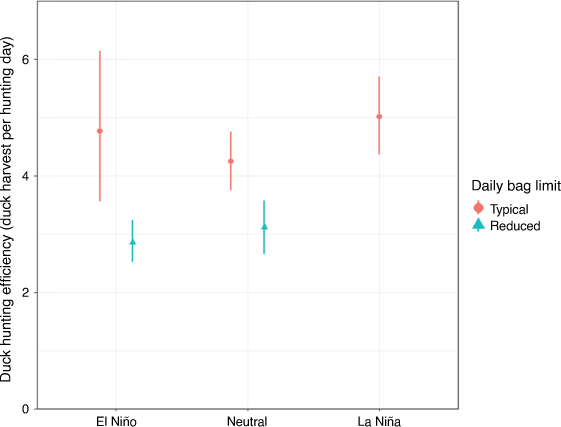
The number of days spent hunting per active duck hunter remained steady (Supplementary Table S11). Duck hunting efficiency (duck harvest per hunting day) also remained steady when taking conditions (environmental and regulator) into account. Compared with neutral conditions with a typical daily duck bag limit of 10 birds, efficiency: decreased by 27% (13–39%) when there was a reduced daily bag limit under neutral conditions; decreased by 33% (21–44%) when there was a reduced daily bag limit under El Niño conditions; and increased by 18% (−5–39%) under La Niña conditions (Fig. 5).
|
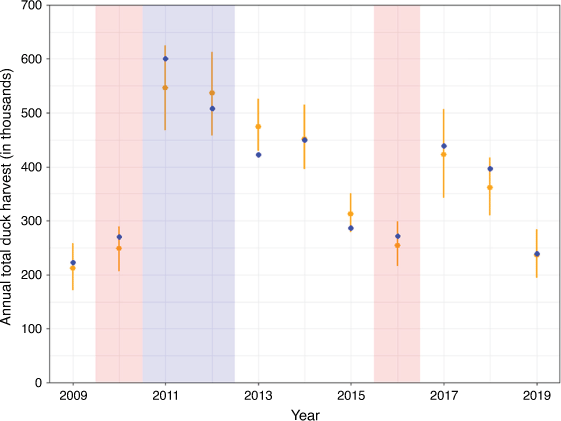
The annual total duck harvest remained steady when taking conditions into account (Fig. 6). The estimated annual total duck harvest change over time was 1.2% (−1.5–3.8%) per year. In seasons when the daily bag limit was reduced under neutral weather conditions, the annual total duck harvest was reduced by 18% (0–34%) compared with typical daily bag limits under neutral weather conditions. If it was an El Niño season with reduced daily bag limits, the annual total duck harvest was even lower, reduced by 22% (3–38%) compared with reduced daily bag limits under neutral weather conditions.
|
Native stubble quail
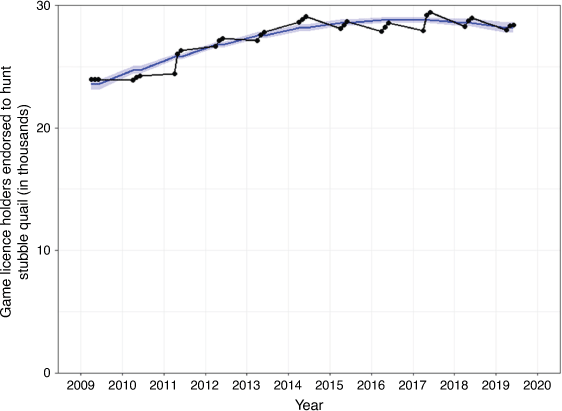
The number of licenced quail hunters increased steadily between 2009 and 2013 before plateauing at approximately 28 000 (Fig. 7 and  and
and  in Supplementary Table S11). The proportion of active hunters decreased over time (
 in Supplementary Table S12), with the odds of a hunter being active during a survey decreasing by 4% per year (0–8%). Environmental conditions affected the proportion of active hunters in a survey: compared to neutral conditions, the odds of a hunter being active during a La Niña survey was higher by a factor of 2.03 (1.43–2.88), but in an El Niño year the odds were reduced by 31% (8–48%; Supplementary Fig. S3 and
  and
and  in Supplementary Table S12 respectively). The harvest per active hunter changed little over time (
 in Supplementary Table S13), but there was some evidence that harvest per active hunter was greater under La Niña conditions (96% of this parameter’s posterior distribution was positive). Hunting days per active hunter increased marginally over time (
 in Supplementary Table S14), increasing annually by 4% (0–7%). The number of hunting days per active hunter increased under El Niño conditions by 31% (3–67%) compared with neutral conditions (
 in Supplementary Table S14).
|
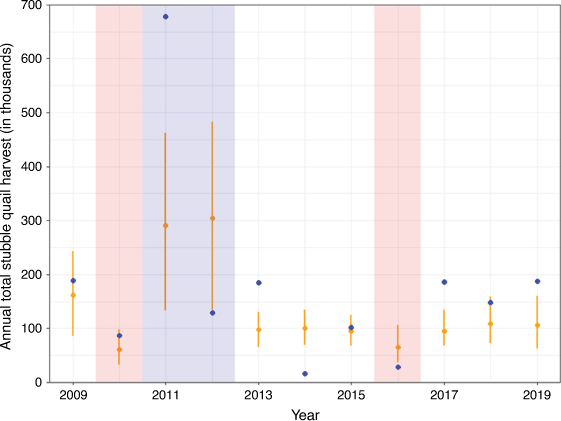
Hunting efficiency (birds harvested per hunting day) remained steady after accounting for environmental conditions. Environmental conditions may affect efficiency, but the variability was too large to support a reasonable claim of differences between ENSO status (Supplementary Fig. S4). After accounting for environmental conditions, the annual total harvest changed little (−3.8% (−10.7–3.7%); Fig. 8). However, there was an exceptionally large harvest of stubble quail in 2011, a La Niña season, during which 678 431 (573 500–802 500) birds were harvested (Fig. 8). There was an increased total annual harvest in the two La Niña seasons (2011 and 2012); however, from a visual assessment of the modelled harvest totals versus the reported harvest total (Fig. 8), it is clear the model did not fit the data well, with one La Niña season being severely underestimated (2011) and the other overestimated (2012), and 7 of the 11 annual harvest totals being outside the 95% credible intervals (Fig. 8).
|
Discussion
Understanding the effects of recreational hunting is critical globally for conservation of native species and strategic management of introduced species. We present our analysis as a step forward in managing impacts of hunting on Australian wildlife. Our results suggest strongly contrasting trends over a decade in harvest of introduced deer when compared with native birds.
Introduced deer
Several harvest statistics increased for deer hunting. First, the number of deer hunters increased by an average of 8% per year. This is a markedly different trend to that seen in North America, where the popularity of deer hunting has been declining for several decades (Winkler and Warnke 2013). In particular, long-term per-capita participation in hunting has declined considerably in the USA (Karns et al. 2015). Since the 1980s, the number of annual hunting licence holders in the USA has decreased by approximately 2 million and the number of active hunters has declined by approximately 30% (U.S. Fish & Wildlife Service 2018; Vayer et al. 2021). Second, the harvest per active deer hunter increased by 8% per year. However, there was no increase in the proportion of active hunters or hunting days per active hunter. Therefore, the increase in total deer harvest (17% per year) can be attributed to an increase in the number of deer hunters and increased efficiency (deer harvested per day). That is, roughly half of the increase in total deer harvest can be attributed to an increase in the number of deer hunters, and the remainder can be attributed to greater hunter efficiency.
One possible reason for the greater efficiency of deer hunting over time could be easier access to deer, with increasing allowance of deer hunting on public and private land (Watter et al. 2020). Deer have been increasing their range in south-eastern Australia (Gormley et al. 2011; Davis et al. 2016), and have anecdotally been increasing in abundance (Watter et al. 2020), although there is no statewide monitoring of deer abundance in Victoria. Due to the high cost of monitoring deer abundances at large spatial scales, the abundances of ungulates are often indexed using harvest statistics (Van Deelen and Etter 2003; Imperio et al. 2010; Kahlert et al. 2015). A previous study of deer hunting in Victoria used catch per unit effort (CPUE) data from 1984 to 2013, and showed that the abundance of sambar deer increased more than fourfold during that period (Forsyth et al. 2018). The results reported in this study extend that trend. Following this approach, the results reported in this study suggest that deer abundances in Victoria has increased markedly in the past decade. Increased abundance of deer could potentially lead to an increase in an ease of finding deer, and therefore an increase in hunter efficiency.
Native ducks
There were limited temporal changes in the number of duck hunters, but the proportion of these hunters who actively hunted during any survey period declined by about 10%, from 34% in 2009 to 22% in 2019. For active duck hunters, the size of their harvest (accounting for changing bag limits) and time spent hunting remained consistent over time. Environmental conditions affected the number of ducks harvested per active hunter, but not the number of hunters, number of hunting days, or the proportion of active hunters. There was strong evidence that in El Niño seasons where the daily bag limit was reduced, the duck harvest per active hunter and hunter efficiency decreased. This effect could have been a response to both the lower abundance of birds or the reduced seasons (bag limits and season length), but the extent of the influence of each variable is unclear.
For active duck hunters, the size of their harvest (accounting for changing bag limits) and time spent hunting have remained relatively consistent. There was no evidence of a consistent change to total harvest over time, unrelated to changes in environmental or regulatory conditions. There was some evidence that in La Niña seasons, harvest per active duck hunter and hunter efficiency increased. These increases probably related to greater numbers of ducks and suitable wetlands available for hunting (Kingsford et al. 2020). For comparison, Norman and Nicholls (1991) found that waterfowl harvest in eastern Australia in past decades was positively correlated with SOI (southern oscillation index), and most significantly 25–28 months before. This agrees with our results and may be explained by potential concentration of ducks during dry years to limited numbers of wetlands holding water. If hunters target those areas, ducks would be exposed to more hunting pressure.
Native stubble quail
The poor fit of the stubble quail model to the data was likely a consequence of the boom–bust nature of the species (Runge et al. 2015). One year (2011) had 35% of the total estimated stubble quail harvest over the 11 years of the survey. The very large harvest in 2011 is hard to reconcile with the remainder of the data. 2011 was a year affected by La Niña conditions, but so was 2012, in which the estimated harvest was only 19% of 2011. The Australian ‘millennium drought’ broke in 2009–2010 (Wang et al. 2018), bringing rainfall that led to a rapid increase in quail abundance, given that stubble quail reach sexual maturity at 4 months of age and can breed at any time and several times a year (Toop 1994). The ‘boom’ year of 2011 could be removed from the analysis, but the results would be limited to ‘non-boom’ years. Incorporating more ‘boom’ years into the analysis might improve the fit of the model (Kingsford et al. 1999). Alternatively, it is possible that a model with a random year effect (e.g. Jordan et al. 2017) might fit such a lifecycle better than the trend model that we used.
Future research
Bayesian modelling of key survey statistics from a long-term data set enabled the estimation of critical harvest parameters and elucidation of factors affecting them. The long-term trends presented here are informative for better understanding harvest, but there has been no quantitative monitoring of game animals in Victoria, with the exception of the Eastern Australian Waterbird Survey, which collects an index of abundance for game ducks and other waterbird species (Kingsford et al. 2020). This has limited analysis of harvesting dynamics, and hence confidence in sustainable practices for native species and the role of hunters in reducing the abundance of introduced deer. It is worth noting that as of 2020, an annual game duck abundance monitoring program has begun in Victoria (Ramsey and Fanson 2021), in a move towards adaptive harvest management (Nichols et al. 2007), which will improve understanding of population-level impacts of recreational duck hunting.
Conclusion
Long-term monitoring of harvest trends in south-eastern Australia revealed stark differences between introduced deer and native game birds, with harvest of the former increasing rapidly while equivalent rates for the latter were unchanging or declining. Seasonal effects had a strong influence on game bird harvest, and these impacts will be critical for predicting sustainable bag limits for these species. Evidence that harvest may be higher for ducks in dry years in the absence of reduced bag size are important for preventing unsustainable harvest of these game animals. The use of Bayesian modelling provided a robust analysis of long-term harvest trends. The monitoring of harvest should be ongoing and combined with monitoring of the abundance of the game species so that harvest rates can be estimated.
Supplementary material
Supplementary material is available online.
Data availability
The data that support this study cannot be publicly shared due to privacy reasons but may be shared upon reasonable request to the corresponding author if appropriate.
Conflicts of interest
The authors declare no conflicts of interest.
Declaration of funding
This study was funded by the Victorian Game Management Authority.
Acknowledgements
No licences or permits were required for this study. All hunter questionnaires were performed by government agencies for operational natural resource management. We thank J. Turnbull for assistance with survey design and two anonymous reviewers for comments that greatly improved this paper.
References
Briggs, SV, Brickhill, JG, Kingsford, RT, and Hodgson, PF (1993). Ducks, hunters and rainfall at two sites in southern inland New South Wales. Wildlife Research 20, 759–769.| Ducks, hunters and rainfall at two sites in southern inland New South Wales.Crossref | GoogleScholarGoogle Scholar |
Davis, NE, Bennett, A, Forsyth, DM, Bowman, DMJS, Lefroy, EC, Wood, SW, Woolnough, AP, West, P, Hampton, JO, and Johnson, CN (2016). A systematic review of the impacts and management of introduced deer (family Cervidae) in Australia. Wildlife Research 43, 515–532.
| A systematic review of the impacts and management of introduced deer (family Cervidae) in Australia.Crossref | GoogleScholarGoogle Scholar |
Finch, N, Murray, P, Hoy, J, and Baxter, G (2014). Expenditure and motivation of Australian recreational hunters. Wildlife Research 41, 76–83.
| Expenditure and motivation of Australian recreational hunters.Crossref | GoogleScholarGoogle Scholar |
Forsyth, DM, Caley, P, Davis, NE, Latham, ADM, Woolnough, AP, Woodford, LP, Stamation, KA, Moloney, PD, and Pascoe, C (2018). Functional responses of an apex predator and a mesopredator to an invading ungulate: dingoes, red foxes and sambar deer in south‐east Australia. Austral Ecology 43, 375–384.
| Functional responses of an apex predator and a mesopredator to an invading ungulate: dingoes, red foxes and sambar deer in south‐east Australia.Crossref | GoogleScholarGoogle Scholar |
Game Management Authority (2021) Responsibilities for game management and hunting in Victoria. Game Management Authority, Melbourne, Vic., Australia. Available at https://www.gma.vic.gov.au/environment/laws/responsibilities-for-game-management-and-hunting-in-victoria [verified 3 September 2021]
Gelman, A, and Rubin, DB (1992). Inference from iterative simulation using multiple sequences. Statistical Science 7, 457–472.
| Inference from iterative simulation using multiple sequences.Crossref | GoogleScholarGoogle Scholar |
Ginsberg, JR, and Milner‐Gulland, EJ (1994). Sex‐biased harvesting and population dynamics in ungulates: implications for conservation and sustainable use. Conservation Biology 8, 157–166.
| Sex‐biased harvesting and population dynamics in ungulates: implications for conservation and sustainable use.Crossref | GoogleScholarGoogle Scholar |
Gormley AM, Turnbull JD (2009) Estimates of harvest for deer, duck and quail in Victoria: results from surveys of Victorian game licence holders in 2009. Arthur Rylah Institute for Environmental Research, Department of Sustainability and Environment, Melbourne, Vic., Australia
Gormley, AM, Forsyth, DM, Griffioen, P, Lindeman, M, Ramsey, DSL, Scroggie, MP, and Woodford, L (2011). Using presence‐only and presence–absence data to estimate the current and potential distributions of established invasive species. Journal of Applied Ecology 48, 25–34.
| Using presence‐only and presence–absence data to estimate the current and potential distributions of established invasive species.Crossref | GoogleScholarGoogle Scholar |
Guthery, FS, Crews, AK, Lusk, JJ, Chapman, RN, and Sams, M (2004). Effects of bag limits on bobwhite hunters and harvest. The Journal of Wildlife Management 68, 1095–1103.
| Effects of bag limits on bobwhite hunters and harvest.Crossref | GoogleScholarGoogle Scholar |
Hall, DB (2000). Zero‐inflated Poisson and binomial regression with random effects: a case study. Biometrics 56, 1030–1039.
| Zero‐inflated Poisson and binomial regression with random effects: a case study.Crossref | GoogleScholarGoogle Scholar | 11129458PubMed |
Hallett, TB, Coulson, T, Pilkington, JG, Clutton-Brock, TH, Pemberton, JM, and Grenfell, BT (2004). Why large-scale climate indices seem to predict ecological processes better than local weather. Nature 430, 71–75.
| Why large-scale climate indices seem to predict ecological processes better than local weather.Crossref | GoogleScholarGoogle Scholar | 15229599PubMed |
Hill, E, Linacre, A, Toop, S, Murphy, N, and Strugnell, J (2019). Widespread hybridization in the introduced hog deer population of Victoria, Australia, and its implications for conservation. Ecology and Evolution 9, 10828–10842.
| Widespread hybridization in the introduced hog deer population of Victoria, Australia, and its implications for conservation.Crossref | GoogleScholarGoogle Scholar | 31624584PubMed |
Imperio, S, Ferrante, M, Grignetti, A, Santini, G, and Focardi, S (2010). Investigating population dynamics in ungulates: do hunting statistics make up a good index of population abundance? Wildlife Biology 16, 205–214.
| Investigating population dynamics in ungulates: do hunting statistics make up a good index of population abundance?Crossref | GoogleScholarGoogle Scholar |
Jordan, R, James, AI, Moore, D, and Franklin, DC (2017). Boom and bust (or not?) among birds in an Australian semi-desert. Journal of Arid Environments 139, 58–66.
| Boom and bust (or not?) among birds in an Australian semi-desert.Crossref | GoogleScholarGoogle Scholar |
Kahlert, J, Fox, AD, Heldbjerg, H, Asferg, T, and Sunde, P (2015). Functional responses of human hunters to their prey – why harvest statistics may not always reflect changes in prey population abundance. Wildlife Biology 21, 294–302.
| Functional responses of human hunters to their prey – why harvest statistics may not always reflect changes in prey population abundance.Crossref | GoogleScholarGoogle Scholar |
Karns, GR, Bruskotter, JT, and Gates, RJ (2015). Explaining hunting participation in Ohio: a story of changing land use and new technology. Human Dimensions of Wildlife 20, 484–500.
| Explaining hunting participation in Ohio: a story of changing land use and new technology.Crossref | GoogleScholarGoogle Scholar |
Kinghorn, JR (1926). Economic value of the stubble quail. Emu-Austral Ornithology 26, 112–119.
| Economic value of the stubble quail.Crossref | GoogleScholarGoogle Scholar |
Kingsford, RT, Curtin, AL, and Porter, J (1999). Water flows on Cooper Creek in arid Australia determine ‘boom’ and ‘bust’ periods for waterbirds. Biological Conservation 88, 231–248.
| Water flows on Cooper Creek in arid Australia determine ‘boom’ and ‘bust’ periods for waterbirds.Crossref | GoogleScholarGoogle Scholar |
Kingsford, RT, Porter, JL, Brandis, KJ, and Ryall, S (2020). Aerial surveys of waterbirds in Australia. Scientific Data 7, 172.
| Aerial surveys of waterbirds in Australia.Crossref | GoogleScholarGoogle Scholar | 32522998PubMed |
Lambert, D (1992). Zero-inflated Poisson regression, with an application to defects in manufacturing. Technometrics 34, 1–14.
| Zero-inflated Poisson regression, with an application to defects in manufacturing.Crossref | GoogleScholarGoogle Scholar |
Lindström, T, and Bergqvist, G (2020). Estimating hunting harvest from partial reporting: a Bayesian approach. Scientific Reports 10, 21113.
| Estimating hunting harvest from partial reporting: a Bayesian approach.Crossref | GoogleScholarGoogle Scholar | 33273576PubMed |
Loyn, RH (1991). Assessing and managing the impact of duck hunting in Victoria – a new approach. Wildfowl 42, 155–161.
Lunney, D, Dickman, CR, and Predavec, M (2018). The critical value of long-term field studies and datasets: an editorial perspective. Australian Zoologist 39, 559–567.
| The critical value of long-term field studies and datasets: an editorial perspective.Crossref | GoogleScholarGoogle Scholar |
Moloney PD, Hampton JO (2020) Estimates of the 2019 deer harvest in Victoria: results from surveys of Victorian Game Licence holders in 2019. Game Management Authority, Melbourne, Vic., Australia.
Moloney PD, Powell Z (2019) Estimates of duck and stubble quail harvests in Victoria for 2019: results from surveys of Victorian Game Licence holders in 2019. Game Management Authority, Melbourne, Vic., Australia.
Monteith, KL, Long, RA, Bleich, VC, Heffelfinger, JR, Krausman, PR, and Bowyer, RT (2013). Effects of harvest, culture, and climate on trends in size of horn‐like structures in trophy ungulates. Wildlife Monographs 183, 1–28.
| Effects of harvest, culture, and climate on trends in size of horn‐like structures in trophy ungulates.Crossref | GoogleScholarGoogle Scholar |
Mullahy, J (1986). Specification and testing of some modified count data models. Journal of Econometrics 33, 341–365.
| Specification and testing of some modified count data models.Crossref | GoogleScholarGoogle Scholar |
Nichols, JD, Runge, MC, Johnson, FA, and Williams, BK (2007). Adaptive harvest management of North American waterfowl populations: a brief history and future prospects. Journal of Ornithology 148, 343–349.
| Adaptive harvest management of North American waterfowl populations: a brief history and future prospects.Crossref | GoogleScholarGoogle Scholar |
Norman, FI, and Nicholls, N (1991). The Southern Oscillation and variations in waterfowl abundance in southeastern Australia. Australian Journal of Ecology 16, 485–490.
| The Southern Oscillation and variations in waterfowl abundance in southeastern Australia.Crossref | GoogleScholarGoogle Scholar |
Otis, DL (2006). Mourning dove hunting regulation strategy based on annual harvest statistics and banding data. The Journal of Wildlife Management 70, 1302–1307.
| Mourning dove hunting regulation strategy based on annual harvest statistics and banding data.Crossref | GoogleScholarGoogle Scholar |
Potts, JM, and Elith, J (2006). Comparing species abundance models. Ecological Modelling 199, 153–163.
| Comparing species abundance models.Crossref | GoogleScholarGoogle Scholar |
R Core Team (2020) R: A language and environment for statistical computing. v 4.0.3. R Foundation for Statistical Computing, Vienna, Austria. Available at https://www.R-project.org/ [verified 3 September 2021]
Ramsey DSL, Fanson B (2021) Abundance estimates for game ducks in Victoria: results from the 2020 aerial survey. Arthur Rylah Institute for Environmental Research, Department of Environment, Land, Water and Planning, Melbourne, Vic., Australia.
Rivrud, IM, Sonkoly, K, Lehoczki, R, Csányi, S, Storvik, GO, and Mysterud, A (2013). Hunter selection and long‐term trend (1881–2008) of red deer trophy sizes in Hungary. Journal of Applied Ecology 50, 168–180.
| Hunter selection and long‐term trend (1881–2008) of red deer trophy sizes in Hungary.Crossref | GoogleScholarGoogle Scholar |
Runge, CA, Tulloch, A, Hammill, E, Possingham, HP, and Fuller, RA (2015). Geographic range size and extinction risk assessment in nomadic species. Conservation Biology 29, 865–876.
| Geographic range size and extinction risk assessment in nomadic species.Crossref | GoogleScholarGoogle Scholar | 25580637PubMed |
Rupp, SP, Ballard, WB, and Wallace, MC (2000). A nationwide evaluation of deer hunter harvest survey techniques. Wildlife Society Bulletin 28, 570–578.
Sharp R, Wollscheid K-U (2009) An overview of recreational hunting in North America, Europe and Australia. In ‘Recreational Hunting, Conservation and Rural Livelihoods: Science and Practice’. (Eds B Dickson, J Hutton, WM Adams) pp. 25–38. (Wiley-Blackwell: London, UK)
Su Y-S, Yajima M (2015) R2jags: using R to run ‘JAGS’: R package version 0.5–7. Available at https://cran.r-project.org/package=R2jags [verified 3 September 2021]
Toop SD (1994) Reproductive timing and habitat preference in the stubble quail. Honours Thesis, University of Ballarat, Ballarat, Vic., Australia.
U.S. Fish & Wildlife Service (2018) 2016 National Survey of Fishing, Hunting and Wildlife-Associated Recreation. US Fish & Wildlife Service, Washington, DC, USA.
Van Deelen, T, and Etter, D (2003). Effort and the functional response of deer hunters. Human Dimensions of Wildlife 8, 97–108.
| Effort and the functional response of deer hunters.Crossref | GoogleScholarGoogle Scholar |
Vayer, VR, Larson, LR, Peterson, MN, Lee, KJ, Von Furstenberg, R, Choi, DY, Stevenson, K, Ahlers, AA, Anhalt‐Depies, C, and Bethke, T (2021). Diverse university students across the United States reveal promising pathways to hunter recruitment and retention. The Journal of Wildlife Management 85, 1017–1030.
| Diverse university students across the United States reveal promising pathways to hunter recruitment and retention.Crossref | GoogleScholarGoogle Scholar |
Wang, J, Horne, A, Nathan, R, Peel, M, and Neave, I (2018). Vulnerability of ecological condition to the sequencing of wet and dry spells prior to and during the Murray–Darling basin millennium drought. Journal of Water Resources Planning Management 144, 04018049.
| Vulnerability of ecological condition to the sequencing of wet and dry spells prior to and during the Murray–Darling basin millennium drought.Crossref | GoogleScholarGoogle Scholar |
Watter, K, Thomas, E, White, N, Finch, N, and Murray, PJ (2020). Reproductive seasonality and rate of increase of wild sambar deer (Rusa unicolor) in a new environment, Victoria, Australia. Animal Reproduction Science 223, 106630.
| Reproductive seasonality and rate of increase of wild sambar deer (Rusa unicolor) in a new environment, Victoria, Australia.Crossref | GoogleScholarGoogle Scholar | 33166829PubMed |
Winkler, R, and Warnke, K (2013). The future of hunting: an age-period-cohort analysis of deer hunter decline. Population and Environment 34, 460–480.
| The future of hunting: an age-period-cohort analysis of deer hunter decline.Crossref | GoogleScholarGoogle Scholar |


