

The golden-tailed gecko: a disturbance-tolerant species in a fragmenting environment
Chris R. Pavey A B E , Eric Vanderduys C and S. Raghu D
A CSIRO Land and Water, PMB 44 Winnellie, NT 0822, Australia.
B Workgroup for Endangered Species, Johann-Friedrich-Blumenbach Institute of Zoology, Georg-August University, Göttingen, Germany.
C CSIRO Land and Water, GPO Box 2583, Brisbane, Qld 4001, Australia.
D CSIRO Health and Biosecurity, GPO Box 2583, Brisbane, Qld 4001, Australia.
E Corresponding author. Email: chris.pavey@csiro.au
Wildlife Research 48(7) 643-653 https://doi.org/10.1071/WR20115
Submitted: 7 July 2020 Accepted: 15 April 2021 Published: 21 May 2021
Journal Compilation © CSIRO 2021 Open Access CC BY-NC
Abstract
Context: In central Queensland, Australia, the development of a coal-seam gas (CSG) industry is creating additional fragmentation of landscapes consisting of woodland and open forest that are already highly fragmented.
Aims: To assess the response to fragmentation of Strophurus taenicauda (golden-tailed gecko). The species is ‘near threatened’ in Queensland.
Methods: Occurrence and abundance were examined across three categories of patch size – small (≤10 ha), medium (10–100 ha) and large (≥100 ha) – across three geographic areas of the species’ range. Minimal impact (i.e. sighting only) active searches for geckos were conducted at night. A minimum of three replicate sites of each patch size category was surveyed in each of the three geographic areas. Eleven additional patches (each <4 ha and located in the southern geographic area) were surveyed to investigate how size and spatial isolation of small patches affected occurrence and abundance of S. taenicauda. At all sites a standardised set of 22 habitat variables was collected, and the presence of other species of arboreal gecko was recorded.
Key results: The species was located across patches of all sizes, including those as small as 1.11 ha. It was also located opportunistically in the matrix among patches and occurred in isolated trees within an urban area. The abundance of another commonly occurring arboreal gecko, Gehyra dubia (dubious dtella), was negatively correlated with S. taenicauda abundance in small patches. The most important habitat variable for S. taenicauda was average basal area of trees. As this increased, especially above 5.7 m2 ha−1, it was more likely to be present. When considering only the small patches, the main factors influencing presence and abundance of S. taenicauda were the average basal area of Callitris glaucophylla (white cypress) and grazing (negligible or absent).
Conclusions: Strophurus taenicauda is a species that is tolerant of disturbance and can persist in fragmented habitat, provided the fragments have adequate cover of white cypress.
Implications: The species appears to be resilient to the current level of CSG development within its geographic range.
Keywords: brigalow, matrix, patch size, remnant, white cypress.
Introduction
Understanding the habitat requirements of animal and plant species is a fundamental aspect of ecology. This task takes on heightened importance when the species concerned is classified as threatened or potentially at risk from anthropogenic or natural disturbances. The loss and fragmentation of habitat, driven by anthropogenic disturbance, has been identified as a significant driver of wildlife defaunation globally, triggering extinctions of species and populations, and local declines in abundance of individuals (Dirzo et al. 2014).
Species responses to habitat fragmentation can be difficult to predict because fragmentation is an aggregate process that involves both a decline in the area of habitat and alteration of its spatial configuration (Yeager et al. 2016). When considering changes in spatial configuration, a range of attributes have been shown to be important. These factors include patch size (the area of a fragment of potential habitat), patch isolation, number of patches, matrix (the areas between the remaining fragments) quality and edge characteristics (Fahrig 2003). Members of different species vary in their responses to the fragmentation of their habitat (Keinath et al. 2017). In one recent major review of the literature, most studies that demonstrated a response to fragmentation reported a positive one for the species concerned (Fahrig 2017; Fahrig et al. 2019).
Although further fragmentation of already fragmented landscapes can result from a range of development types, development of unconventional gas resources has recently emerged as a significant fragmenting process and hence as an emerging conservation issue (Brittingham et al. 2014; Hobday and McDonald 2014; Souther et al. 2014). Optimisation of underground coal-seam gas (CSG) exploitation generally involves a trade-off between interference from adjacent gas boreholes and infrastructure costs, meaning accessing these resources inherently results in high levels of fragmentation (Baker et al. 2012). The high degree of fragmentation exists primarily because of the road infrastructure necessary to access the optimally placed boreholes. Unconventional gas developments are often implemented rapidly and over very large areas (>1 million ha). In the Brigalow Belt region of central and southern Queensland, Australia, landscapes of woodland and open forest that have been heavily fragmented by over 150 years of agricultural development are being further disturbed by the rapid construction and operation of an unconventional CSG industry (Hobday and McDonald 2014).
The Brigalow Belt had lost 60% of its original vegetation by 1999, with a high rate of ongoing clearing for grazing and crop production (Wilson et al. 2002). The construction and operation of a CSG industry, commencing in 2011, has produced additional clearing and fragmentation of the original vegetation (APLNG Project EIS 2010), with the potential for interaction with existing threats including introduced carnivores and invasive plants. The amount of clearing resulting from well and road construction varies and is ongoing, but in the Dalby (Brigalow Belt South) region, development footprints average 3.5%, so in forested areas, 3.5% of the remnant forest will be cleared. It also creates an average of 208 parcels of land, separated by roads, per 100 km2 (eco logical Australia 2012).
Here, we report on our study, which assessed the response to fragmentation of a focal animal species of conservation significance in the Brigalow Belt of Queensland, the golden-tailed gecko (Strophurus taenicauda). This species is found only in the Brigalow Belt North and Brigalow Belt South bioregions of Queensland and New South Wales, eastern Australia (Brown et al. 2012). The golden-tailed gecko is a mostly arboreal, nocturnal lizard (70 mm snout–vent length) that feeds on a variety of insects and other invertebrates. The species occupies a range of vegetation types, particularly where Acacia harpophylla (brigalow), Casuarina cristata (belah), Allocasuarina luehmannii (bull oak), Eucalyptus crebra (narrow-leaved ironbark) and Callitris glaucophylla (white cypress) are growing (Brown et al. 2012). The species has the conservation status of ‘near threatened’ in the state of Queensland under the Nature Conservation Act 1992. In an assessment of the impact of thinning and logging of white cypress forest on vertebrates, Eyre et al. (2015) found that S. taenicauda was associated with unthinned and unlogged sites. The habitat of the species was associated with increased densities of large live eucalypts, litter cover, dead trees and small live trees. This association, together with the conservation status of the species suggested that it was at risk of population declines in the face of CSG development. Potential impacts from this development include the degradation and loss of habitat, direct mortality from clearing activities and the creation of barriers to movement through the matrix. Strophurus taenicauda was chosen as the focal species over several other potentially impacted candidate species because of its overlap with the broad CSG footprint and its relative ease of detection, which we predicted would make subsequent statistical analysis possible.
We sought to understand how fragmentation influences the occurrence and abundance of S. taenicauda across its range, and whether this exposed it to risks from the activities of a CSG industry. Using a space-for-time approach, we designed a study that assessed both the occurrence of the species in fragments that differed in size, and the relationship between fragment size and presence of white cypress and other dominant tree species on abundance. We predicted that the species would favour areas with continuous vegetation and with a high proportion of white cypress, leaf litter and dead trees.
Materials and methods
Study location
Fieldwork took place in three areas of southern and central Queensland. This region has been heavily targeted for clearing for grazing, mining and other projects since the 1960s; clearing and modification (and their attendant fragmentation) are ongoing and rapid (Accad et al. 2006; Young et al. 1999).
The broad study area encompasses a mix of habitat types, mostly woodland to open forest ecosystems, many of which are characterised by the presence of Acacia harpophylla, from which the bioregion derives its name. As well as A. harpophylla, other significant components of the canopy layer in the particular study areas we targeted include ‘she-oaks’(Casuarina cristata and Allocasuarina luehmannii), ‘eucalypts’ (e.g. Eucalyptus crebra and Corymbia species) and Callitris glaucophylla. Shrubby Acacia species and sparse grasses are common components of the understorey and ground layer.
The climate is generally warm to hot and semiarid (mean minima–mean maxima ~19–34°C) and has average annual rainfall ~642 mm, with a dry season through the winter months.
Survey methods
Survey methods for this study are detailed in full in Pavey et al. (2016). Here we provide an outline of the main approaches used.
Field work was undertaken during February, October and November 2015. These months were chosen because they are typically warm, and geckos are likely to be active and thus detectable by the methods we employed.
Strophurus taenicauda occurs at night mostly on the trunks and outer branches of trees. On occasions it can be found on the ground either amongst leaf litter or ground debris. The preferred diurnal shelter appears to be loose bark on standing trees. Strophurus taenicauda is therefore effectively detected at night using appropriate head torches to detect its ‘eyeshine’. We undertook active searches at night without any habitat destruction (i.e. we did not strip bark or search leaf-litter), so for a gecko to be detected, it could not be hidden deep under bark, or in a burrow. We wanted to avoid methods such as bark stripping to prevent additional disturbance to the species’ habitat.
Each search during the main stratified part of the study was 45 min in duration and involved three observers each with a head torch (Led Lenser H14R, Solingen, Germany). The same three observers undertook all the surveys, helping to reduce detection bias. Further measures undertaken to help reduce detection bias are covered below. For the 45-min period, each observer would gradually diverge from the other observers, to help avoid double counting geckos. Using our methods, detectability does not extend beyond ~30 m, and if, while still close together, two observers saw the same gecko, then it was only counted once. Each observer carried a GPS (Garmin GPSmap 76CSx) during the search period, and tracks were compared after surveys to ensure no overlap between observers occurred.
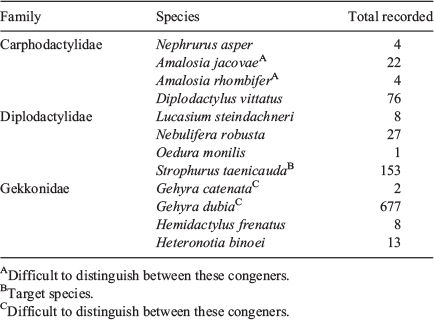
Each gecko observed by eyeshine was identified and its location (±5 m) recorded on the same GPS as above. Where geckos were high up in trees, they were identified using the head torch plus binoculars to discern identifying features. Most gecko species found in the study region are easily identified to species without resorting to scale counts, or other fine morphological features (Wilson 2015). Two pairs of congeners can be difficult to identify (Table 1), but these are easily distinguished from our target species, S. taenicauda, without capture. No attempt was made to identify geckos solely on the nature of their eyeshine.
|
Survey design
Two sets of surveys were undertaken to assess the potential impact of fragmentation on occurrence and abundance of S. taenicauda. The first set of surveys (Study 1 hereafter) involved searches for the species in remnant vegetation of three categories of patch size: small (≤10 ha), medium (10–100 ha) and large (≥100 ha). We carried out a desktop GIS study to identify potentially suitable areas of different sizes in order to stratify our sampling across the three patch size categories. Small and medium remnant patches had to be mapped as being surrounded by a matrix of non-remnant vegetation in order to qualify.
The different sizes for patches were chosen to represent realistic sizes for assessing potential thresholds of impacts for the target species. Specifically, areas ≤10 ha are smaller than the typical size of an ‘island’ created by the matrix of boreholes and access roads within otherwise remnant forest in the study area; areas of 10–100 ha represent ‘islands’ of suitable habitat created by fragmentation from CSG activities, and areas ≥100 ha are realistically able to support stand-alone populations of the target species and potentially have a much-reduced edge-to-area ratio.
Distance between patches was measured in an effort to maintain at least 1 km distance between survey sites to increase likelihood of independence. However, logistic constraints meant that three pairs of sites had minimum distances less than 1 km (see Results).
The desktop study used Regional Ecosystem (RE) and bioclimatic modelling to identify REs in which S. taenicauda may occur within a modelled highly favourable bioclimatic extent. Potentially favourable REs were considered to be those that were mapped as containing species of cypress (Callitris spp.) in the primary RE designation (RE1 column) of Queensland Government’s Regional Ecosystem Description Database (REDD; Queensland Herbarium 2014). Bioclimatic suitability was modelled using MAXENT (Phillips et al. 2006), based on eight climatic variables: (1) annual mean temperature; (2) temperature seasonality; (3) maximum temperature of warmest month; (4) minimum temperature of coldest month; (5) annual precipitation; (6) precipitation of wettest month; (7) precipitation of driest month; and (8) precipitation seasonality at 1-km2 resolution. Thus, a patch had to fall within potentially suitable REs and the modelled high bioclimatic suitability extent in order to qualify. In addition, given our primary interest in investigating the impacts of CSG development on the focal species, sampling sites were only selected if they were located within 15 km of CSG boreholes. Borehole locations were obtained from the Queensland Government (2014), and only those mapped boreholes with ‘COAL SEAM GAS’ or ‘GAS’ in the Results column were considered for proximity to our survey sites.
We stratified sampling across three broad geographic areas within the range of S. taenicauda: southern (approximately between Chinchilla and Miles); central (north of Roma and west of Taroom); and northern (east and south-east of Blackwater and east to Duaringa) (Fig. 1). Three subspecies of S. taenicauda are recognised by Brown et al. (2012). The southern area is within the range of Strophurus taenicauda taenicauda, whereas the central and northern areas are within the range of Strophurus taenicauda albiocularis. Strophurus taenicauda triaureus has a limited range in the central eastern part of the Brigalow Belt and its distribution was not surveyed as part of this study. These three geographic areas have extensive operational and/or exploratory gas drilling, though there are fewer boreholes in the north relative to the central and southern areas (Fig. 1). Survey sites were between 100 m and 11 km from mapped CSG boreholes.

|
In Study 1 we surveyed a minimum of three replicate sites of each patch size category in each of the three geographic areas (i.e. all nine combinations of patch size and geographic area had three replicates except for small patches in the south, which had four replicates). All sites were surveyed twice – once in February 2015 and once in October 2015. Each survey period was carried out over 9–10 nights (3–4 sites surveyed per night). The order in which sites of different sizes were surveyed was varied each night in an effort to prevent interactions between patch size and daily light and weather fluctuations from influencing the results.
The second set of surveys (Study 2 hereafter) sought to understand how the size and isolation of small patches affected occurrence and abundance of S. taenicauda. Study 2 involved searches for the species in patches that were designated as small (i.e. <10 ha) in Study 1, and was undertaken in November 2015. All sites in Study 2 were in the southern geographic region (i.e. within the range of Strophurus t. taenicauda). Nine small sites were surveyed on each of two nights and an additional two small sites on one night. Each of these sites was <4 ha in area except for one (Chinchilla cemetery), which consisted of a few trees that were continuous with the urban area of Chinchilla (i.e. this site did not support a vegetation patch per se). In addition, a large site (156.1 ha) and a medium site (23.01 ha) that were known to be inhabited by S. taenicauda, based on the patch size categories and surveys from Study 1, were surveyed on each of two nights during this period to ensure that ambient environmental conditions during Study 2 were not influencing search success.
Habitat surveys
We recorded a standardised set of habitat variables at each of the sites we surveyed for S. taenicauda. The habitat assessment was based on the methods of Neldner et al. (2012) and is summarised below.
Four disturbance variables were scored on an ordinal scale. These variables and the measurement scales are listed here.
-
Fire frequency. Scored as 0 (≤1 year since last burn), 1 (1–5 years since last burn), 2 (5–10 years since last burn) and 3 (>10 years since last burn).
-
Weed extent. Ranged from 0 (not present) to 3 (widespread).
-
Grazing impact. Ranged from 0 (none) to 3 (high).
-
Erosion extent. Ranged from 0 (none) to 3 (high).
A 100-m line transect was established centrally at each site, and several vegetation structural and floristic variables were measured. These variables were: tree species richness; shrub species richness; basal area of non-cypress trees; and basal area of white cypress. Basal area measurements were undertaken using the Bitterlich stick method at the 0, 50 and 100 m marks on the line transect. Averages of these three measurements were used to compute site-level basal areas for white cypress and non-cypress trees, which were used in the analyses. Five 1-m2 quadrats were established along the 100-m line transects, at 25, 35, 45, 55 and 65 m, and in each of these the following were visually estimated: percentage cover of bare ground; litter; fallen woody vegetation; native perennial grasses; native perennial herbs; native annuals; native shrubs; native trees; exotic herbs and shrubs; and exotic grasses.
In addition, the following landscape-scale spatial variables (or groups of variables) were recorded for each of the survey sites.
-
Patch dimensions. This category included patch size (area in hectares), maximum length (in metres) and minimum width (in metres).
-
Distance to next nearest patch (metres)
-
Proximity (km) to larger patches.
-
Isolation. The length of time since the patch was isolated (only applicable to small and medium-sized patches). This variable was estimated using interpretation of historical aerial photography.
Statistical analysis
All statistical analysis was carried out using the R computing environment (R Core Team 2016).
The relationship between patch size and the abundance of S. taenicauda was assessed using a nested ANOVA. In this analysis, the response variable was the abundance of S. taenicauda and the independent variable was patch size, a categorical variable with three levels (large, medium, small). The random effect was region (South, Central, North) with patch size nested within region. The error term was adjusted to reflect the nested effect of patch size within region. The analysis was carried out with gecko abundance summed across sampling times for the stratified survey (February, October).
As a complement to the above analysis, we also carried out an analysis treating patch size as a continuous rather than a categorical variable. We carried out multiple regression with abundance (log-transformed) of S. taenicauda at each site as the response variable. The independent variables were patch size (ha) and the abundance of a sympatric gecko species, Gehyra dubia (log-transformed). Gehyra dubia was the most abundant gecko at our study sites and overlapped extensively with S. taenicauda (see Results). These two factors led us to include it in our analyses. We then used partial regression coefficients and partial plots to examine the effect of each variable independent of the effects of other variables.
The relationship between habitat variables and the abundance of S. taenicauda was examined using classification and regression tree analysis (CARTs). CARTs are a simple but analytically robust technique of describing variation in a single response variable through the splitting of multiple independent variables using a technique referred to as recursive binary partitioning (De’ath and Fabricius 2000). CART algorithms work by selecting a single explanatory variable (and a value for that variable) that best splits the dataset into two mutually exclusive groups that are most homogenous. This process of splitting the dataset into two mutually exclusive groups is repeated for each sub-group until a threshold is reached. CARTs can handle multiple types of covariates (e.g. ordinal, continuous), collinearity and missing values, and they are relatively simple to construct and interpret. CART modelling can be used for both data exploration and prediction. This approach is valuable, and is used here, because CARTs can often detect patterns that are not obvious from linear modelling.
The independent variables used in our CART analyses were a subset of the habitat variables collected. This subset was based on the assessment of one of the authors (C. Pavey). The ordinal and continuous variables included in the analysis were: fire frequency (ordinal); grazing (ordinal); weeds (ordinal); erosion (ordinal); patch size (ordinal); basal area of non-cypress trees (continuous); basal area of white cypress trees (continuous); percentage fallen woody material (continuous), percentage cover of trees (continuous); % cover of native shrubs (continuous); % cover of litter (continuous); and % cover of bare ground (continuous). The response variable was either the presence/absence (binomial variable) of S. taenicauda, used in classification tree analysis, or the abundance (continuous variable) of S. taenicauda, used in regression tree analysis.
Results
We observed 12 species of gecko, including S. taenicauda, during the surveys (Table 1). The most frequently recorded gecko was G. dubia. It is an arboreal species that is sometimes syntopic with S. taenicauda, but is much more widely distributed and occupies a wider variety of habitat types. The abundance of G. dubia and its extent of overlap with our focal species led to us consider it in our analyses. The rationale for this was that management actions that influence the abundance of G. dubia may potentially have direct or indirect impacts on populations of S. taenicauda.
During the stratified sampling across three geographic regions, S. taenicauda was detected in 40% of small sites, 56% of medium sites and 78% of large sites. During the second field program that targeted only small sites in the south of the range, the species was detected at seven of the 11 (64%) small sites sampled. We recorded 45 individuals of the species during the stratified survey and 99 individuals during the survey of small sites.
The average distance between the nearest pairs of sites was 4.8 km (0.3–18.0 km). Three sites were less than 1 km from their nearest neighbour. There are no studies of movements of individual S. taenicauda. Indeed, there is almost no research of displacement of Australian geckos that is relevant to the scale of our research here. In mark–recapture research, Read (1999), found average maximum displacements of 35–40 m for three species of Diplodactylidae geckos in arid South Australia. He also found a high degree of site fidelity over several years (strong evidence of a ‘home range’), suggesting the geckos he studied did not move far. The geckos Read studied were all terrestrial species, and it is not known whether the scale of movement he reported is relevant to S. taenicauda, which is predominately an arboreal species. However, if Read’s work is applicable to our study species then the minimum distance between pairs of sites in our study of 0.3 km should be sufficient for there to be no or very little movement among sites.
Influence of patch size and abundance of Gehyra dubia on abundance of Strophurus taenicauda
We recorded S. taenicauda across the full range of patch sizes during the two sets of surveys (i.e. Study 1 and Study 2). We located the species in patches as small as 1.11 ha. The species occurred at high abundance in some of these small patches. As an example, 12 and nine individuals were observed during two separate nights of sampling at the 1.11 ha patch in November 2015. Strophurus taenicauda also was common in an area containing isolated groves of trees that was within the urban area of Chinchilla, and within a 3.75-ha vegetation remnant that was enclosed by the town of Chinchilla. At the latter site, 20 S. taenicauda were counted during the 45-min survey on 15 November 2015.
We observed the species in a range of other locations. For instance, we located two individuals in regrowth bordering one of the medium-sized survey patches. At another location, two individuals were located in small trees within the agricultural matrix as we moved from one remnant patch to another. Further, individuals were observed along a roadside strip of white cypress in agricultural land on the edge of the town of Chinchilla during both February and October 2015.
Patch size did not have a statistically significant effect on the abundance of S. taenicauda in Study 1. Specifically, there were no differences in abundance of S. taenicauda (F2,6 = 1.71, P = 0.26) across patches of different size classes, after accounting for the effects of region. The multiple regression model relating the abundance of S. taenicauda to G. dubia abundance and patch size was marginally non-significant (F2, 25 = 3.08, P = 0.06, R2 = 0.13). Examination of partial regression plots revealed that the influence of patch size on S. taenicauda was positive and marginally non-significant (F1, 25 = 3.62, P = 0.07; Fig. 2a), whereas the abundance of G. dubia did not influence S. taenicauda abundance (F1, 25 = 2.54, P = 0.12; Fig. 2b).

|
We examined the influence of both patch size and the abundance of G. dubia on the abundance of S. taenicauda using data from Study 2. The multiple regression model relating the abundance of S. taenicauda to G. dubia abundance and patch size was statistically significant (F2, 7 = 6.01, P = 0.03, R2 = 0.53). Examination of partial plots revealed that the influence of patch size on S. taenicauda abundance was not significant (F1, 7 = 0.52, P = 0.49; Fig. 3a). In contrast, the abundance of G. dubia appears to have a negative influence on S. taenicauda abundance in small patches (F1, 7 = 12.50, P = 0.01; Fig. 3b).

|
To determine if the pattern from the November surveys of small patches (Study 2) was consistent with the overall pattern across the study area, data from only the small sites surveyed during the stratified survey (Study 1) were examined. The multiple regression model relating the abundance of S. taenicauda to the abundance of G. dubia and patch size was marginally non-significant (F2, 5 = 3.81, P = 0.10, R2 = 0.45). Examination of partial plots revealed that the influence of patch size on S. taenicauda was not significant (F1, 5 = 1.42, P = 0.29). In contrast, and as in the case of Study 2, the abundance of G. dubia appears to have a negative influence on the abundance of S. taenicauda (F1, 5 = 6.19, P = 0.055).
Influence of habitat characteristics on presence and abundance of S. taenicauda
For data from the stratified survey (Study 1), a classification tree analysis revealed that the presence of S. taenicauda was influenced by the average basal area (AVE_BA) at the site (Fig. 4a). When AVE_BA was greater than 5.7 m2 ha−1, the likelihood of S. taenicauda presence was ~90%; when below this threshold the likelihood of presence was ~38%. In regression tree analyses that used relative abundance of S. taenicauda (instead of presence/absence) as the response variable, the dominant partition in the dataset was patch size (Fig. 4b). When the patch size exceeded 46 ha, S. taenicauda abundance was 2.46 ± 0.69 individuals/site/night (mean ± s.e.); when patch size was below this threshold, S. taenicauda abundance was 0.73 ± 0.30 individuals/site/night.

|
For data from the survey of small sites (Study 2), a classification tree analysis revealed that the presence/absence of S. taenicauda was influenced equivalently by grazing (Fig. 5a) and the average basal area of white cypress (AVE_BA_Callitris) (Fig. 5b). When grazing was negligible or absent or when average basal area of white cypress was greater than 2.59 m2 ha−1, the chance of presence of S. taenicauda was 100%; when these conditions were not met, the chance of S. taenicauda presence was ~17%. In regression tree analyses that used relative abundance of S. taenicauda (instead of presence/absence) as the response variable, as with the classification tree S. taenicauda was influenced, equivalently, by grazing and average basal area of white cypress at the site. When grazing was negligible or absent or when average basal area of white cypress was greater than 2.59 m2 ha−1, S. taenicauda abundance was 22.75 ± 11.85 individuals/site/night (mean ± s.e.); when these conditions were not met, S. taenicauda abundance was 0.17 ± 0.17 individuals/site/night (Fig. 6).

|

|
Discussion
Our assessment of the persistence of S. taenicauda within landscapes, where the original vegetation is already fragmented and where further fragmentation is occurring, has shown that the species readily occupied small patches of remnant vegetation. Specifically, it was common in small remnant patches (down to 1.11 ha in area) within an agricultural matrix, in remnant patches surrounded by urban development and in linear vegetation along roads. This pattern of occupation of fragments by S. taenicauda appears to be a long-term response, because it is occurring in a landscape that has been fragmented during 150 years of agricultural development.
Recently, it has been argued that the response of a species to the matrix surrounding fragments strongly predicts both the direction (increase or decrease in occurrence) and magnitude of the response to fragmentation (Evans et al. 2017). Strophurus taenicauda provides support for this prediction. The species’ occupation of small fragments of vegetation was matched by its occurrence outside of remnants. Specifically, we located it in isolated trees in parkland within a town, and opportunistically in regrowth and in isolated small trees within the matrix between patches of remnant vegetation.
Although S. taenicauda in our study area was tolerant of habitat fragmentation, it needed key structural components to be present in a fragment for it to occur there. Foremost among these structural components was tree density. This perspective is best represented in our data by the variable average basal area. As average basal area increased, especially above 5.7 m2 ha−1, this species was more likely to be present. An average basal area of 5.7 m2 ha−1 occurs in woodlands of moderate tree density. Such woodlands also have open areas and gaps within them. In small patches, the main factors influencing presence and abundance of S. taenicauda were the average basal area of white cypress and grazing. As average basal area of white cypress increased, the species was more likely to be present (and occur at a higher abundance) in small patches, but this persistence was aided when other stressors to white cypress recruitment (e.g. grazing) were limited.
Our results and conclusions clearly differ from our initial hypothesis that S. taenicauda favours areas with continuous vegetation. Patch size was weakly positively correlated with S. taenicauda abundance; however, this relationship was rarely statistically significant. White cypress has previously been recognised as an important habitat tree for S. taenicauda (Wilson and Knowles 1988; Thompson and Eldridge 2005; Ngugi et al. 2013). In our small patches, we found that S. taenicauda was abundant when average basal area of white cypress was greater than 2.59 m2 ha−1 and when grazing was low or absent. This finding adds to available evidence of the value to biodiversity of regrowth patches of white cypress (Gonsalves et al. 2018). The grazing effect fits with previous observations, summarised in Thompson and Eldridge (2005), that browsing by cattle and sheep and grazing by rabbits restricts white cypress regeneration and damages young seedlings of the species, respectively. Therefore, it appears likely that S. taenicauda occupation of white cypress patches was not influenced by patch size but rather by the condition of individual trees and overall patch condition, highlighting how stressors can interact to impact populations of this species. Our observations of the equivalent influence of average basal area of white cypress and grazing on S. taenicauda abundance suggests that long-term effects of a lack of cypress recruitment could be a factor in our study sites. Unfortunately, our data collection methods do not allow us to tease apart effects of a historic lack of white cypress recruitment from current grazing practice.
Our analysis found a negative correlation between another commonly occurring arboreal gecko, G. dubia, and S. taenicauda abundance, particularly in small patches; because this relationship was uncovered through the course of our study we did not examine it in detail. However, it appears to be a topic worthy of further consideration.
Taken together, our findings characterise S. taenicauda as a species that occupies patches of all sizes if a sufficient density of trees, especially white cypress, is present and if there is no or limited grazing. Although preliminary, our data suggest that the health of remnant patches, rather than size, is a key factor. Grazing had a negative influence on occupancy of small patches by S. taenicauda. Given the degraded status of much of the cypress forests in eastern Australia (Thompson and Eldridge 2005), this is a likely explanation for the patchy distribution of the study species.
Although underappreciated, there is a considerable amount of published research showing that habitat fragmentation can have positive effects on biodiversity (Fahrig 2003, 2017; Fahrig et al. 2019). These positive effects include increased functional connectivity resulting from either a larger number of small patches with smaller distances between them, and/or a higher edge density facilitating the movement of species that preferentially move along edges, increased landscape complementation with increased fragmentation and positive edge effects (Fahrig 2003, 2017). Positive edge effects occur when edges are more productive and structurally diverse than interiors, thus providing higher food availability and lower predation risk. If a species is favoured by edges then it is favoured by fragmentation, because a fragmented landscape contains more edge. Strophurus taenicauda appears to be a species that experiences positive edge effects. It readily occupied fragments with a high edge to interior ratio and often occurred at high abundance in these locations. Additional research that accounts for imperfect detection during surveys using an occupancy modelling approach may shed further light on this pattern.
Conclusion
In terms of assessing the ability of S. taenicauda to persist in the face of habitat fragmentation, our research demonstrates that it regularly occurred outside of continuous vegetation. This ability is likely to have been of prime importance in enabling it to persist despite the widespread habitat fragmentation in the Brigalow Belt since European occupation (Wilson et al. 2002). The species’ occupation of both remnant patches and areas in the matrix leads us to classify it as a species that is resilient to disturbance if certain habitat quality measures are met. As a consequence, it is unlikely to be sensitive to the changes that will result from the development and operation of a CSG industry, based on current practices and approaches of that industry, within its core geographic range.
Conflicts of interest
The authors declare no conflicts of interest.
Declaration of funding
This work was funded by the Gas Industry Social and Environmental Research Alliance (GISERA), project B3. GISERA is a collaborative vehicle established by CSIRO and Australia Pacific LNG to undertake publicly reported research addressing the socioeconomic and environmental impacts of Australia’s natural gas industries.
Acknowledgements
We thank Graeme Bartrim, Senior Environmental Officer at Origin Energy for his support and guidance during the project. The people of central Queensland were very generous in welcoming us in to their part of the world, and we thank them for their interest in the project and for allowing us access to their land.
References
Accad, A., Neldner, V. J., Wilson, B. A., and Niehus, R. E. (2006). Remnant vegetation in Queensland. Analysis of remnant vegetation 1997–1999–2000–2001–2003, including regional ecosystem information. Queensland Herbarium, Environmental Protection Agency, Brisbane, Qld, Australia.APLNG Project EIS (2010). Chapter 8: Terrestrial ecology. In ‘Australia Pacific LNG Project Environmental Impact Statement, Volume 2: Gas Fields’. Available at https://www.aplng.com.au/about-us/compliance/eis.html [verified May 2021].
Baker, M. A., Mazumder, S., Sharma, H., Philpot, J. A., Scott, M. A., and Wittemeier, R. (2012). Well design and well spacing optimisation in unconventional plays. In ‘SPE Asia Pacific Oil and Gas Conference and Exhibition, Perth, Australia, October 2012’. Paper number SPE-159325-MS. (Society of Petroleum Engineers.)
Brittingham, M. C., Maloney, K. O., Farag, A. M., Harper, D. D., and Bowen, Z. H. (2014). Ecological risks of shale oil and gas developments to wildlife, aquatic resources and their habitats. Environmental Science & Technology 48, 11034–11047.
| Ecological risks of shale oil and gas developments to wildlife, aquatic resources and their habitats.Crossref | GoogleScholarGoogle Scholar |
Brown, D., Worthington Wilmer, J., and McDonald, S. (2012). A revision of Strophurus taenicauda (Squamata; Diplodactylidae) with the description of two new subspecies from central Queensland and a southerly range extension. Zootaxa 3243, 1–28.
| A revision of Strophurus taenicauda (Squamata; Diplodactylidae) with the description of two new subspecies from central Queensland and a southerly range extension.Crossref | GoogleScholarGoogle Scholar |
De’ath, G., and Fabricius, K. E. (2000). Classification and regression trees: a powerful yet simple technique for ecological data analysis. Ecology 81, 3178–3192.
| Classification and regression trees: a powerful yet simple technique for ecological data analysis.Crossref | GoogleScholarGoogle Scholar |
Dirzo, R., Young, H. S., Galetti, M., Ceballos, G., Isaac, N. J. B., and Collen, B. (2014). Defaunation in the Anthropocene. Nature 345, 401–406.
eco logical Australia (2012). Assessing the cumulative impact of mining scenarios on bioregional assets in the Namoi Catchment. Development and trial of a GIS tool – NCRAT Version 1. Final Report Version 1. Prepared for Namoi Catchment Management Authority, Gunnedah, NSW, Australia.
Evans, M. J., Banks, S. C., Driscoll, D. A., Hicks, A. J., Melbourne, B. A., and Davies, K. F. (2017). Short- and long-terms effects of habitat fragmentation differ but are predicted by response to the matrix. Ecology 98, 807–819.
| Short- and long-terms effects of habitat fragmentation differ but are predicted by response to the matrix.Crossref | GoogleScholarGoogle Scholar | 27987325PubMed |
Eyre, T. J., Ferguson, D. J., Kennedy, M., Rowland, J., and Manon, M. (2015). Long term thinning and logging in Australian cypress pine forest: changes in habitat attributes and response of fauna. Biological Conservation 186, 83–96.
| Long term thinning and logging in Australian cypress pine forest: changes in habitat attributes and response of fauna.Crossref | GoogleScholarGoogle Scholar |
Fahrig, L. (2003). Effects of habitat fragmentation on biodiversity. Annual Review of Ecology, Evolution, and Systematics 34, 487–515.
| Effects of habitat fragmentation on biodiversity.Crossref | GoogleScholarGoogle Scholar |
Fahrig, L. (2017). Ecological responses to habitat fragmentation per se. Annual Review of Ecology, Evolution, and Systematics 48, 1–23.
| Ecological responses to habitat fragmentation per se.Crossref | GoogleScholarGoogle Scholar |
Fahrig, L., Arroyo-Rodríguez, V., Bennett, J. R., Boucher-Lalonde, V., Cazetta, E., Currie, D. J., Eigenbrod, F., Ford, A. T., Harrison, S. P., Jaeger, J. A. G., Koper, N., Martin, A. E., Martin, J.-L., Metzger, J. P., Morrison, P., Rhodes, J. R., Saunders, D. A., Simberloff, D., Smith, A. C., Tischendorf, L., Vellend, M., and Watling, J. I. (2019). Is habitat fragmentation bad for biodiversity? Biological Conservation 230, 179–186.
| Is habitat fragmentation bad for biodiversity?Crossref | GoogleScholarGoogle Scholar |
Gonsalves, L., Law, B., Brassil, T., Waters, C., Toole, I., and Tap, P. (2018). Ecological outcomes for multiple taxa from silvicultural trimming of regrowth forest. Forest Ecology and Management 425, 177–188.
| Ecological outcomes for multiple taxa from silvicultural trimming of regrowth forest.Crossref | GoogleScholarGoogle Scholar |
Hobday, A. J., and McDonald, J. (2014). Environmental issues in Australia. Annual Review of Environment and Resources 39, 1–28.
| Environmental issues in Australia.Crossref | GoogleScholarGoogle Scholar |
Keinath, D. A., Doak, D. F., Hodges, K. E., Prugh, L. R., Fagan, W., Sekercioglu, C. H., Buchart, S. H. M., and Kaufmann, M. (2017). A global analysis of traits predicting sensitivity to habitat fragmentation. Global Ecology and Biogeography 26, 115–127.
| A global analysis of traits predicting sensitivity to habitat fragmentation.Crossref | GoogleScholarGoogle Scholar |
Neldner, V. J., Wilson, B. A., Thompson, E. J., and Dillewaard, H. A. (2012). Methodology for survey and mapping of regional ecosystems and vegetation communities in Queensland. Version 3.2. Queensland Herbarium, Queensland Department of Science, Information Technology, Innovation and the Arts, Brisbane, Qld, Australia.
Ngugi, M. R., Botkin, D. B., Doley, D., Cant, M., and Kelley, J. (2013). Restoration and management of Callitris forest ecosystems in Eastern Australia: simulation of attributes of growth dynamics, growth increment and biomass accumulation. Ecological Modelling 263, 152–161.
| Restoration and management of Callitris forest ecosystems in Eastern Australia: simulation of attributes of growth dynamics, growth increment and biomass accumulation.Crossref | GoogleScholarGoogle Scholar |
Pavey, C. R., Vanderduys, E., and Raghu, S. (2016). Habitat selection by two focal species; golden-tailed gecko and glossy black-cockatoo. A report to the Gas Industry Social and Environmental Research Alliance (GISERA). CSIRO, Alice Springs, NT, Australia. Available at https://gisera.csiro.au/wp-content/uploads/2018/03/Bio-3-Final-Report.pdf.
Phillips, S. J., Anderson, R. P., and Schapire, R. E. (2006). Maximum entropy modelling of species geographic distributions. Ecological Modelling 190, 231–259.
| Maximum entropy modelling of species geographic distributions.Crossref | GoogleScholarGoogle Scholar |
Queensland Government (2014). Queensland borehole series data set online. Available at https://data.qld.gov.au/dataset/queensland-borehole-series [verified 17 June 2014].
Queensland Herbarium (2014). Regional ecosystem description database online. Available at https://www.qld.gov.au/environment/plants-animals/plants/ecosystems/download [verified 23 February 2015].
R Core Team (2016). ‘R: A Language and Environment for Statistical Computing.’ (R Foundation for Statistical Computing: Vienna, Austria.) Available at https://www.R-project.org/.
Read, J. L. (1999). Longevity, reproductive effort and movements of three sympatric Australian arid-zone geckos. Australian Journal of Zoology 47, 307–316.
| Longevity, reproductive effort and movements of three sympatric Australian arid-zone geckos.Crossref | GoogleScholarGoogle Scholar |
Souther, S., Tingley, M. W., Popescu, V. D., Hayman, D. T. S., Ryan, M. E., Graves, T. A., Hartl, B., and Terrell, K. (2014). Biotic impacts of energy development from shale: research priorities and knowledge gaps. Frontiers in Ecology and the Environment 12, 330–338.
| Biotic impacts of energy development from shale: research priorities and knowledge gaps.Crossref | GoogleScholarGoogle Scholar |
Thompson, W. A., and Eldridge, D. J. (2005). White cypress pine (Callitris glaucophylla): a review of its role in landscape and ecological processes in eastern Australia. Australian Journal of Botany 53, 555–570.
| White cypress pine (Callitris glaucophylla): a review of its role in landscape and ecological processes in eastern Australia.Crossref | GoogleScholarGoogle Scholar |
Wilson, S. K. (2015). ‘A Field Guide to Reptiles of Queensland.’ (New Holland: Sydney, NSW, Australia.)
Wilson, S. K., and Knowles, D. G. (1988). ‘Australia’s Reptiles: a Photographic Reference to the Terrestrial Reptiles of Australia.’ (Collins Publishers: Sydney, NSW, Australia.)
Wilson, B. A., Neldner, V. J., and Accad, A. (2002). The extent and status of remnant vegetation in Queensland and its implications for statewide vegetation management and legislation. The Rangeland Journal 24, 6–35.
| The extent and status of remnant vegetation in Queensland and its implications for statewide vegetation management and legislation.Crossref | GoogleScholarGoogle Scholar |
Yeager, L. A., Keller, D. A., Burns, T. R., Pool, A. S., and Fodrie, F. J. (2016). Threshold effects of habitat fragmentation on fish diversity at landscape scales. Ecology 97, 2157–2166.
| Threshold effects of habitat fragmentation on fish diversity at landscape scales.Crossref | GoogleScholarGoogle Scholar | 27859191PubMed |
Young, P. A. R., Wilson, B. A., McCosker, J. C., Fensham, R. J., Morgan, G., and Taylor, P. M. (1999). Brigalow Belt. In ‘The Conservation Status of Queensland Bioregional Ecosystems’. (Eds P. S. Sattler and R. D. Williams.) pp. 11/1–11/81. (Environmental Protection Agency: Brisbane, Qld, Australia.)