

Implementation of an occupancy-based monitoring protocol for a widespread and cryptic species, the New England cottontail (Sylvilagus transitionalis)
Colin P. Shea A D E , Mitchell J. Eaton B and Darryl I. MacKenzie C
A Department of Applied Ecology, 127 David Clark Labs, North Carolina State University, Raleigh, NC 27695, USA.
B Southeast Climate Adaptation Science Center, U.S. Geological Survey, 127H David Clark Labs, North Carolina State University, Raleigh, NC 27695, USA.
C Proteus, PO Box 7, Outram 9062, New Zealand.
D Present address: Florida Fish and Wildlife Conservation Commission, Florida Fish and Wildlife Research Institute, 100 8th Avenue Southeast, St Petersburg, FL 33701, USA.
E Corresponding author. Email: Colin.Shea@myfwc.com
Wildlife Research 46(3) 222-235 https://doi.org/10.1071/WR18058
Submitted: 29 March 2018 Accepted: 23 January 2019 Published: 10 April 2019
Journal Compilation © CSIRO 2019 Open Access CC BY-NC-ND
Abstract
Context: Designing effective long-term monitoring strategies is essential for managing wildlife populations. Implementing a cost-effective, practical monitoring program is especially challenging for widespread but locally rare species. Early successional habitat preferred by the New England cottontail (NEC) has become increasingly rare and fragmented, resulting in substantial declines from their peak distribution in the mid-1900s. The introduction of a possible competitor species, the eastern cottontail (EC), may also have played a role. Uncertainty surrounding how these factors have contributed to NEC declines has complicated management and necessitated development of an appropriate monitoring framework to understand possible drivers of distribution and dynamics.
Aims: Because estimating species abundance is costly, we designed presence–absence surveys to estimate species distributions, test assumptions about competitive interactions, and improve understanding of demographic processes for eastern cottontails (EC) and New England cottontails (NEC). The survey protocol aimed to balance long-term management objectives with practical considerations associated with monitoring a widespread but uncommon species. Modelling data arising from these observations allow for estimation of covariate relationships between species status and environmental conditions including habitat and competition. The framework also allows inference about species status at unsurveyed locations.
Methods: We designed a monitoring protocol to collect data across six north-eastern USA states and, using data collected from the first year of monitoring, fit a suite of single-season occupancy models to assess how abiotic and biotic factors influence NEC occurrence, correcting for imperfect detectability.
Key results: Models did not provide substantial support for competitive interactions between EC and NEC. NEC occurrence patterns appear to be influenced by several remotely sensed habitat covariates (land-cover classes), a habitat-suitability index, and, to a lesser degree, plot-level habitat covariates (understorey density and canopy cover).
Conclusions: We recommend continuing presence–absence monitoring and the development of dynamic occupancy models to provide further evidence regarding hypotheses of competitive interactions and habitat influences on the underlying dynamics of NEC occupancy.
Implications: State and federal agencies responsible for conserving this and other threatened species can engage with researchers in thoughtful discussions, based on management objectives, regarding appropriate monitoring design to ensure that the allocation of monitoring efforts provides useful inference on population drivers to inform management intervention.
Additional keywords: co-occurrence models, lagomorphs, species distribution models, Sylvilagus transitionalis, wildlife management.
Introduction
The New England cottontail (Sylvilagus transitionalis; NEC) is the only lagomorph species endemic to the north-eastern United States. The species, which is known to prefer early successional habitat with abundant and dense brushy habitat, is generally associated with land-cover conditions characterised by regenerating forests between 5 and 20 years post-disturbance (Barbour and Litvaitis 1993; Litvaitis et al. 2003). In recent decades, early successional habitats in New England have become increasingly uncommon and more highly fragmented because of a combination of factors, including urban development, succession of old agricultural fields into mature forest following farm abandonment, and forest regeneration (Litvaitis 1993; Lorimer and White 2003). In response to these habitat changes, the range of the NEC has declined commensurately, with a current distribution ~15% of its peak in the mid-1900s (Litvaitis et al. 2006; Tash and Litvaitis 2007). The decline of NEC populations has been largely attributed to habitat loss and fragmentation, but the early-20th Century introduction and subsequent establishment throughout New England of a potential competitor, the congeneric eastern cottontail (S. floridanus; EC), may also have played a role (Probert and Litvaitis 1996; Smith and Litvaitis 2000). Today, the NEC is considered a species of special concern in six of seven historically occupied states (Connecticut, Massachusetts, Maine, New Hampshire, New York and Rhode Island; populations are presumed extirpated from Vermont), and the species was placed under consideration as a candidate for federal protection under the Endangered Species Act in 2006 (U.S. Fish and Wildlife Service 2015). Despite substantial management and research focus on habitat loss as a primary driver of the species’ decline, uncertainty remains regarding the relative influence of specific habitat conditions on NEC population dynamics, as well as possible interactive effects with introduced EC populations. Incomplete knowledge of how these factors contribute to NEC population dynamics and distribution has complicated the development of management strategies to promote species recovery.
Management strategies aimed at addressing drivers of species distributions and dynamics would benefit from the implementation of a cost-effective, range-wide monitoring program that combines the effort of multiple state and federal agencies. Previous undertakings to monitor the status and dynamics of NEC populations have been extensive and variously implemented at local, state, and range-wide scales. In the early 2000s, state and federal agencies conducted presence–absence surveys throughout much of the NEC’s range, the results of which indicated substantial declines in abundance and distribution relative to the species’ status in the mid-20th Century (Litvaitis et al. 2006; Tash and Litvaitis 2007). A decentralised collection of state-specific monitoring programs has continued since that time, resulting in a long-term dataset that provides information on the range-wide status and distribution of NEC. These monitoring activities complement a recently developed conservation strategy (Fuller and Tur 2012) that specifies numerous state and federal management priorities, including the need to collect information on the status and contemporary range-wide distribution of EC and NEC populations. However, there has been limited coordination of monitoring objectives among participating states and agencies, resulting in highly variable survey designs and a limited collection of systematic, site-level habitat information. Although the issue of incomplete detection has received some attention in recent years (Brubaker et al. 2014), little effort has been made to account for false negative detection of EC and NEC during sampling and the associated introduction of bias when assessing the importance of variables on species-distribution estimates (MacKenzie et al. 2018). Combined, these factors have promoted the desire to develop a collaborative, systematic and strategic monitoring protocol that will provide the data necessary for assessing the range-wide status and dynamics of NEC populations.
Monitoring NEC status and dynamics poses several challenges. First is the species’ dependency on transitional habitat occurring in increasingly fragmented landscapes across a broad geographic area. Characterising currently suitable habitat and predicting its extent and spatial configuration has proven difficult; hence, managers and biologists have struggled with the design of an efficient and statistically valid monitoring program that can reliably identify and select appropriate survey sites a priori. One consequence of this challenge is that past survey efforts were either inadvertently allocated to unsuitable habitat or disproportionally allocated to areas of known or historic occurrence under the pretence of monitoring patch status. Both conditions are problematic, the former being inefficient for state agencies with limited monitoring resources and the latter representing a form of biased sampling (i.e. inference cannot be extended beyond those habitat conditions found at the known-occupied localities) as well as being less likely to document colonisation events if patch turnover rates are low. Second, although many agencies would prefer to use species abundance or density as a state variable for management purposes, collecting these data at a sufficient number of sampling locations for use with mark–recapture or other models is often cost prohibitive. In addition to logistical considerations, estimating NEC abundance is challenging because (1) EC and NEC are morphologically very similar, which makes field identification of even trapped individuals unreliable, and (2) EC and NEC sign, including faecal pellets and tracks, are virtually indistinguishable in the field. Therefore, identifying individuals for use in mark–recapture or count-based models requires the use of precise genetic (microsatellite) markers that pose significant annual laboratory costs. An additional challenge for monitoring NEC populations is their cryptic nature and tendency to occupy dense, brushy habitat that hinders even indirect detection. Given these challenges, an alternative to previous monitoring methods is to use occupancy (i.e. presence or absence of species from a collection of sampling units) as a practical and informative state variable that may represent a more cost-effective approach to address certain questions relevant to management (MacKenzie et al. 2002). Although estimating occupancy of EC and NEC is complicated by the fact that species identification can be achieved only via genetic means (mtDNA analysis; Kovach et al. 2003), carefully designed faecal-pellet surveys can be combined with occupancy models to test hypotheses about habitat affinities, species co-occurrence and interactions, and patch connectivity and metapopulation processes. Ultimately, the appropriate state variable by which agencies evaluate the status of a species should be determined by the specific management question(s) and embedded within a management plan to determine what information is needed to make informed decisions about species recovery actions (Lyons et al. 2008; Lindenmayer et al. 2012).
With the support of the U.S. Fish and Wildlife Service and state partners, we developed and implemented a new monitoring protocol that balanced the need for robust inferential data required to address long-term management interests, with the practical considerations of limited resources available for monitoring a widespread and locally rare species. We designed monitoring guidelines to provide needed information for managers and biologists to assess the contemporary status of NEC populations throughout their range, as well as collect relevant data for understanding the underlying mechanisms that drive species dynamics. Using data collected from the first year of monitoring under this new protocol, our specific objectives were to develop a suite of occupancy models to (1) assess support for the hypothesis that co-occurrence with EC can affect NEC occupancy, (2) quantify the influence of site-level physical habitat conditions on NEC occurrence, (3) use best-approximating occupancy models from Objective 2 to predict unconditional NEC occupancy probabilities at unsurveyed locations and (4) apply the results from the first year of data collection to refine site-selection procedures and improve monitoring efficiency through better allocation of survey effort.
Materials and methods
Study area
The present study was conducted throughout much of the known historical (~1960) and contemporary range of the New England cottontail in the north-eastern United States, including the Hudson Valley in New York (NY), all of Connecticut (CT), Massachusetts (MA) and Rhode Island (RI), southern New Hampshire (NH), and southern Maine (ME). Because of the size of the region, research and agency personnel have been limited in their ability to monitor thoroughly across the known NEC range. Prior to the present study, state and federal partners designated ‘focus areas’ in each state, which collectively represented the total area over which these agencies would consider implementing management and conservation activities (Fig. 1). For the present study, state and federal agencies further reduced the sampling frame by creating a ‘survey zone’ that designated, within each focus area, a 5-km buffer surrounding all recent historical (2009–2014) NEC detections. We acknowledge a certain degree of circular reasoning in defining the survey zone on the basis of recent, known NEC occurrences, as the occurrence records were a product of the previous surveys; hence, their use in delineating our survey zone excluded previously unsurveyed areas. Although this situation is not ideal for robust inference about range-wide NEC population dynamics, an important practical consideration of the survey design was to balance available sampling effort for the various agencies tasked with implementing the monitoring. Thus, we felt that it would be beneficial from a logistical standpoint to focus survey efforts on areas that were at least somewhat likely to support NEC populations. By reducing the effective size of each focus area, the creation of the survey zone helped minimise logistical challenges associated with large distances among survey locations while retaining a large portion of the respective ranges of EC and NEC throughout New England. However, this decision limited our inferences for estimating and predicting NEC occurrence to the defined survey zone (MacKenzie et al. 2018).

|
Site selection
We selected sampling locations (hereafter, plots) from within the survey zone in each of the six represented states (Connecticut, CT; Massachusetts, MA; Maine, ME; New Hampshire, NH; New York, NY; and Rhode Island, RI) for the 2015–2016 survey season, spanning December–April. Once the survey zone had been established, each state randomly selected survey plots from within the zone (124 total plots), with plot allocation across the region based on the available monitoring capacity as reported by each state. We designated a plot size of 200 m × 200 m (~4 ha), selected because this was considered large enough to support full or partial home ranges of one or more individual cottontails (Trent and Rongstad 1974; 0.85–4.0 ha; Barbour and Litvaitis 1993; 2.5–5.0 ha), while being small enough to survey efficiently in a few hours. For plot selection within the survey zone, each state agency underwent the following process: the survey zone was divided into four strata (although some states used fewer than four) on the basis of distance (0.5, 1, 3 and 5 km) from a known, historical NEC occurrence. On the basis of the amount of effort (number of surveys and sites) each state anticipated putting forth during the coming field season, GIS coordinates representing plot locations were then randomly selected within each of the four strata. To ensure reasonably good spatial coverage of plots throughout the survey zone, and to minimise favouring sites closer to known-occupied areas, each state allocated ~20%, 20%, 40% and 20% of their total available survey effort to the 0.5-km, 1-km, 3-km and 5-km zones respectively. Survey crews were permitted to use the randomly selected plot coordinates as any corner of the 200 m × 200 m plot, to adjust for factors such as local habitat conditions (i.e. avoiding large waterbodies) and access restrictions. Each state randomly selected more sites than was necessary, which enabled them to omit a plot if it was determined to be infeasible or unsuitable (i.e. was mostly open water or other uninhabitable areas), or if access was not permitted by the land owner and the plot boundaries could not be shifted as described above. In cases where a plot was omitted, crews moved onto the next randomly selected plot on their list until a suitable location was found.
Faecal-pellet sampling
Before conducting a survey, surveyors delineated 10 transects within each plot. Generally, five transects were oriented in a north–south direction and the other five were oriented east–west, with ~30 m between transects. Surveyors could choose between conducting one or two surveys during a single site visit (i.e. day). For site visits where a single survey was conducted (~40% of site visits), one set of five transects was randomly selected for sampling during that occasion, and the other set of five transects was randomly selected for sampling during a subsequent site visit (i.e. another day). For site visits where two replicate surveys were conducted, one surveyor randomly selected one set of five transects, and another surveyor sampled the other set. Surveying a plot in this manner meant that two independent pellet surveys could be conducted at the same plot on the same day. The ability to conduct multiple surveys on a single day was beneficial because (1) it substantially reduced the logistical costs of monitoring, and (2) it provided replicate survey data required for estimating species detection probabilities in occupancy models. We assumed that pellet-detection skills did not differ among observers and that rabbits were distributed randomly with respect to transects locations (i.e. if NEC or EC were present anywhere within a plot, faecal pellets deposited by individuals representing either species were available for detection by both surveyors). During sampling, each surveyor covered the full extent of the plot by traversing their respective set of five transects, making every attempt to search all available habitats and collect pellets from all encountered pellet piles (i.e. clusters of pellets) within 15 m of either side of their respective transect routes. Pellets were sampled at a minimum of 30 m apart to increase the opportunity of detecting each species, if present, and to reduce the chances of collecting pellets from the same individual rabbits, thereby minimising the costs associated with mtDNA analyses. Additionally, on encountering pellets that were likely from the same individual (i.e. an isolated collection of pellets), surveyors collected only enough pellets required for genetic analysis (at least 3) such that some pellets remained available for detection by the other surveyor, in the event that the transects overlapped. All collected pellets were georeferenced and stored in individually labelled vials that identified the plot, surveyor and date of sampling. Whenever possible, this process was repeated on a different day within the December–April survey season, with the intention of conducting a maximum of four replicate surveys per plot. We further assumed that the occupancy status for either species remained constant among survey events.
Field-measured, plot-level covariates
For each transect, surveyors used their judgment to select one to three points, depending on habitat heterogeneity, that best represented the dominant understorey (to a maximum height of ~3 m) and the extent of canopy cover. In cases where more than one distinct habitat type was present along a given transect and it was not possible to identify a single representative point, measurements were taken in each habitat type. For each point, surveyors recorded GPS coordinates and visually assessed understorey and canopy conditions within a 15-m radius according to the following five vegetation cover classes: (1) 0–5%, (2) 5–25%, (3) 25–50%, (4) 50–75% and (5) 75–100%. Understorey and canopy conditions were not measured during each plot visit; however, over the course of the entire sampling season, surveyors recorded understorey and vegetation conditions on at least two sets of perpendicular transects to obtain representative samples for generalising habitat conditions within a plot. For each plot, we then summarised the understorey and canopy conditions by averaging measurements across all points, with possible values ranging from 1 (very low understorey density or canopy cover) to 5 (very high understorey density or canopy cover). We hypothesised that NEC occupancy would be positively related to both understorey and canopy cover.
Field-measured, survey-level covariates
During each survey occasion, field crews measured several survey-specific covariates on the basis of a priori beliefs and previous research (Brubaker et al. 2014) about those factors that were most likely to influence detection probability. These included air temperature (Temp), the presence of hardpack on the snow surface (HP), the snow depth in cm (Snow), the number of days since the last snowfall event (Dsnow), and the number days since the last high-wind event (Dwind). Temp, Dsnow and Dwind were represented by a single measurement for each site visit, whereas HP and Snow were measured at multiple representative locations along each of the five transects surveyed by a given observer. Similar to understorey and canopy-cover conditions, observers used their judgment to select one to three points along each transect that best represented the HP and Snow conditions. Snow was a continuous covariate representing the average snow depth across all points for each survey occasion, whereas HP was a binary variable indicating the presence (HP = 1) or absence (HP = 0) of hardpack at any measurement point on a given survey occasion. We hypothesised that cottontail detectability would be reduced by the presence of hardpack and snow depth and positively related to temperature and time since wind and snowfall events.
Remotely sensed and habitat suitability indexed, plot-level covariates
To predict the probability of NEC occupancy more broadly (i.e. status within the full survey zone across its range), as well as identify promising new areas for surveys or restoration activities, we required a means to obtain habitat covariates for sites that were not directly observed through the monitoring program. On the basis of a priori considerations of cottontail response to habitat cover, we combined 2011 National Land Cover Database (NLCD; Homer et al. 2015) data for each plot into the following five general land-cover classes: Agricultural (Ag: pasture, hay or cultivated crops), Developed (Dev: open space, low intensity, medium intensity, high intensity or barren land), Forested (For: deciduous, evergreen or mixed forest), Shrub–Grassland (SG: shrub, scrub or grassland), and Wetland (Wet: emergent herbaceous or woody wetlands). We then created land-cover covariates by calculating the proportion of each of the five land-cover classes in each plot. We explored several options for expressing our land-cover classes as model covariates, including a log-ratio transformation of the proportions (which summed to 1 in each plot) and the use of a binary variable to indicate the dominant land-cover class in each plot. Ultimately, we classified the status of each land-cover class in each plot as a binary covariate that took a value of 1 if a given land-cover class covered >33% of a plot, and 0 otherwise (hereafter, Ag33, Dev33, For33, SG33 and Wet33). Using a 33% threshold allowed for more than one land-cover class to be represented as plot-level covariates, while eliminating the constraint, and associated difficulties with interpretation of parameter estimates, imposed by land cover-class proportions summing to 1 within each plot. Next, we created a GIS layer representing ‘suitable habitat’ by delineating polygons within the survey zone based on the intersection of two or more of the following environmental GIS layers: existing conservation lands, managed public lands, historical NEC records (2009–2014) and forested areas that intersected with wetlands. For each surveyed plot, we then summarised this continuous variable as the proportion of suitable habitat (hereafter, PropSuitable) within each plot, such that PropSuitable = 0 if no suitable habitat was present and PropSuitable = 1 if the entire plot was suitable habitat.
We hypothesised that NEC occupancy would be positively related to the proportion of suitable habitat and wetland habitat. We generally hypothesised that NEC occupancy would be positively related to forested habitat, but we recognised the limited precision of NLCD in being able to distinguish between early successional and mature forests; the former, we hypothesised, would be positively related to occupancy, whereas the latter would be negatively related. Similar to forested habitat, issues of partial observability of remotely sensed habitat covariates are likely to contribute to imprecision in defining and testing hypothesised relationships for other land-cover predictors. We further predicted that NEC occupancy would be negatively related to plots containing significant (>33%) amounts of developed, shrub, grassland or agricultural habitat, primarily because these areas tend to lack dense, brushy habitat suitable for cover, which may render rabbits more prone to predation. However, we note that agricultural habitat identified by NLCD could represent both active and idle agricultural lands, which we hypothesised would be negatively and positively related to NEC occupancy respectively. Last, plots associated with developed land may also be influenced by human-induced dispersal corridors, such as roads and power line rights-of-way, which we hypothesised may render some areas more likely to support NEC.
Hypothesis testing, model fitting and model selection
We had three primary modelling objectives. First, we evaluated support for the hypothesis that the presence of EC influences the probability of NEC occupancy. Second, we tested the effect of several survey-level covariates on NEC detection probability. Third, we assessed the influence of plot-level physical habitat conditions (land cover, canopy cover, and understory vegetation) on NEC occupancy. We used two-species (co-occurrence) occupancy models for our first objective, hypothesising a priori that the presence of EC has a negative effect on NEC occupancy. Single-species occupancy models were used to test covariate parameters for both occupancy and detection probabilities for Objectives 2 and 3.
Two-species occupancy models
We first constructed two-species occupancy models (MacKenzie et al. 2004) to evaluate the hypothesis that EC presence negatively influenced the probability of NEC occupancy. Using a conditional occupancy parameterisation of the two-species model (Richmond et al. 2010), we assumed that EC was the dominant species and NEC was subordinate (i.e. the probability of NEC occurrence was modelled as conditional on the presence of EC). The global co-occurrence model contained three intercepts for the occupancy parameter, namely, one for EC, one for NEC in the presence of EC and one for NEC in the absence of EC. This model included eight site-level covariates (Ag33, Dev33, For33, SG33, Wet33, Canopy, Understorey, and PropSuitable) associated with each occupancy parameter, meaning that the influence of site-level covariates differed for each occupancy intercept. The global model also included five survey-level covariates in the detection component (HP, Snow, Temp, Dsnow, and Dwind); for simplicity, we assumed that although detection probability could differ between species, the presence of EC did not influence the detection of NEC. We fit four additional models by varying occupancy-related model parameters, for a total of five candidate models for hypothesis testing (Table 1). We ranked the five alternative models by using Akaike’s information criterion with a small-sample bias adjustment (AICc; Hurvich and Tsai 1989) and assessed the relative support for each model by calculating Akaike weights, which range from 0 to 1, where the best-approximating model had the highest weight. We calculated the effective sample size for AICc as 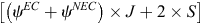 , where ψEC and ψNEC represent the mean conditional occupancy of EC and NEC respectively, and J represents the total number of surveys conducted across S survey plots. Last, for models that did not assume that EC and NEC occurred independently, we assessed the level of co-occurrence between species following MacKenzie et al. (2018), by calculating an odds-ratio-based species interaction factor (SIF) as:
where ψNEC represents the probability of NEC occurring in the presence of EC and ψNec denotes the probability of NEC occurring in the absence of EC. Species interaction factors close to 1.00 indicate no interaction between species, whereas species interaction factors <1 or >1 indicate avoidance and attraction respectively. The standard error and 95% confidence interval for the SIF estimate were calculated via the delta method, by using the ‘msm’ package in R (Jackson 2011). All two-species occupancy models were fitted using Presence v. 12.6 (Hines 2006).

|
Single-species occupancy models
The two-species occupancy model described above could have been used to assess the influence of various physical habitat covariates on EC and NEC occupancy. However, two-species models can be data intensive and are more complex than required, given our second objective of assessing the influence of habitat conditions on NEC occupancy. Determining, from the co-occurrence models, that the data do not support a strong influence of EC on NEC presence (see Results) provided justification to employ single-species occupancy models to address this objective. We first developed a global model for NEC that contained all eight occupancy covariates and all five detection covariates. Holding the occupancy component as fixed, we began by fitting 32 models representing all combinations of the five detection covariates (excluding interactions). Prior to model-fitting, we assessed Pearson correlations between all pairs of predictor variables and did not include predictor variables with correlation coefficients (r2) of >0.25 in the same model (no correlations among predictor variables exceeded this threshold). We then ranked their relative plausibility by using AICc and identified the best-approximating detection model as the one with the lowest AICc score. Using the best-approximating detection model, our final step was to fit eight candidate models representing all combinations of Land Cover, PropSuitable and Canopy–Understorey occupancy covariates, again excluding interactions. To reduce the total number of candidate models, we grouped covariates on the basis of the following three general categories: Land Cover, PropSuitable and Canopy–Understorey. For example, models that included Land Cover always included all five land-cover covariates, whereas models that included Canopy–Understorey always included both Canopy and Understorey. We used AICc to identify our 95% confidence set of models; the set of highest-ranked models that has a summed AICc weight of 0.95 (Burnham and Anderson 2002). For model selection, we calculated the effective sample size for AICc as
where ψNEC represents the mean estimated NEC-occupancy probability, and J represents the total number of surveys across S survey plots. We based all inferences on estimated effect sizes for predictor variables from the confidence model set and considered strong evidence of this effect if the 95% confidence interval of a parameter did not overlap zero. To facilitate interpretation, we calculated odds ratios (OR) for each parameter estimate. All single-species occupancy models were fitted in R v. 3.2.4 (R Core Development Team 2016), by using the package ‘unmarked’ (Fiske and Chandler 2011).
Occupancy prediction at unsurveyed plots
Because of management-agency interest in the distribution and dynamics over the full extent of the NEC, and the small proportion of this extent that could be monitored, an important component of our study was to predict NEC occupancy at locations within the survey zone that have never been surveyed. To accomplish this, we used a fishnet procedure in ArcGIS v.10.4.1 (ESRI 2016) to construct a 200 m × 200 m grid over the entire spatial extent of the current NEC range encompassed by the survey zone delineated for the present study (Fig. 1). Constraining the spatial extent of the grid to the existing survey zone (described above) was done for consistency with our definition of the area of inference and with the ongoing survey effort allocation and monitoring activities by the management agencies. Restricting the grid area also served to reduce the total number of available sampling plots from >1 million to ~142 422, which we regarded as sufficiently representative of NEC habitat. We excluded an additional 10 064 plots that intersected the perimeter of the survey zone and, hence, were not complete 200 m × 200 m plots, resulting in a final total of 132 358 200 m × 200 m plots. For each of the 132 358 plots, the 2011 NLCD land-cover characteristics were extracted and the land-cover classes summarised as described above to match the covariates used in the single- and two-species occupancy models. The proportion of suitable habitat (PropSuitable) within each of these plots was also calculated. To account for model-selection uncertainty (Burnham and Anderson 2002), we then calculated model-averaged unconditional NEC-occupancy probability for each plot by averaging (AICc-weighted) occupancy predictions based on the 95% confidence set of single-species models that included only remotely sensed covariates (i.e. those models that did not include Canopy–Understorey). Finally, we stratified plots into three categories on the basis of the lower limit of the 60% confidence intervals (Gerrodette et al. 2002; Hammill and Stenson 2003; Runge et al. 2009; Wade 1998) of the predicted occupancy probabilities: low (<0.05), moderate (0.05–0.25) and high (>0.25). Our rationale for using the lower limit of the 60% confidence interval was two-fold, as follows: (1) to prevent overstating the influence of habitat suitability (PropSuitable) in the selection of plots; and (2) to account for imprecision of Land Cover effects estimated from the 2015–2016 survey data.
Results
Field crews surveyed 124 plots during the 2015–2016 season and detected at least one cottontail species in 45 plots; EC were detected at 33 plots, NEC were detected at 21 plots, and both species were detected at nine plots. Survey effort varied among plots, averaging three occasions and ranging from one to six occasions. Across all 124 plots, 14 were surveyed on one occasion, 28 on two occasions, 19 on three occasions, 61 on four occasions, one on five occasions and one on six occasions. Surveyed plots were generally representative of the designated survey zone. Comparing 124 surveyed plots with 132 358 plots that comprised the NEC survey zone, the proportion of survey plots containing at least one-third of a given land-cover type were as follows (expressed as the proportion of survey plots followed by the proportion of survey zone; the totals for each exceeding 1.0 because a plot can contain >1 land-cover type that exceeds 0.33): Agricultural (0.04/0.12), Developed (0.07/0.14), Shrub–Grassland (0.15/0.02), Wetland (0.28/0.12) and Forested (0.70/0.73). Approximately 7% of the survey zone contained at least some suitable habitat, with the proportion of suitable habitat averaging <0.01 (range: 0–1.00), whereas surveyed plots contained an average of 0.05 suitable habitat (range: 0–0.76).
Two-species occupancy models
The best-approximating two-species occupancy model suggested that EC and NEC occupancies were independent (i.e. no interaction between EC and NEC) and that the occupancy-related covariate effects did not differ between species (Table 1). This model was 1.52, 1.68, 2.13, and 2.46 times more plausible than second-, third-, fourth- and fifth-best approximating models respectively (Table 1). The estimated SIF, on the basis of parameter estimates from the second-best approximating model, indicated that NEC were on average, 1.90 times more likely to occur at a location when EC were also present. However, the 95% confidence interval for the SIF estimate (lower CL = 0.64, upper CL = 5.64) overlapped one, indicating that although there was some evidence that the species were more likely to occur together, there was considerable uncertainty regarding the magnitude and nature of co-occurrence interactions between EC and NEC.
Single-species occupancy models
On the basis of AICc weights for the candidate set of 32 detection models, there was substantial model-selection uncertainty, with the top two models receiving equivalent support (w = 0.11 and w = 0.10 respectively). Both models contained the covariate Dwind and differed only by inclusion of Snow in the detection model. The parameter estimate from the top model indicated that for every additional day following a high-wind event (>40 km h−1), NEC were ~1.30 times more likely to be detected, given they were present in a plot (Fig. 2). The second highest-ranked model suggested a negative relationship between detection and snow depth, with a coefficient estimate of –0.05 for Snow (95% CI, –0.11 to 0.01; Fig. 3). That the 95% confidence interval for Snow contained zero may explain why this model did not receive more support. Given their equivalent support, we selected the simpler of the top two models for inclusion in subsequent model fitting to assess the relative support for the influence of land-cover covariates, suitable habitat and canopy and understorey densities on NEC occupancy. On the basis of the top model, the per occasion detection probability in the present study was moderately high, with predicted probabilities averaging 0.76 (study-wide average of 3.44 days following a high-wind event), and ranging from 0.53 (0 days following a high-wind event) to 0.99 (>16 days following a high-wind event; Fig. 2).

|

|
Using the best-approximating detection model, the 95% confidence set of single-species occupancy models included six of the eight candidate models, with the best-approximating model including Land Cover and PropSuitable (Table 2). Parameter estimates from the best approximating model containing PropSuitable indicated that NEC were substantially more likely to occupy plots with higher amounts of suitable habitat as defined by this composite variable (Fig. 4). The scaled odds ratio for PropSuitable indicated that NEC were 1.68 times more likely to occupy a given plot for every 10% increase in suitable habitat. With regards to Land Cover, NEC were 14.08 times more likely to occupy plots that contained at least 33% agricultural (Ag33) land cover (Table 3, Fig. 4). Similarly, NEC were 6.04 times more likely to occupy plots that contained at least 33% developed (Dev33) land cover, although the 95% confidence interval for this parameter minimally overlapped zero (Table 3, Fig. 4). In contrast, parameter estimates indicated that NEC were substantially less likely to occupy plots that contained at least 33% Shrub–Grassland (SG33) land cover (Table 3). We note that the strongly negative parameter estimate and large standard error associated with SG33 resulted from complete separation, because NECs were never detected in any plot that had at least 33% Shrub–Grassland land cover. The large, negative value reflects an occupancy estimate that is very near zero when Shrub–Grassland cover is >33%. The logit-link function is very flat at such extreme values, resulting in a large standard error. While the results appear unusual, they do not necessarily indicate a lack of convergence for this parameter and, under such circumstances, estimation of other model parameters is unaffected; hence, we retained the SG33 predictor variable. Parameter estimates for the remaining covariates, namely Understory, Canopy, For33 and Wet33, provided little evidence that these were strong predictors because their 95% confidence intervals considerably overlapped zero.

|

|

|
Grid predictions
Across all 132 358 200 m × 200 m plots, the unconditional, model-averaged predicted mean NEC-occupancy probability was 0.20 and ranged from 0.02 to 0.90, whereas the lower 60% confidence limit (on which plots are assigned to low, medium and high strata) averaged 0.13 and ranged from 0.00 to 0.61. On the basis of the lower 60% confidence-limit threshold, ~2% (2590) of plots were estimated to be in the low stratum (<0.05), 85% (112 812) in the moderate stratum (= 0.05–0.25) and 13% (16 956) in the high stratum (>0.25; Fig. 1).
Discussion
Wildlife agencies charged with conserving NEC populations are faced with a challenging task, namely, management of a cryptic species over a large geographic region in the face of limited monitoring resources. Range-wide monitoring of NEC populations poses an additional and somewhat unique challenge in that the species co-occurs with a potential competitor and congener that is distinguishable only by means of genetic analysis. Combined, these challenges present significant barriers to the development of a cost-effective, long-term monitoring program that provides the data necessary for assessing the predominant factors influencing the status and dynamics of NEC and EC populations and, ultimately, informing management decisions. Through close collaboration with multiple state and federal agencies, we have assisted with the identification of explicit objectives to develop and implement a standardised monitoring program that, through time and combined with an occupancy-modelling framework, will provide the data suitable for assessing the status, dynamics and competitive interactions of EC and NEC populations within the area encompassed by the sampling frame. The ability to test hypotheses related to species interactions and habitat-occupancy relationships will allow managers to select the most appropriate recovery actions at the patch level, so as to maximise the likelihood of longer-term persistence. Monitoring species response to habitat management, subsequent vegetation succession, and the status of potential competitors will provide critical feedback on the effectiveness of management policies to achieve desired population objectives.
On the basis of analysing the spatial patterns of EC and NEC occurrence across 124 plots, we did not find strong evidence that NEC occurrence was influenced by the presence of EC. Although both species use similar habitats and foods, EC are generally regarded as a larger-bodied species with more generalised habitat preferences than NEC (Litvaitis et al. 2008). Eastern cottontails, therefore, may be behaviourally dominant and either evict NEC from sites where the species co-occur (i.e. increase local extinction probability) or reduce the ability of NEC to colonise previously unoccupied habitats. However, definitive evidence for competitive interactions between these species remains elusive. Probert and Litvaitis (1996) conducted behavioural experiments using enclosures to evaluate evidence for competitive interactions between EC and NEC, and, although they found no evidence for interference competition (i.e. neither species appeared to be behaviourally dominant), they concluded that scramble competition, or the more rapid use of food and habitat resources by EC, may be an important process influencing the fate, and, hence, distribution, of NEC throughout their range. Although we found only weak support for EC presence influencing the probability of NEC occurrence, with the species appearing more likely to exhibit patterns of co-occurrence than avoidance (e.g. as a function of similar habitat preferences), we do not suggest that our findings warrant the conclusion that there are no population-level consequences resulting from species co-occurrence. First, two-species occupancy models are data intensive, and our data were moderately sparse (one or both species were detected at 45 of 124 plots, and both species were detected at only nine plots) for identifying signals of these potentially complex relationships. Second, others have noted that inference about competitive interactions that are based solely on spatial pattern (i.e. static representations of species distributions) are usually weaker than those based on the outcomes of manipulative experiments or studies directed at modelling occupancy or population dynamics (Bailey et al. 2009; Yackulic et al. 2014; MacKenzie et al. 2018). Our survey-design represents an advancement on existing approaches for monitoring range-wide EC and NEC occupancy by introducing habitat covariate information and accounting for potential bias associated with incomplete detection. However, our inferences related to competitive interactions between these species remain limited because they are based on the spatial patterns of EC and NEC occupancy observed during a single field season. Clarifying the nature of the relationship between these species will require multiple-season occurrence data to transition the occupancy model from static to dynamic; we believe that ongoing monitoring and modelling efforts should focus on estimating direct influences of EC on NEC occupancy dynamics, i.e. local-patch turnover rates (MacKenzie et al. 2009; Jones and Kroll 2016).
Variation in NEC occupancy was at least partially explained by several plot-level habitat covariates, whereas remotely sensed covariates appeared to be stronger predictors than field-measured habitat covariates. As expected, NEC occupancy was strongly and positively related to the proportion of suitable habitat in a plot. However, this finding should be interpreted with caution, because the suitable habitat covariate was derived from an existing habitat-suitability model representing the intersection of recent historical NEC records (2009–2014) with extant conservation lands, managed public lands and forest–wetland ecotones. This demonstrates the usefulness of using existing habitat-suitability models to characterise the spatial configuration of suitable habitat on the landscape. The existing habitat-suitability model is essentially an index composed of multiple remotely sensed habitat layers, making it difficult to identify which components are the primary drivers influencing NEC occupancy. Additional remote and field-based measures, represented by Land Cover covariates and Understorey and Canopy Cover measurements, were, therefore, also used to describe plot conditions and found to be important predictors of occupancy. As hypothesised, NEC occupancy was positively related to the amount of dense understorey vegetation and canopy cover, which agrees with previous studies and general understanding of NEC habitat preferences during winter (Barbour and Litvaitis 1993; Litvaitis et al. 2003). In contrast to the relative imprecision of coefficients associated with these in situ measurements, remotely sensed Land Cover covariates demonstrated stronger relationships with NEC occupancy; however, the direction or magnitude of these relationships sometimes contrasted with our a priori hypotheses. For example, we expected that NEC occupancy would be strongly and positively related to forested and wetland land cover, but these showed only a weak (and imprecise) positive relationship with NEC occurrence. We found a strong, positive relationship between NEC occupancy and developed and agricultural land cover, which is in general agreement with previous studies of NEC occurrence (Tash and Litvaitis 2007). In developed and disturbed lands, higher rates of NEC occurrence have, in part, been attributed to a greater number of potential dispersal corridors in those areas (Tash and Litvaitis 2007). We could not distinguish between active and idle agricultural lands using NLCD, but we suspect that some agricultural areas identified remotely may represent idle fields and, hence, early successional habitats (or those transitioning to early successional habitats) preferred by NEC. Although we found strong relationships between remotely sensed land-cover covariates and NEC occurrence, future modelling efforts would likely benefit from modifications of, or additions to, the NLCD land-cover classes used in the present study.
We highlight that a component of the habitat-suitability covariate is the recent historical records of NEC occurrence, which is a function of both the true historical NEC distribution and historical survey effort. Therefore, this component of the covariate will be zero in those areas that have not been subject to previous survey efforts, even if NEC occurred in those areas historically. As such, using a habitat-suitability index to define the sampling frame for long-term monitoring risks limiting the scope of inference to a static, and possibly incomplete, definition of a species’ universe, with the result of being unable to claim a true assessment of range-wide distribution. Even if a suitability index captures the relationship between key habitat predictors and species presence, it is not able to provide critical information on which habitats do not support the species. Particularly for a successional species such as NEC, the importance of understanding the influence of both suitable and unsuitable habitat on population vital rates (i.e. colonisation and extinction), as well of being able to track habitat changes over time, cannot be overstated. However, we note that historical occurrence data are only one of several components of the habitat-suitability covariate, and, therefore, the use of this metric is not without merit. First, knowledge of the distribution of potentially suitable habitat within the region of interest, irrespective of current population status, is valuable for managers and biologists who are often faced with limited time and money available for monitoring. Indeed, the rarity of NEC, combined with the large region targeted for monitoring and management, means that the ability to stratify habitat on the basis of a priori hypotheses of suitability can serve to increase the cost effectiveness of monitoring while maintaining statistical rigour. Understanding the relationship between the proportion of suitable habitat and NEC occurrence can also provide insights regarding NEC occurrence in areas defined by the other components of the suitability covariate, including existing conservation lands, managed public lands and forested areas that intersect with wetlands. However, improving understanding of how the individual components of the suitable-habitat covariate influence NEC occurrence will most effectively be accomplished by including these components as separate covariates in future modelling efforts.
By using parameter estimates from the 95% confidence set of single-species models that included remotely sensed covariates, we estimated model-averaged unconditional occupancy, or the probability that an unsurveyed plot was occupied by NEC on the basis of site-specific covariate values. Unconditional occupancy was estimated for each of the 132 358 200 m × 200 m plots encompassed by the NEC survey zone (Fig. 1). The ability to predict occupancy highlights the value of using habitat information derived from large-scale (e.g. range-wide), remotely sensed data in conditional occupancy models (Crum et al. 2017). Predicting occupancy over a large spatial scale was possible because systematic data collection and this modelling approach allowed greater understanding of the relationship between remotely sensed habitat covariates and the probability of NEC occurrence within the survey zone. Further, the ability to predict unconditional occupancy provides a useful framework for prioritising how survey effort is allocated throughout the NEC survey zone. We used a lower 60% confidence limit threshold for unconditional occupancy to classify plots within the entire survey zone into the following three strata: low, moderate and high probability. By using this information, managers could choose to weight future site selection (and, hence, effort allocation) among the three strata. However, we caution against excluding one or more strata, because this may bias inference on habitat-occupancy relationships and elevate the risk of missing changes in patch occupancy (colonisation and extinction events) if they occur more commonly in marginal habitat (i.e. areas at the margin of a range contraction or expansion), or if the species is experiencing a range-shift (i.e. as a result of climate change). Although decisions related to optimal survey-effort allocation and stratification will depend on specific monitoring objectives, the ability to predict occupancy over a large spatial extent allows for refinements in this allocation, which can be accomplished in a variety of ways, including traditional stratified sampling (Thompson 2012) or adaptive survey designs (Pacifici et al. 2015).
Collected over multiple seasons, data generated from the monitoring design proposed here could be analysed with a spatially explicit dynamic occupancy model to assess changes in EC and NEC occupancy under a metapopulation framework (Eaton et al. 2014; Sutherland et al. 2014). Because metapopulation dynamics are concerned with population turnover (extinction and colonisation) rather than changes in abundance, and because remaining NEC and EC populations in New England are often viewed as being spatially structured in induced metapopulations resulting from habitat loss and fragmentation (Litvaitis and Villafuerte 1996), such a framework may be appropriate. In their simplest form, dynamic occupancy models can be implemented for a single species (e.g. NEC only) to estimate local colonisation and extinction rates, and these dynamic rates can, in turn, be modelled as a function of environmental covariates (MacKenzie et al. 2003; Royle and Kery 2007; Miller and Grant 2015). Ideally, however, it is possible to implement dynamic co-occurrence models that will jointly model EC and NEC dynamics (MacKenzie et al. 2009, 2018; Richmond et al. 2010). Such an approach, which has been successfully applied in several cases to assess competitive interactions between two co-occurring species (Bailey et al. 2009; Jones and Kroll 2016), would provide the ability to assess the extent to which interactions with EC influence NEC colonisation and extinction processes, in addition to the influence of abiotic factors on those processes. In turn, this information can be used to guide species-recovery decisions, such as optimal locations for translocating individuals or where actions to exclude or remove competitors would be best served. With respect to assessing the influence of management activities, identifying the abiotic and biotic conditions that promote the persistence or colonisation of NEC, that is the conditions that managers strive to achieve when they implement management actions, is extremely valuable. Thus, explicit modelling of colonisation and extinction processes as a function of physical habitat conditions should aid in improving understanding of both system dynamics and the potential effects of management activities.
Management implications
This monitoring protocol was designed to provide data suitable for assessing the predominant factors influencing the occupancy status (and ultimately dynamics) of New England and Eastern cottontails within portions of the species’ ranges that are relevant to management and conservation activities. Throughout this process, we were confronted with several challenges that are commonly encountered by wildlife management agencies. First, despite a collective desire to assess and monitor NEC abundance and population dynamics, challenges related to the costs and logistics of data collection and genetic analysis of faecal pellets meant that occupancy was a practical choice of state variable for monitoring. Second, the range of the New England cottontail overlaps the jurisdiction of multiple state agencies, necessitating agreement on a common monitoring protocol and recommendations for monitoring effort that did not exceed individual state constraints. Our decision to limit the survey zone to areas within a 5-km buffer surrounding recent detections of NECs was driven primarily by the species’ rarity and the need to increase the likelihood that some proportion of surveys would include positive NEC detection. This decision, although effective in reducing the spatial extent of monitoring, came at a cost with respect to inference about the predominant factors influencing range-wide occupancy, which are limited to the conditions of the area surveyed. This highlights the importance of explicitly identifying monitoring objectives, which increases the probability that a monitoring protocol will be designed to provide the information necessary for accomplishing management goals.
Conflicts of interest
The authors declare no conflicts of interest.
Acknowledgements
This research would not have been possible without the support of the United States Fish and Wildlife Service and the United States Geological Survey (Science Support Partnership Program grant 13-R5-01). We are particularly grateful to the following people for their assistance with field work and valuable feedback during the development of the existing monitoring protocol: A. Tur, S. Fuller, S. Weber, H. Kilpatrick, P. Novak, L. Wahle, K. O’Brien, J. Tash, A. Johnson, M. Piche, D. Scarpitti, E. Burns, G. Casabona, J. Stokes Weber, K. Boland, T.J. McGreevy, and H. Holman. We are also indebted to M. Runge, J. Martin, W. Jakubas, A. Kovach and two anonymous reviewers for helpful comments on earlier drafts of this manuscript. Any use of trade, firm or product names is for descriptive purposes only and does not imply endorsement by the United States Government.
References
Bailey, L. L., Reid, J. A., Forsman, E. D., and Nichols, J. D. (2009). Modeling co-occurrence of northern spotted and barred owls: accounting for detection probability differences. Biological Conservation 142, 2983–2989.| Modeling co-occurrence of northern spotted and barred owls: accounting for detection probability differences.Crossref | GoogleScholarGoogle Scholar |
Barbour, M. S., and Litvaitis, J. A. (1993). Niche dimensions of New England cottontails in relation to habitat patch size. Oecologia 95, 321–327.
| Niche dimensions of New England cottontails in relation to habitat patch size.Crossref | GoogleScholarGoogle Scholar | 28314005PubMed |
Brubaker, D. R., Kovach, A. I., Ducey, M. J., Jakubas, W. J., and O’Brien, K. M. (2014). Factors influencing detection in occupancy surveys of a threatened lagomorph. Wildlife Society Bulletin 416, 1–11.
Burnham, K. P., and Anderson, D. R. (2002). ‘Model Selection and Multimodel Inference.’ 2nd edn. (Springer-Verlag: New York.)
Crum, N. J., Fuller, A. K., Sutherland, C. S., Cooch, E. G., and Hurst, J. (2017). Estimating occupancy probability of moose using hunter survey data. The Journal of Wildlife Management 81, 521–534.
| Estimating occupancy probability of moose using hunter survey data.Crossref | GoogleScholarGoogle Scholar |
Eaton, M. J., Hughes, P. T., Hines, J. E., and Nichols, J. D. (2014). Testing metapopulation concepts: effects of patch characteristics and neighborhood occupancy on the dynamics of an endangered lagomorph. Oikos 123, 662–676.
| Testing metapopulation concepts: effects of patch characteristics and neighborhood occupancy on the dynamics of an endangered lagomorph.Crossref | GoogleScholarGoogle Scholar |
ESRI (2016). ‘ArcGIS Desktop: Release 10.4.1.’ (Environmental Systems Research Institute: Redlands, CA.)
Fiske, I., and Chandler, R. (2011). Unmarked: an R package for fitting hierarchical models of wildlife occurrence and abundance. Journal of Statistical Software 43, 1–23.
| Unmarked: an R package for fitting hierarchical models of wildlife occurrence and abundance.Crossref | GoogleScholarGoogle Scholar |
Fuller, S., and Tur, A. (2012). ‘Conservation Strategy for the New England Cottontail (Sylvilagus transitionalis).’ Regional New England Cottontail Initiative. Available at https://newenglandcottontail.org [verified 22 January 2018].
Gerrodette, T., Dayton, P. K., Macinko, S., and Fogarty, M. J. (2002). Precautionary management of marine fisheries: moving beyond burden of proof. Bulletin of Marine Science 70, 657–668.
Hammill, M. O., and Stenson, G. B. (2003). ‘Harvest Simulations for 2003–2006 Harp Seal Management plan.’ Research Document 2003/068. (Canadian Science Advisory Secretariat: Ottawa, Canada.)
Hines, J. E. (2006). ‘PRESENCE: Software to Estimate Patch Occupancy and Related Parameters.’ (USGS–PWRC: Laurel, MD.) Available at http://www.mbr-pwrc.usgs.gov/software.html [Verified 30 September 2017].
Homer, C. G., Dewitz, J. A., Yang, L., Jin, S., Danielson, P., Xian, G., Coulston, J., Herold, N. D., Wickham, J. D., and Megown, K. (2015). Completion of the 2011 National Land Cover Database for the conterminous United States: representing a decade of land cover change information. Photogrammetric Engineering and Remote Sensing 81, 345–354.
Hurvich, C. M., and Tsai, C. (1989). Regression and time series model selection in small samples. Biometrika 76, 297–307.
| Regression and time series model selection in small samples.Crossref | GoogleScholarGoogle Scholar |
Jackson, C. H. (2011). Multi-state models for panel data: the msm package for R. Journal of Statistical Software 38, 1–29.
| Multi-state models for panel data: the msm package for R.Crossref | GoogleScholarGoogle Scholar |
Jones, J. E., and Kroll, A. J. (2016). A joint model of species interaction dynamics for multistate processes incorporating imperfect detection. Ecosphere 7, e01477.
| A joint model of species interaction dynamics for multistate processes incorporating imperfect detection.Crossref | GoogleScholarGoogle Scholar |
Kovach, A. I., Litvaitis, M. K., and Litvaitis, J. K. (2003). Evaluation of fecal mtDNA analysis as a method to determine the geographic distribution of a rare lagomorph. Wildlife Society Bulletin 31, 1061–1065.
Lindenmayer, D. B., Hulvey, K. B., Hobbs, R. J., Colyvan, M., Felton, A., Possingham, H., Steffen, W., Wilson, K., Youngentob, K., and Gibbons, P. (2012). Avoiding bio-perversity from carbon sequestration solutions. Conservation Letters 5, 28–36.
| Avoiding bio-perversity from carbon sequestration solutions.Crossref | GoogleScholarGoogle Scholar |
Litvaitis, J. A. (1993). Response of early successional vertebrates to historic changes in land use. Conservation Biology 7, 866–873.
| Response of early successional vertebrates to historic changes in land use.Crossref | GoogleScholarGoogle Scholar |
Litvaitis, J. A., and Villafuerte, R. (1996). Factors affecting the persistence of New England cottontail metapopulations: the role of habitat management. Wildlife Society Bulletin 24, 686–693.
Litvaitis, J. A., Johnson, B., Jakubas, W., and Morris, K. (2003). Distribution and habitat features associated with remnant populations of New England cottontails in Maine. Canadian Journal of Zoology 81, 877–887.
| Distribution and habitat features associated with remnant populations of New England cottontails in Maine.Crossref | GoogleScholarGoogle Scholar |
Litvaitis, J. A., Tash, J. P., Litvaitis, M. K., Marchland, M. N., Kovach, A. I., and Innes, R. (2006). A range-wide survey to determine the current distribution of New England cottontails. Wildlife Society Bulletin 34, 1190–1197.
| A range-wide survey to determine the current distribution of New England cottontails.Crossref | GoogleScholarGoogle Scholar |
Litvaitis, J. A., Barbour, M. S., Brown, A. L., Kovach, A. I., Litvaitis, M. K., Oehler, J. D., Probert, B. L., Smith, D. F., Tash, J. P., and Villafuerte, R. (2008). Testing multiple hypotheses to identify causes of the decline of a lagomorph species: the New England cottontail as a case study. In ‘Lagomorph Biology: Evolution, Ecology, and Conservation’. (Eds P. C. Alves, N. Ferrand, and K. Hacklander.) pp. 167–188. (Springer: New York.)
Lorimer, C. G., and White, A. S. (2003). Scale and frequency of natural disturbances in the northeastern US: implications for early successional forest habitats and regional age distributions. Forest Ecology and Management 185, 41–64.
| Scale and frequency of natural disturbances in the northeastern US: implications for early successional forest habitats and regional age distributions.Crossref | GoogleScholarGoogle Scholar |
Lyons, J. E., Runge, M. C., Laskowski, H. P., and Kendall, W. L. (2008). Monitoring in the context of structured decision-making and adaptive management. The Journal of Wildlife Management 72, 1683–1692.
| Monitoring in the context of structured decision-making and adaptive management.Crossref | GoogleScholarGoogle Scholar |
MacKenzie, D. I., Nichols, J. D., Lachman, G. B., Droege, S., Royle, J. A., and Langtimm, C. A. (2002). Estimating site occupancy rates when detection probabilities are less than one. Ecology 83, 2248–2255.
| Estimating site occupancy rates when detection probabilities are less than one.Crossref | GoogleScholarGoogle Scholar |
MacKenzie, D. I., Nichols, J. D., Hines, J. E., Knutson, M. G., and Franklin, A. D. (2003). Estimating site occupancy, colonization and local extinction when a species is detected imperfectly. Ecology 84, 2200–2207.
| Estimating site occupancy, colonization and local extinction when a species is detected imperfectly.Crossref | GoogleScholarGoogle Scholar |
MacKenzie, D. I., Bailey, L. L., and Nichols, J. D. (2004). Investigating species co-occurrence patterns when species are detected imperfectly. Journal of Animal Ecology 73, 546–555.
| Investigating species co-occurrence patterns when species are detected imperfectly.Crossref | GoogleScholarGoogle Scholar |
MacKenzie, D. I., Nichols, J. D., Seamans, M. E., and Gutierrez, R. J. (2009). Modeling species occurrence dynamics with multiple states and imperfect detection. Ecology 90, 823–835.
| Modeling species occurrence dynamics with multiple states and imperfect detection.Crossref | GoogleScholarGoogle Scholar | 19341151PubMed |
MacKenzie, D. I., Nichols, J. D., Royle, J. A., Pollock, K. H., Bailey, L. L., and Hines, J. E. (2018). ‘Occupancy Estimation and Modeling: Inferring Patterns and Dynamics of Species Occurrence.’ 2nd edn. (Academic Press: Boston, MA.)
Miller, D. A. W., and Grant, E. H. C. (2015). Estimating occupancy dynamics for large-scale monitoring networks: amphibian breeding occupancy across protected areas in the northeast United States. Ecology and Evolution 5, 4735–4746.
| Estimating occupancy dynamics for large-scale monitoring networks: amphibian breeding occupancy across protected areas in the northeast United States.Crossref | GoogleScholarGoogle Scholar |
Pacifici, K., Reich, B. J., Dorazio, R. M., and Conroy, M. J. (2015). Occupancy estimation for rare species using a spatially-adaptive sampling design. Methods in Ecology and Evolution 7, 285–293.
| Occupancy estimation for rare species using a spatially-adaptive sampling design.Crossref | GoogleScholarGoogle Scholar |
Probert, B. L., and Litvaitis, J. A. (1996). Behavioral interactions between invading and endemic lagomorphs: implications for conserving a declining species. Biological Conservation 76, 289–295.
| Behavioral interactions between invading and endemic lagomorphs: implications for conserving a declining species.Crossref | GoogleScholarGoogle Scholar |
R Core Development Team (2016). ‘R: a Language and Environment for Statistical Computing.’ (R Foundation for Statistical Computing: Vienna, Austria.)
Richmond, O. M. W., Hines, J. E., and Beissinger, S. R. (2010). Two-species occupancy models: a new parameterization applied to co-occurrence of secretive rails. Ecological Applications 20, 2036–2046.
| Two-species occupancy models: a new parameterization applied to co-occurrence of secretive rails.Crossref | GoogleScholarGoogle Scholar |
Royle, J. A., and Kery, M. (2007). A Bayesian state–space formulation of dynamic occupancy models. Ecology 88, 1813–1823.
| A Bayesian state–space formulation of dynamic occupancy models.Crossref | GoogleScholarGoogle Scholar | 17645027PubMed |
Runge, M. C., Sauer, J. R., Avery, M. L., Blackwell, B. F., and Koneff, M. D. (2009). Assessing allowable take of migratory birds. The Journal of Wildlife Management 73, 556–565.
| Assessing allowable take of migratory birds.Crossref | GoogleScholarGoogle Scholar |
Smith, D. F., and Litvaitis, J. A. (2000). Foraging strategies of sympatric lagomorphs: implications for differential success in fragmented landscapes. Canadian Journal of Zoology 78, 2134–2141.
| Foraging strategies of sympatric lagomorphs: implications for differential success in fragmented landscapes.Crossref | GoogleScholarGoogle Scholar |
Sutherland, C., Elston, D. A., and Lambin, X. (2014). A demographic, spatially explicit patch occupancy model of metapopulation dynamics and persistence. Ecology 95, 3149–3160.
| A demographic, spatially explicit patch occupancy model of metapopulation dynamics and persistence.Crossref | GoogleScholarGoogle Scholar |
Tash, J. P., and Litvaitis, J. A. (2007). Characteristics of occupied habitats and identification of sites for restoration and translocation of New England cottontail populations. Biological Conservation 137, 584–598.
| Characteristics of occupied habitats and identification of sites for restoration and translocation of New England cottontail populations.Crossref | GoogleScholarGoogle Scholar |
Thompson, S. K. (2012). ‘Sampling.’ 3rd edn. (Wiley: New York.)
Trent, T. T., and Rongstad, O. J. (1974). Home range and survival of cottontail rabbits in southwestern Wisconsin. The Journal of Wildlife Management 38, 459–472.
| Home range and survival of cottontail rabbits in southwestern Wisconsin.Crossref | GoogleScholarGoogle Scholar |
U.S. Fish and Wildlife Service (2015). ‘Endangered and threatened wildlife and plants; 12-month finding on a petition to list the New England cottontail as an endangered or threatened species.’ Federal Register, Vol. 80, no. 178. pp. 55 286–55 304. Available at https://www.govinfo.gov/content/pkg/FR-2015-09-15/pdf/2015-22885.pdf [Verified 8 March 2019].
Wade, P. R. (1998). Calculating limits to the allowable human-caused mortality of cetaceans and pinnipeds. Marine Mammal Science 14, 1–37.
| Calculating limits to the allowable human-caused mortality of cetaceans and pinnipeds.Crossref | GoogleScholarGoogle Scholar |
Yackulic, C. B., Reid, J., Nichols, J. D., Hines, J. E., Davis, R., and Forsman, E. (2014). The roles of competition and habitat in the dynamics of populations and species distributions. Ecology 95, 265–279.
| The roles of competition and habitat in the dynamics of populations and species distributions.Crossref | GoogleScholarGoogle Scholar | 24669721PubMed |