

On the interaction of wind, fire intensity and downslope terrain with implications for building standards in wildfire-prone areas
Ali Edalati-nejad A , Maryam Ghodrat B * and Jason J. Sharples A *
A School of Science, UNSW Canberra, Canberra, ACT 2612, Australia. Email: a.edalatinejad@unsw.edu.au
B School of Engineering and Information Technology, UNSW Canberra, Canberra, ACT 2612, Australia.
Abstract
Wildfires can have detrimental impacts on the environment and urban structures when they spread from wildland areas.
In this work, a numerical study was performed to investigate the effect of downslope terrain on fire-induced flows in the presence of a building structure. Fires with intensities of 4 and 15 MW m−1 were considered on inclined terrain with downslope angles varying from 0° to −30°, and wind speeds of 6 and 12 m s−1.
Simulations were conducted using a large eddy simulation (LES) solver, implemented in the open-source platform FireFOAM.
The results were validated with experimental measurements of a full-scale building model. Results show that at a wind velocity of 12 m s−1, structures on steeper downslope terrains are at higher risk of wildfire damage, whereas at a constant wind velocity of 6 m s−1, these structures are at a lower risk.
The outcomes of the study highlight the physical effect of sloped terrain on buildings downwind of a line fire.
The results from this study can be used to evaluate the validity of risk management measures including building standards and asset protection zones and can better inform ways of improving these measures.
Keywords: CFD, computational fluid dynamics, downslope, LES, large-eddy simulation, terrain slope, wildfire, wildland–urban interface, wind structure, wind–fire interaction.
Introduction
Wildfire is a highly complex phenomenon, which plays an important role in many ecological processes (Menage et al. 2012). However, it can also have significant detrimental effects when it spreads from wildland areas into the Wildland–Urban Interface (WUI), where it can damage houses and other structures and human assets (Verma 2019). People interact with wildfires in a variety of way to mitigate their adverse impacts and to manage the environmental and socioeconomic risks associated with them. This includes the use of prescribed fires to reduce fuel loads and thereby lessen the likelihood of damage to assets, and mechanical clearing of fuels, particularly on the edge of the WUI, where such clearings form asset protection zones (Canfield et al. 2014). The growing rate of urbanisation is considered as one of the most significant drivers of landscape transformation in many countries, including Australia, and has resulted in an increase in the size and exposure of the WUI in many urban areas (Manzello et al. 2018) around the globe. Protection of human assets (dwellings, associated structures and other infrastructure) in areas likely to be impacted by wildfire requires a precise assessment of factors, such as wind and topography, that may affect the behaviour of a wildfire and its impact on structures in the WUI (Mell et al. 2010; Cruz et al. 2014; Hilton et al. 2017; Ghodrat et al. 2021). Knowledge of these factors can then be used to inform risk mitigation measures such as building standards, like those detailed in the Australian Standard for Building in Bushfire-Prone Areas, AS3959 (Weir 2018).
Wildfire behaviour reflects a wide range of complex physical and chemical processes (Verma 2019). At fine spatial and temporal scales, wildfire behaviour is driven by the combustion process, which has been investigated by many authors (e.g. Fanaee and Esfahani 2012; Bidabadi et al. 2014; Fanaee and Esfahani 2014; Fanaee 2018; Pourali et al. 2021). At coarser scales, wildfire behaviour and propagation are governed mostly by topographic and weather conditions and by the state of the fuel. Terrain slope is specifically considered to be a key element impacting the way in which wildfires spread (Butler et al. 2007; Abouali et al. 2021). Fires typically increase in speed when spreading up a hill, and many deadly incidents have been reported in association with steep or hilly terrain (Butler et al. 2007; Dupuy et al. 2011). Meteorological conditions, especially wind speed and direction, temperature and relative humidity, are also recognised as key factors influencing the behaviour and propagation of a wildfire (Yang et al. 2018; Cruz et al. 2020; Zhao and Liu 2021; Sutherland et al. 2023).
Generally, it is not feasible to account for all the manifold collective effects driving fire behaviour, so researchers focus their investigations on targeted studies designed to provide understanding of the effects of a small subset of the most significant driving elements, such as Viegas (2004), who carried out a series of experiments using a plane fuel bed under uniform wind and slope conditions to investigate the combined effect of terrain slope and wind on fire propagation. Dupuy et al. (2011) also studied the effect of terrain slope on fire behaviour in a series of laboratory experiments. In their study, 109 experiments were conducted to investigate the effect of positively inclined terrain (slopes ranging from 0° to 30°) on fire behaviour characteristics such as temperature and flame geometry. Their results indicated that an increase in terrain slope leads to an increase in the flame residence time.
A set of experiments was also conducted by Mendes-Lopes et al. (2003), who considered how variations in terrain slope and wind speed affected fire behaviour properties such as flame length, flame height, flame angle and temperature. Their results further confirmed that rate of spread increases with terrain slope for upslope propagation. Flame tilt angle and flame height were also found to depend on terrain slope, with an increase in the upslope inclination resulting in an increase in the flame tilt angle and a decrease in flame height. Hilton and Garg (2021) made a comparison between two-dimensional and three-dimensional wildfire simulations in the presence of wind and inclined terrain and experimentally measured datasets. They found good agreement between the experimental measurements and the two-dimensional model, which unlike the three-dimensional model, requires no parametrisation or fitting term. A numerical and experimental investigation of the effect of terrain slope on fire plume characteristics was conducted by Wu et al. (2000). Specifically, they considered how the rate of heat release influenced the critical inclination angle for plume attachment to the surface. Their results indicated that the critical angle for attachment was independent of fire heat release rate.
These studies provide valuable information about the effect of terrain slope on fire dynamics when fires are spreading upslope. However, there has been considerably less attention paid to scenarios where fires are burning downslope. Sullivan et al. (2014) developed a rate of spread correction for fires burning downslope based on the general observation that over large distances (i.e. kilometres), fires burning in undulating terrain exhibit similar overall rates of spread to fires burning over flat ground. However, this approach overlooks the finer-scale dynamics that can influence fire behaviour at sub-kilometre scales; indeed, there is still much to be understood about the dynamics of fires burning downslope at scales relevant to understanding impacts at the WUI. For example, the interaction of pyroconvective flows with negative slopes, winds and structures, and how they affect the radiant heat and temperature profiles downwind of a fire line are still poorly understood and require further study. Such studies are critical in the development of wildfire risk mitigation measures and can better inform improvements to building standards such as AS3959 (Debnam et al. 2005; Weir 2018).
To address these needs, the present investigation considers the effect of downslope terrain on fires of prescribed intensity burning under the influence of uniform ambient winds. Specifically, computational fluid dynamics (CFD) simulations are used to facilitate a detailed investigation of the interactive effects of wind and downslope terrain on fire-line dynamics, including flame geometry and heat transfer. Moreover, the patterns of radiant and convective heating on an idealised building structure are investigated to better understand the impacts of downslope fires on built assets. The study emulates scenarios covered in the Australian Standard AS3959, which considers a static design fire burning under prescribed conditions to estimate the radiant heat exposure of a nearby structure. The design fire characteristics are based on an assumed quasi-steady equilibrium, with conditions generally corresponding to a Forest Fire Danger Index (FFDI) greater than 50 (Noble et al. 1980). Radiant heat flux is estimated by combining empirical models of flame geometry with an analytic formula for the radiation view factor (Debnam et al. 2005; Weir 2018). In contrast, the present study directly accounts for radiant heat exposure and convective heating using the physical CFD model. The simulations also allow for more physically realistic incorporation of combustion dynamics and pyroconvective interactions, as well as important interactions between the convective plume and the structure.
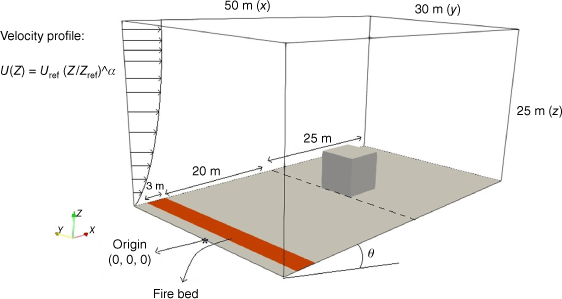
Physical model
In the present work, an idealised (cubic) building structure with a size of 6 × 6 × 6 m is located downwind of a fire line. As can be seen in Fig. 1, the size of the computational domain is 50 × 30 × 25 m, and the building structure is located 20 m downwind of the fire line. The fire line is modelled as 3 m-wide region located 20 m upwind from the building and 2 m downwind from the inlet of the domain. The fire, which is modelled as burning methane, is a static source of constant and uniform fire intensity. It is ignited over the fire line region and allowed to burn under the influence of an ambient wind field. The definition of fire intensity is as follows (Byram 1959):
where I is fire intensity, d denotes the width of the burning fire line and Rc represents the combustion rate of the fire line, which is the fuel mass flow rate multiplied by heat of combustion. In this investigation, two different fire intensities of 4 and 15 MW m−1 are considered, which are approximately equivalent to fires burning in Australian Eucalyptus forests under high and very high fire intensity ratings, as shown in Table 1 (Alexander and Cruz 2019). This is controlled through modification of model parameters in the numerical solver FireFOAM (see next section), corresponding to the burning of methane with a heat of combustion equal to 45 435 kJ kg−1 (Kremer and Schäfer 1973).
| Fire intensity rating | Fire intensity (MW m−1) | |
|---|---|---|
| High | 3–7 | |
| Very high | 7–70 |
The ambient wind is modelled as a boundary layer flow with a power-law velocity profile defined as:
U is wind velocity, and θ is the terrain angle. The variable Z denotes height above the surface (at the inlet) and Zref is a reference height, which is taken as equal to the building height (6 m). The power-law parameter α is a constant taken as equal to 0.16 based on the terrain category of the experimental study of Tominaga et al. (2008), and Uref is a reference wind speed, which in this study is fixed as either 6 or 12 m s−1. These reference wind speeds were chosen as representative of the types of conditions that are considered for calculation of Bushfire Attack Levels in Australian Standard AS3959. The Standard assumes conditions satisfying FFDI ≥ 50, which requires winds of significant strength. A reference wind of Uref = 6 m s−1 corresponds to a 10-m wind speed of 6.5 m s−1, and is classified as ‘moderate breeze’ on the Beaufort Scale, whereas a reference wind of Uref = 12 m s−1 corresponds to a 10-m wind speed of 13.0 m s−1, and is classified as a ‘strong breeze’.
The effect of terrain slope is imposed by controlling the orientation of the gravitational acceleration vector. Specifically, the angle of inclination of the terrain, θ, is the angle of gravitational acceleration, g, to the z-direction, which is defined as:
In this study, inclinations of θ = 0°, −10°, −20° and −30° are considered.
We note that with the conventions just described, the building structure remains aligned parallel to the ground surface as the terrain inclination is varied. Although this may not be completely realistic, it is more computationally convenient. Given that the main interest pertains to fire impacts on the windward face of the structure, the configurations considered are still relevant and informative.
Numerical modelling
To numerically solve the governing equations of the problem, the FireFOAM solver of OpenFOAM, which is open-source CFD software, is used. FireFOAM is an efficient tool to simulate wildfire behaviour (El Houssami et al. 2018; Le et al. 2018). It includes a variety of CFD submodels to simulate and solve fluid dynamics problems such as radiant and convective heating, pyrolysis, and turbulent and laminar combustion. In the current study, to account for the effects of turbulent flow on fluid behaviour, the Large Eddy Simulation (LES) (Wang et al. 2011) turbulence model is applied and the wall-adapting local eddy (WALE) viscosity method is used. The combustion model of infinitely fast chemistry (Akaotsu et al. 2020) is also employed. The single-step combustion reaction of methane is used:
The governing equations for the problem are as follows:
Here, ‘¯’ and ‘~’ denote spatial and Favre filtering, respectively, h is the total enthalpy, Ym represents the mass fraction of species m, P is the static pressure, and g is gravitational acceleration (also see Eqn 3). Sct, Prt, υ, Dc, υt, ρ, αt, R, δ and ωm are the turbulent Schmidt number, the turbulent Prandtl number, the laminar viscosity, the laminar diffusion coefficient, the turbulent viscosity, density, thermal diffusion coefficient, gas constant, Kronecker delta, and production or sink rate of species m due to the gas reaction, respectively. The PIMPLE algorithm (Jasak 1996) for pressure-velocity coupling is applied. The first-order upwind differencing scheme is also used (Hassan et al. 1983). Initial conditions assume zero flow within the domain and an ambient temperature of 298.15 K.
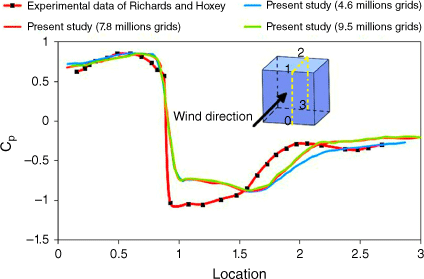
In order to validate the simulations, the mean pressure coefficients around the idealised building structure for the current work and an experimental measurement of Richards and Hoxey (2012) in the absence of fire were compared, as shown in Fig. 2. The pressure along the vertical and horizontal centrelines of the Silsoe cube, at the Silsoe Research Institute, UK, was measured. In Fig. 2, the x-axis corresponds to the yellow dashed line shown on the cube: it starts from point 0, goes to point 1, passes point 2, and continues to point 3.
Comparison between the mean pressure coefficients (Cp) for three different grid numbers of the current investigation and the experimental measurement (Richards and Hoxey 2012).
To validate the model in the case with fire, data reported by Morvan (2007) are compared with the results of the current work, which is reported in Table 2. Flame heights and vertical projection of the flame (Morvan 2007) for wind velocities of 4.5, 6, and 7.5 m s−1 and a fire intensity of 10 MW m−1 are considered. As can be seen, the data from the present work are close to the published data (Morvan 2007), with a maximum error of ~8%.
| Flame height at wind speed U (m s−1) | Published data (Morvan 2007) (m) | Present study (m) | |
|---|---|---|---|
| U = 4.5 | 1.40 | 1.50 | |
| U = 6.0 | 1.25 | 1.15 | |
| U = 7.5 | 0.85 | 0.80 |
Moreover, to investigate the independence of the mesh used to implement the CFD solution, three different grid numbers of 4.6, 7.8 and 9.5 million in the domain were applied and tested. Increasing the mesh number from 4.6 to 7.8 million changes the mean pressure coefficient, but a subsequent increase to 9.5 million does not significantly affect the results. Based on this sensitivity analysis, the second mesh number was selected for the present study. As can be observed in Fig. 2, there is an acceptable level of agreement between the present work results and the experimental measurements.
Results
Fig. 3a, b shows the effect of downslope terrain angles on the temperature field for Uref = 6 m s−1 and fire intensities of 4 and 15 MW m−1, respectively. For each of the fire line intensities considered, the flame tilt angle decreases as the downslope angle increases. Here, the flame tilt angle is defined as the angle between the centreline of the flame, or hot plume, and the direction normal to the surface (Li et al. 2019, 2021). The flame tilt angle decreases with as the downslope angle increases owing to buoyancy forces that cause the flame to rise in the direction opposite to gravity. Closer inspection of Fig. 3 indicates that for Uref = 6 m s−1 and for fire intensities of 4 and 15 MW m−1, an increase in the downslope angle leads to an overall lower risk of high-temperature exposure of the building. Fig. 3a shows that for a fire intensity of 4 MW m−1 and when θ = 0°, the heat remains close to the surface so that the windward surface of the building is bathed in the hot plume. As the downslope angle increases, a larger proportion of the hot plume flows above the building, resulting in less convective heating. This effect is even more pronounced for the 15 MW m−1 case. For θ = 0° in Fig. 3b, the hot plume flows into the building, resulting in convective heating of its windward surface. For the θ = −10° case, however, the hot plume mostly flows over the top of the building, resulting in less convective heating, whereas for the θ = −20° and −30° cases, the hot plume rises clean over the top of the building.
Temperature distribution for the cases with wind velocity of 6 m s−1 and different downslopes. The fire intensities considered are: (a) I = 4 MW m−1, and (b) I = 15 MW m−1.
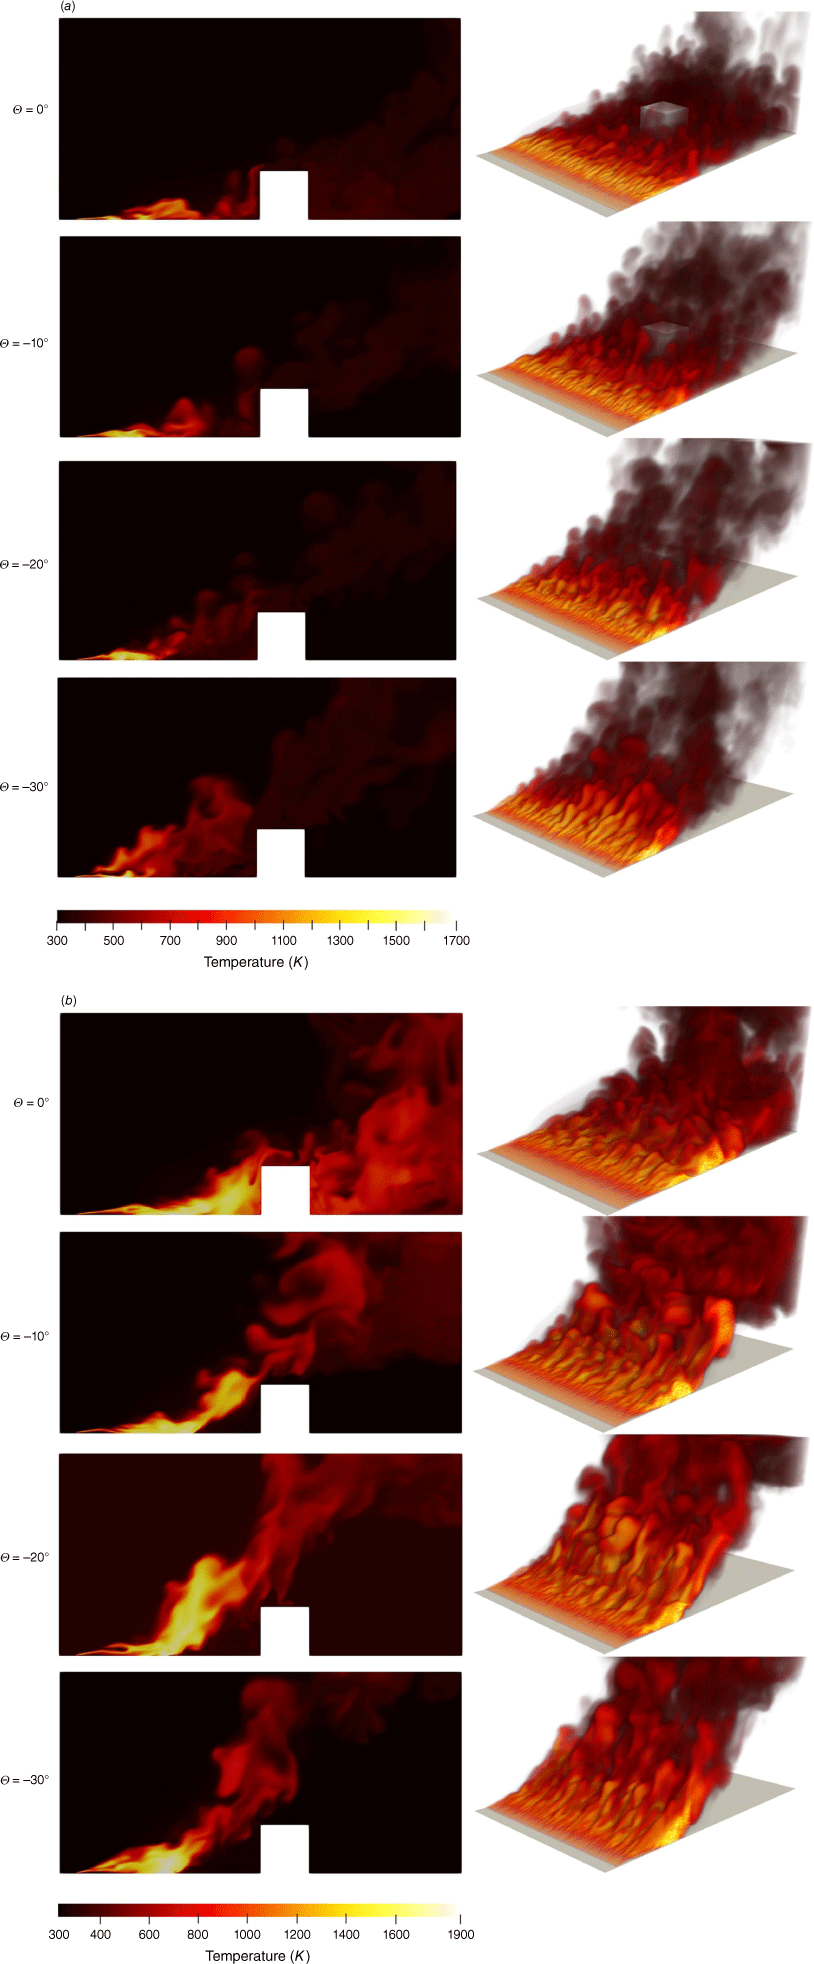
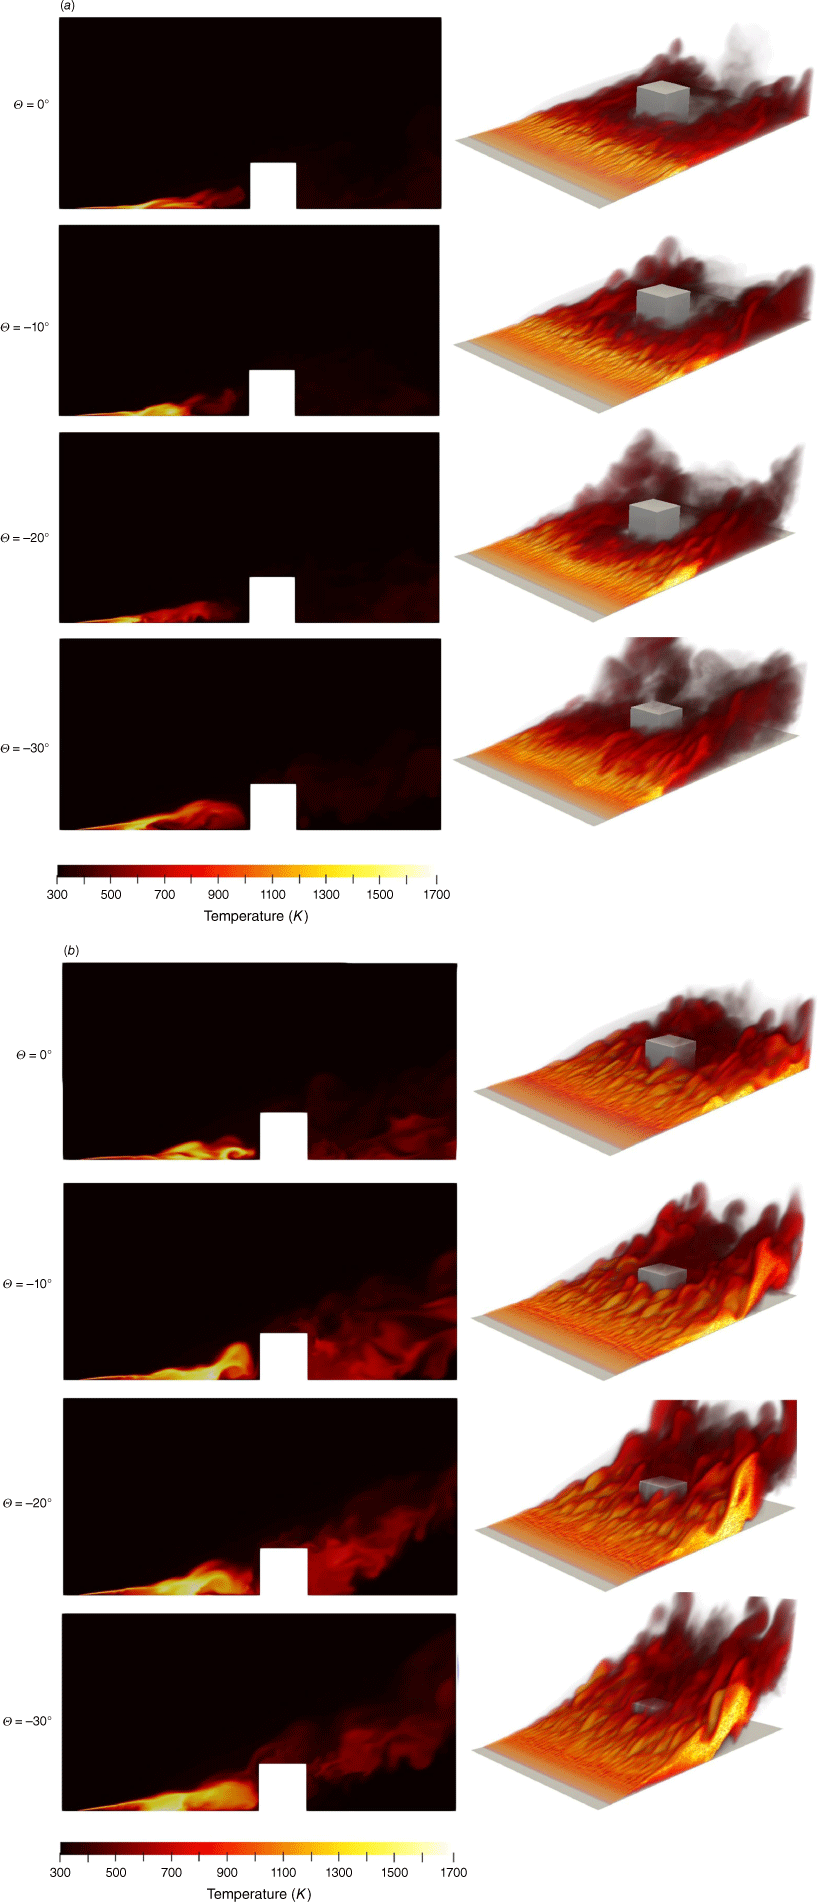
Fig. 4a, b shows the effect of downslope angle on the temperature field downwind of the fire for a reference wind speed of Uref = 12 m s−1 and fire intensities of 4 and 15 MW m−1, respectively. Again, the flame tilt angle is seen to decrease as the downslope angle increases, but the effect is less pronounced than in was in the Uref = 6 m s−1 cases. Also, the flame tilt angle is generally greater for this higher wind speed case, as might be expected. Closer inspection of Fig. 4 reveals that in contrast to the Uref = 6 m s−1 case, exposure of the building to convective heating is greater for the steeper downslope scenarios. Indeed, as the downslope angle increases, a greater proportion of the building surface is bathed in the hot plume emanating from the fire.
Temperature distribution for the cases with wind velocity of 12 m s−1 and different downslopes. The fire intensities considered are: (a) I = 4 MW m−1, and (b) I = 15 MW m−1.
These observations are confirmed by Fig. 5, which shows how the area-weighted average temperature over the windward surface of the building varies with downslope inclination. The figure clearly shows that the overall thermal load on the building surface decreases with increasing downslope inclination for the Uref = 6 m s−1 cases and increases with increasing downslope inclination for the Uref = 12 m s−1 cases. This effect is less pronounced for the 4 MW m−1 fire compared with the 15 MW m−1 fire. For Uref = 12 m s−1, increasing the downslope angle from θ = 0° to −30° leads to an increase of the area-weighted temperature of the building surface by 15% for a fire intensity of 4 MW m−1 and by 30% for a fire intensity of 15 MW m−1. For Uref = 6 m s−1, increasing the downslope angles from θ = 0° to −30° decreases the area-weighted temperature of the building surface by 15% for a fire intensity of 4 MW m−1 and by 33% for a fire intensity of 15 MW m−1.
Area-weighted temperature of the building surface plotted against terrain slope for Uref = 6 and 12 m s−1 and fire intensities of (a) 15 MW m−1, and (b) 4 MW m−1.
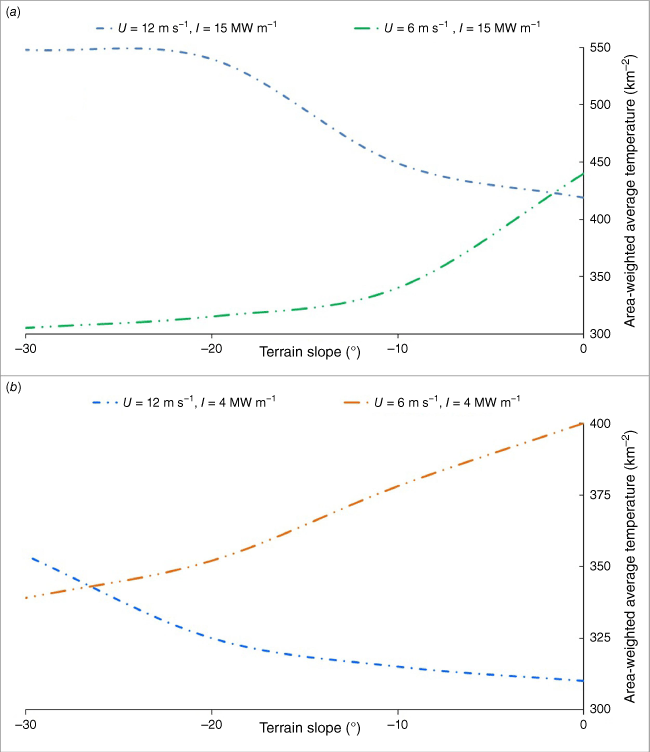
Fig. 5 also indicates that when θ = 0°, the area-weighted average temperature for the Uref = 6 m s−1 cases exceeded that of the Uref = 12 m s−1 cases, and that this effect is more pronounced for the lower fire intensity cases. This result is perhaps unexpected but seems to arise from the combination of two effects. This first is greater entrainment of cooler ambient air into the plume in the Uref = 12 m s−1 cases, as evidenced by the relatively shorter lengths of the hot plumes compared with the Uref = 6 m s−1 cases. The second effect arises owing to the interaction of the stronger flow with the windward face of the building. This interaction forms a turbulent layer as the flow is deflected by the building, which allows convective cooling near the building surface and further enhances the entrainment of cooler air into the plume. This is evidenced by the presence of a darker region immediately upwind of the building in all the cases depicted in Fig. 4.
Fig. 6 shows how the maximum temperature attained on the buildings surface varies with downslope inclination. The pattern of behaviour seen here is like that observed in Fig. 5 and results from the same effects just described. It is interesting to note that the highest temperature of the building surface is attained when Uref = 6 m s−1 and θ = 0° in both the high and very high intensity cases.
Maximum temperature of the building surface plotted against terrain slope for Uref = 6 and 12 m s−1 and fire intensities: (a) 15 MW m−1, and (b) 4 MW m−1.

Fig. 7 shows how the area-weighted average radiative heat flux on the building varies with the downslope terrain angle. The pattern of behaviour in Fig. 7 is like that seen for the average convective temperature in Fig. 5. For both the 15 MW m−1 case (Fig. 7a) and the 4 MW m−1 case (Fig. 7b), the average radiant heat exposure decreases with downslope angle for Uref = 6 m s−1 and increases with downslope angle for Uref = 12 m s−1. For the 15 MW m−1 cases (Fig. 7a), the lower wind speed results in a greater average radiant heat exposure than the higher wind speed. This can be explained by the large flame tilt angle for the higher wind speed, which results in a smaller source of radiant heat compared with the more upright flames in the lower wind speed case. However, when θ ≤ −10°, the influence of the steeper slopes results in higher radiant heat exposures for Uref = 12 m s−1 compared with Uref = 6 m s−1. The 4 MW m−1 cases (Fig. 7b) exhibit similar behaviour, although the average radiant heat exposure is still higher for Uref = 6 m s−1 until θ ≤ −20°.
Area-weighted radiative heat flux Qrad on the building for the cases with Uref = 6 and 12 m s−1, and fire intensity values of: (a) 15 MW m−1 and (b) 4 MW m−1 for different downslope inclinations.
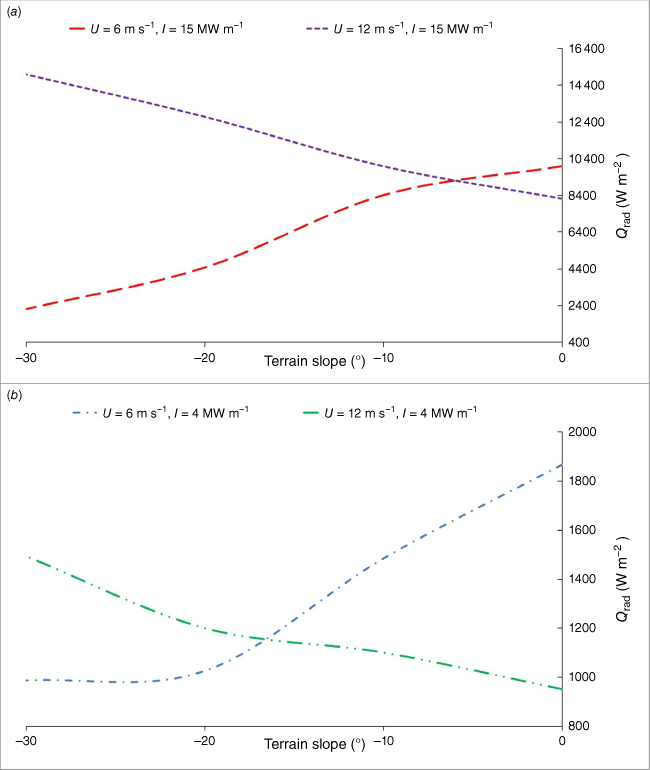
Fig. 8 shows how the maximum radiation exposure changes with downslope inclination. In all cases, except for Uref = 12 m s−1 and I = 15 MW m−1, the maximum radiation incident on the building surface decreases with downslope angle. For Uref = 12 m s−1 and 15 MW m−1, the maximum radiation exposure decreases from θ = 0° to −10°, where it attains a minimum, before steadily increasing through θ = −20° and −30°. Taken as a whole, these results highlight how the interaction between the contrary effects of wind and downslope inclination can influence the exposure of buildings to radiant and convective heat in ways that would be difficult to anticipate without the guidance of physical models.

Discussion and conclusions
In the present work, the effect of downslope terrain on fire line dynamics, convective temperature and radiant heat exposure for constant wind speeds and fire intensities in the presence of an idealised building structure was studied using CFD simulations. Downslope angles varied from 0° to −30° and a wind field with reference velocities of 6 and 12 m s−1 and fire intensities of 4 and 15 MW m−1 were considered. The simulations revealed that interactions between the contrary effects of wind and downslope inclination can expose the building to different levels of radiant and convective heating.
In summary, it was found that at a reference wind speed of 12 m s−1, buildings on steeper downslope inclinations are at an overall higher risk of bushfire attack (radiant and convective heating), whereas at a reference wind speed of 6 m s−1, buildings on steeper downslope terrain are at an overall lower risk of bushfire attack. This is at odds with guidance provided by the Australian Standard for Building in Bushfire Prone Areas AS3959, which generally rates buildings on steeper downslope inclines as being less prone to bushfire attack, regardless of ambient wind speed. The simulations presented here explicitly model the radiant and convective heat exposure of the building and incorporate more realistic combustion dynamics and interaction between the pyroconvective flows, the wind, the terrain and the structure itself. As such, the simulations highlight areas where building standards could potentially be improved and provide a way through which such improvements could be facilitated.
Although the Australian Standard predominantly considers radiant heat exposure as the main bushfire attack mechanism, there have been several studies that highlight the role of convective heating, especially when porous fuels are involved, or when dealing with building extremities (eaves, decks, etc.) where convective cooling can reduce the influence of radiant heating (Cohen and Finney 2022). The simulations presented here indicate that patterns of convective heat exposure at the building surface follow patterns similar to radiant heat exposure, though with some important differences when it comes to maximum exposure levels. The simulations presented here only considered a highly idealised building (a cube) without the presence of any extremities. Further work would be required to examine how convective heating might affect the likelihood of ignition of building extremities but could be done by modifying the current simulations to incorporate more realistic building structures.
The simulations presented here were all conducted with a constant radiation absorptivity coefficient, which corresponds to a uniform building material. However, the modelling approach could be adapted to consider the impact on different building materials by coupling the outcome of our simulations with Finite Element Analysis (FEA) of different materials under a variety of stress conditions to estimate the thermal load and predict the failure of such materials when exposed to radiant and convective heat.
The results presented here can be understood broadly in terms of the interaction of wind, fire intensity and downslope inclination. The interaction between wind and fire intensity can be expressed through quantities such as the Froude number or Bryam’s number (Sullivan 2007; Morvan and Frangieh 2018), and so it is possible that such measures could be used as a simple, practical way of characterising WUI risk regimes relating to different combinations of fire intensity, ambient winds and terrain inclination. These ideas will be pursued in further work.
Nomenclature
| g | Acceleration due to gravity |
| P | Pressure |
| T | Temperature |
| Lw | Width of the fire bed perpendicular to the wind |
| ui | Component of velocity in the i direction |
| Sct | Turbulent Schmidt number |
| R | Gas constant |
| δ | Kronecker delta |
| υ | Laminar viscosity |
| θ | Terrain angle |
| Zref | Reference height equal to the building height |
| Uref | Reference velocity |
| Ym | Mass fraction of species m |
| h | Enthalpy |
| Prt | Turbulent Prandtl number |
| Dc | Laminar diffusion coefficient |
| Average values of mass conservation | |
| αt | Thermal diffusion coefficient |
| Rc | Combustion rate of the fire line |
| ρ | Density |
| ωm | Production/sink rate of species m |
Data availability
The data that support this study will be shared on reasonable request to the corresponding author.
Acknowledgements
The current work was conducted with the assistance of resources provided by the National Computational Infrastructure (NCI) National Facility at the Australian National University through the National Computational Merit Allocation Scheme supported by the Australian Government.
References
Abouali A, Viegas DX, Raposo JR (2021) Analysis of the wind flow and fire spread dynamics over a sloped ridgeline hill. Combustion and Flame 234, 111724.
| Crossref | Google Scholar |
Akaotsu S, Ozawa R, Matsushita Y, Aoki H, Malalasekera W (2020) Effects of infinitely fast chemistry on combustion behavior of coaxial diffusion flame predicted by large eddy simulation. Fuel Processing Technology 199, 106226.
| Crossref | Google Scholar |
Bidabadi M, Montazerinejad S, Fanaee SA (2014) The influence of radiation on the flame propagation through micro organic dust particles with non-unity Lewis number. Journal of the Energy Institute 87, 354-366.
| Crossref | Google Scholar |
Butler B, Anderson W, Catchpole E (2007) Influence of slope on fire spread rate. In ‘The fire environment – innovations, management, and policy; conference proceedings’, 26–30 March 2007, Destin, FL. (Comps BW Butler, W Cook) Proceedings RMRS-P-46CD. pp. 75–82. CD-ROM. (Fort Collins, CO: USDA Forest Service, Rocky Mountain Research Station)
Canfield JM, Linn RR, Sauer JA, Finney M, Forthofer J (2014) A numerical investigation of the interplay between fireline length, geometry, and rate of spread. Agricultural and Forest Meteorology 189–190, 48-59.
| Crossref | Google Scholar |
Cohen JD, Finney MA (2022) Fuel particle heat transfer part 1: convective cooling of irradiated fuel particles. Combustion Science and Technology 1-27.
| Crossref | Google Scholar |
Cruz MG, Alexander ME, Fernandes PM, Kilinc M, Sil  (2020) Evaluating the 10% wind speed rule of thumb for estimating a wildfire’s forward rate of spread against an extensive independent set of observations. Environmental Modelling & Software 133, 104818.
| Crossref | Google Scholar |
Dupuy J-L, Maréchal J, Portier D, Valette J-C (2011) The effects of slope and fuel bed width on laboratory fire behaviour. International Journal of Wildland Fire 20, 272-288.
| Crossref | Google Scholar |
El Houssami M, Lamorlette A, Morvan D, Hadden RM, Simeoni A (2018) Framework for submodel improvement in wildfire modeling. Combustion and Flame 190, 12-24.
| Crossref | Google Scholar |
Fanaee A, Esfahani JA (2012) The normalized analysis of a surface heterogeneous reaction of a propane/air mixture into a micro-channel. Chinese Physics Letters 29, 124702.
| Crossref | Google Scholar |
Fanaee SA (2018) Self-similar non-asymptotic solution of multireaction stationary flow in catalytic microcombustor. Journal of Thermophysics and Heat Transfer 32, 560-569.
| Crossref | Google Scholar |
Fanaee SA, Esfahani JA (2014) The analytical modeling of propane–oxygen mixture at catalytic micro-channel. Heat and Mass Transfer 50, 1365-1373.
| Crossref | Google Scholar |
Ghodrat M, Shakeriaski F, Nelson DJ, Simeoni A (2021) Existing improvements in simulation of fire–wind interaction and its effects on structures. Fire 4, 27.
| Crossref | Google Scholar |
Hassan YA, Rice JG, Kim JH (1983) Comparison of measured and predicted thermal mixing tests using improved finite difference technique. Nuclear Engineering and Design 76, 153-160.
| Crossref | Google Scholar |
Hilton J, Garg N (2021) Rapid wind–terrain correction for wildfire simulations. International Journal of Wildland Fire 30, 410-427.
| Crossref | Google Scholar |
Kremer H, Schäfer G (1973) Rates of fuel conversion and heat release in turbulent combustion of methane–air mixtures in tunnel burners. Symposium (International) on Combustion 14, 707-717.
| Crossref | Google Scholar |
Le D, Labahn J, Beji T, Devaud CB, Weckman EJ, Bounagui A (2018) Assessment of the capabilities of FireFOAM to model large-scale fires in a well-confined and mechanically ventilated multi-compartment structure. Journal of Fire Sciences 36, 3-29.
| Crossref | Google Scholar |
Li B, Wan H, Gao Z, Ji J (2019) Experimental study on the characteristics of flame merging and tilt angle from twin propane burners under cross wind. Energy 174, 1200-1209.
| Crossref | Google Scholar |
Li B, Ding L, Simeoni A, Ji J, Wan H, Yu L (2021) Numerical investigation of the flow characteristics around two tandem propane fires in a windy environment. Fuel 286, 119344.
| Crossref | Google Scholar |
Manzello SL, Almand K, Guillaume E, Vallerent S, Hameury S, Hakkarainen T (2018) Forum position paper the growing global wildland–urban interface (WUI) fire dilemma: priority needs for research. Fire Safety Journal 100, 64-66.
| Crossref | Google Scholar |
Mell WE, Manzello SL, Maranghides A, Butry D, Rehm RG (2010) The wildland–urban interface fire problem – current approaches and research needs. International Journal of Wildland Fire 19, 238-251.
| Crossref | Google Scholar |
Menage D, Chetehouna K, Mell W (2012) Numerical simulations of fire spread in a Pinus pinaster needles fuel bed. Journal of Physics: Conference Series 395, 012011.
| Crossref | Google Scholar |
Mendes-Lopes JMC, Ventura JMP, Amaral JMP (2003) Flame characteristics, temperature–time curves, and rate of spread in fires propagating in a bed of Pinus pinaster needles. International Journal of Wildland Fire 12, 67-84.
| Crossref | Google Scholar |
Morvan D (2007) A numerical study of flame geometry and potential for crown fire initiation for a wildfire propagating through shrub fuel. International Journal of Wildland Fire 16, 511-518.
| Crossref | Google Scholar |
Morvan D, Frangieh N (2018) Wildland fires behaviour: wind effect versus Byram’s convective number and consequences upon the regime of propagation. International Journal of Wildland Fire 27, 636-641.
| Crossref | Google Scholar |
Noble IR, Gill AM, Bary GAV (1980) McArthur’s fire‐danger meters expressed as equations. Australian Journal of Ecology 5, 201-203.
| Crossref | Google Scholar |
Pourali M, Abolfazli Esfahani J, Fanaee SA, Kim KC (2021) Developing mathematical modeling of the heat and mass transfer in a planar micro-combustor with detailed reaction mechanisms. Journal of Thermal Analysis and Calorimetry 143, 2679-2694.
| Crossref | Google Scholar |
Richards PJ, Hoxey RP (2012) Pressures on a cubic building – Part 1: Full-scale results. Journal of Wind Engineering and Industrial Aerodynamics 102, 72-86.
| Crossref | Google Scholar |
Sullivan AL (2007) Convective Froude number and Byram’s energy criterion of Australian experimental grassland fires. Proceedings of the Combustion Institute 31, 2557-2564.
| Crossref | Google Scholar |
Sullivan AL, Sharples JJ, Matthews S, Plucinski MP (2014) A downslope fire spread correction factor based on landscape-scale fire behaviour. Environmental Modelling & Software 62, 153-163.
| Crossref | Google Scholar |
Sutherland D, Rashid MA, Hilton JE, Moinuddin KA (2023) Implementation of spatially-varying wind adjustment factor for wildfire simulations. Environmental Modelling & Software 163, 105660.
| Crossref | Google Scholar |
Tominaga Y, Mochida A, Yoshie R, Kataoka H, Nozu T, Yoshikawa M, Shirasawa T (2008) AIJ guidelines for practical applications of CFD to pedestrian wind environment around buildings. Journal of Wind Engineering and Industrial Aerodynamics 96, 1749-1761.
| Crossref | Google Scholar |
Viegas DX (2004) Slope and wind effects on fire propagation. International Journal of Wildland Fire 13, 143-156.
| Crossref | Google Scholar |
Wang Y, Chatterjee P, de Ris JL (2011) Large eddy simulation of fire plumes. Proceedings of the Combustion Institute 33, 2473-2480.
| Crossref | Google Scholar |
Wu Y, Xing HJ, Atkinson G (2000) Interaction of fire plume with inclined surface. Fire Safety Journal 35, 391-403.
| Crossref | Google Scholar |
Yang J, Zhang Y, Zhang P-h (2018) Numerical simulation on water mist fire suppression effects and mechanisms in hot and high humidity surroundings. Procedia Engineering 211, 881-887.
| Crossref | Google Scholar |
Zhao F, Liu Y (2021) Important meteorological predictors for long-range wildfires in China. Forest Ecology and Management 499, 119638.
| Crossref | Google Scholar |