

Multi-scale assessment of post-fire tree mortality models
Tucker J. Furniss A B E , Andrew J. Larson C , Van R. Kane D and James A. Lutz A B
A Wildland Resources Department, Utah State University, 5230 Old Main Hill, Logan, UT 84322, USA.
B The Ecology Center, Utah State University, 5205 Old Main Hill, Logan, UT 84322, USA.
C Department of Forest Management, University of Montana, Missoula, MT 59812, USA.
D School of Environmental and Forest Sciences, University of Washington, Box 352100, Seattle, WA 98195, USA.
E Corresponding author email: tucker.furniss@usu.edu
International Journal of Wildland Fire 28(1) 46-61 https://doi.org/10.1071/WF18031
Submitted: 2 March 2018 Accepted: 30 October 2018 Published: 3 December 2018
Journal compilation © IAWF 2019 Open Access CC BY-NC-ND
Abstract
Post-fire tree mortality models are vital tools used by forest land managers to predict fire effects, estimate delayed mortality and develop management prescriptions. We evaluated the performance of mortality models within the First Order Fire Effects Model (FOFEM) software, and compared their performance to locally-parameterised models based on five different forms. We evaluated all models at the individual tree and stand levels with a dataset comprising 34 174 trees from a mixed-conifer forest in the Sierra Nevada, California that burned in the 2013 Rim Fire. We compared stand-level accuracy across a range of spatial scales, and we used point pattern analysis to test the accuracy with which mortality models predict post-fire tree spatial pattern. FOFEM under-predicted mortality for the three conifers, possibly because of the timing of the Rim Fire during a severe multi-year drought. Locally-parameterised models based on crown scorch were most accurate in predicting individual tree mortality, but tree diameter-based models were more accurate at the stand level for Abies concolor and large-diameter Pinus lambertiana, the most abundant trees in this forest. Stand-level accuracy was reduced by spatially correlated error at small spatial scales, but stabilised at scales ≥1 ha. The predictive error of FOFEM generated inaccurate predictions of post-fire spatial pattern at small scales, and this error could be reduced by improving FOFEM model accuracy for small trees.
Additional keywords: fire mortality modelling; FOFEM; Rim Fire; Sierra Nevada mixed-conifer; Smithsonian ForestGEO; spatial patterns; Yosemite Forest Dynamics Plot.
Introduction
First-order fire effects models are essential tools used by land managers in fire-prone forest ecosystems. These models are used to estimate the direct effects of fire including tree mortality, soil heating, fuel consumption, and smoke production (Reinhardt and Dickinson 2010). Of particular interest to forest land managers are tree mortality models, which are used to estimate the probability of mortality for individual trees or proportion of mortality for stands (Woolley et al. 2012). These tree mortality models are used in post-fire landscapes to estimate fire severity and assess changes to stand structure, and to develop salvage marking and hazard tree guidelines (Hood et al. 2007). Mortality models are also used by managers in pre-fire applications to predict fire effects, conduct landscape-scale risk assessments, and to develop silvicultural prescriptions and prescribed fire treatments (Reinhardt and Dickinson 2010).
There are two main types of first-order tree mortality models: process-based models that use a mechanistic approach to simulate the processes involved in fire spread, heat-caused injury, and subsequent tree mortality (e.g. Michaletz and Johnson 2006), and empirical logistic regression models that use individual tree-level explanatory variables (e.g. bark thickness, crown base height, crown volume scorched (CVS)) to predict probability of mortality (e.g. Ryan and Reinhardt 1988). While process-based approaches have a strong theoretical basis and contribute to our understanding of exactly how a tree is killed by fire, the complexity of these models has precluded their widespread use among managers (Woolley et al. 2012), and their focus on direct fire damage fails to capture the suite of biological and ecological processes that contribute to delayed mortality 1 to 5 years post-fire (e.g. bark beetles and structural failure, Ryan and Amman 1996). Although empirical logistic regression models lack a mechanistic representation of tree mortality, their simplicity and implicit integration of both immediate and delayed mortality processes (mortality is typically assessed 3 years post-fire) have made them the most practical and widely accessible tool for modelling fire-related tree mortality among both researchers and land managers (e.g. Ryan and Amman 1994; Reinhardt and Crookston 2003; Sieg et al. 2006; Hood et al. 2007; Lutes 2016; Grayson et al. 2017).
Empirical logistic regression models are the foundation for the tree mortality models within widely used fire effects modelling software packages including the First Order Fire Effects Model (FOFEM), BehavePlus, and the Fire and Fuels Extension to the Forest Vegetation Simulator (FFE-FVS). Although over 100 logistic regression models for western North American conifer species have been developed (Woolley et al. 2012), the tree mortality models incorporated within these software packages are based on a single logistic regression model known as the Ryan and Amman (R-A) model. The R-A model was originally developed in the late 1980s by Ryan and Reinhardt (1988), refined by Ryan and Amman (1994), and most recently updated by Hood and Lutes (2017) who parameterised a set of 12 species-specific models that have been incorporated into FOFEM since version 5.7
The R-A model (hereafter FOFEMRA) is perhaps the single most widely used tree mortality model (Hood et al. 2007; Reinhardt and Dickinson 2010), but it is based on a relatively small sample of trees (n = 2356, Ryan and Reinhardt 1988) and is infrequently validated with independent data (see Hood et al. 2007 and Kane et al. 2017 for validations with many species, and see Ganio et al. 2015 and Ganio and Progar 2017 for validations for Pinus ponderosa and Pseudotsuga menziesii). The recent development of species-specific versions of this model (hereafter FOFEMSP) improved model performance and increased sample sizes for certain species (average n per species = 1403 trees, Hood and Lutes 2017), but validation of these species-specific models with independent data is still rare (but see Grayson et al. 2017 for a recent validation of FOFEMSP).
Additionally, the mortality predictions made with these empirical models are inherently reflective of the climatic conditions during which the parameterisation data were collected. As climate influences the susceptibility of trees to fire-related mortality (van Mantgem et al. 2013; Stephens et al. 2018), empirical models developed under past climates may under-predict mortality from fires that burn under hotter and drier conditions.
The FOFEMRA and FOFEMSP models were not parameterised with small-diameter stems (<10 cm diameter at breast height, DBH; there are two exceptions – the lower diameter limit was 8 cm for Pseudotsuga menziesii, Ryan and Reinhardt 1988; and 6 cm for ‘yellow pine’, Hood and Lutes 2017), and validation of these models with small stems is rare (but see Engber and Varner 2012 and Kane et al. 2017). Some studies have developed logistic mortality models specifically for small-diameter stems (e.g. Battaglia et al. 2009), but these studies did not conduct a validation of the exact models within FOFEM. Trees <10 cm DBH are more abundant than stems ≥10 cm DBH in many forests, especially if fire has been suppressed for many decades. They influence future fire behaviour and act as ladder fuels, and they are ecologically important as components of the understory (re-sprouters) or advanced regeneration (surviving conifers). Previous studies have found that crown scorch influences mortality differently for small-diameter stems compared with mature trees (Kolb et al. 2007; Engber and Varner 2012), and this interaction may compromise the accuracy with which FOFEM predicts mortality for small-diameter trees.
Previous validations of the FOFEMRA and FOFEMSP models have also not assessed how stand-level accuracy may vary across a range of spatial scales. Stand-level accuracy is typically assessed by grouping trees according to their probability of mortality, then calculating the proportion of observed mortality within each group (sensu Hood et al. 2007). Although this approach may be used to estimate stand-level accuracy without requiring a spatially-explicit (i.e. stem-mapped; Lutz et al. 2018a) dataset, it implicitly assumes that fire-related mortality is a spatially homogeneous process. As mechanisms of delayed fire mortality can be spatially auto-correlated (e.g. bark beetle activity is patchy, and trees may survive higher levels of fire damage if they are in a more mesic area), stand-level model accuracy may therefore be modified by the presence or absence of these neighbourhood-level variables. The positive and negative effects associated with spatially correlated mechanisms of delayed mortality may equalise if stand-level accuracy is assessed at a large enough scale, but the scale at which this happens remains unknown. A multi-scale assessment of stand-level accuracy would provide a more robust estimate of model performance, and would enable us to quantify the scale at which local neighbourhoods may modify delayed mortality.
Mortality models are often used in a pre-fire context to assess potential fire effects and plan restoration activity, but a challenge to using the FOFEM models in a pre-fire context is that they require metrics of fire injury as predictor variables. Out of over 100 models that have been developed (Woolley et al. 2012), we found no model that relies exclusively on pre-fire tree attributes to predict mortality. The reason for this is obvious – fire damage is an important determinant of fire-related mortality. However, this limits the utility of these models in pre-fire planning applications because fire-damage attributes must be estimated, and this introduces an additional layer of uncertainty when interpreting the model results and evaluating their predictive accuracy. Metrics of fire damage have been considered necessary to create acceptably accurate mortality models, but these metrics are often tightly correlated with tree attributes that may be measured pre-fire, such as diameter at breast height (Fig. S1, available as Supplementary material to this paper). Given this correlation, a pre-fire model based on diameter, species, and surface fuel loads may predict mortality with an acceptable level of accuracy, and this may be useful to managers seeking to model mortality in a pre-fire context.
A final area for improvement in empirical mortality modelling is to consider the accuracy of mortality models in predicting post-fire tree spatial patterns. Fire is a spatially explicit disturbance process (Meddens et al. 2018) and is an important driver of spatially structured stand dynamics in fire-adapted forests (Larson and Churchill 2012). Spatial pattern is a key element of forest structure (Lutz et al. 2013), and it has an important influence on forest heterogeneity, resilience, and future disturbance dynamics (Stephens et al. 2008). Restoring spatial patterns and heterogeneity characteristic of fire-prone forests has become a central aim of many forest restoration efforts throughout the western United States (e.g. Allen et al. 2002; North et al. 2007, 2009; Churchill et al. 2013), but to our knowledge the accuracy with which logistic mortality models scale up to predict post-fire tree spatial patterns has not been assessed.
Our objective was to advance the science of empirical fire mortality modelling in three ways. First, we conducted a validation of the widely used FOFEM tree mortality models with a sample size of 34 174 stems ranging from 1.0 cm to 200.7 cm DBH, and we assessed both the individual tree- and stand-level accuracy of these models. Second, we developed locally-parameterised logistic regression models based on CVS and DBH to estimate of the maximum accuracy these models may attain, and to compare how different model forms influence model performance across different diameter classes. Third, we developed methods for quantifying model accuracy at a range of spatial scales and assessing the accuracy with which mortality models predict fire-induced change in tree spatial patterns.
This study is unique among existing mortality modelling literature in that the dataset we used is a census rather than a sample. Previous mortality modelling studies generally sample post-fire forests across multiple regions and fire events, selecting a subset of trees to create a reasonably balanced sample across diameter and CVS classes. This approach is well suited to developing mortality models with broad applicability, but it is less optimal for validating those models because the dataset is balanced, but not representative. An optimal validation dataset includes a large number of stems, representing a wide range of diameters, in proportion to their abundance in a particular forest type. A validation with this type of dataset permits mortality models to be tested in a context similar to how they are used by managers – to predict structural and compositional changes to a specific forest following fire. Model accuracy may then be assessed in terms of ‘percentage error’ by diameter class, a metric with very tangible implications for managers using mortality models to estimate fire effects at the stand scale. In this study, we conduct the first validation of FOFEM using a complete census of trees ≥1 cm DBH from a large-scale permanent forest plot.
Methods
Study area
We conducted this study in the lower montane, mixed-conifer zone of the Sierra Nevada, CA, USA (Fig. 1a). We used data from the Yosemite Forest Dynamics Plot (YFDP; Lutz et al. 2012, 2014b), a 25.6-ha plot affiliated with the Smithsonian ForestGEO network (Anderson-Teixeira et al. 2015; Lutz 2015). The YFDP is located in an old-growth (oldest trees >500 years old) Abies concolor–Pinus lambertiana (white fir–sugar pine) forest between 1774 and 1911 m elevation (Fig. 1b, c) with species composition representative of the Sierra Nevada white fir superassociation (Keeler-Wolf et al. 2012). Within the YFDP, all tree stems ≥1 cm DBH were tagged, identified, mapped in 2009 and 2010 (n = 34 458 live stems; Lutz et al. 2012), and tree status was updated in June 2013, 2 months before the YFDP burned. We considered the five most abundant species within the YFDP: white fir (Abies concolor [Gordon] Lindl. ex Hildebr.; 939 stems ha−1), sugar pine (Pinus lambertiana Douglas; 180 stems ha−1), Pacific dogwood (Cornus nuttallii Audobon; 106 stems ha−1), incense cedar (Calocedrus decurrens [Torr.] Florin; 64 stems ha−1), and California black oak (Quercus kelloggii Newb.; 46 stems ha−1). Although A. concolor was the most abundant species, P. lambertiana had approximately the same pre-fire live basal area (30.6 and 28.8 m2 ha−1 respectively) and was the most abundant large-diameter (≥100 cm DBH) stem (n = 343 stems, Table 1).

|

|
The historical (pre-suppression) fire regime in lower mixed-conifer forests of the Sierra Nevada was characterised by frequent (fire-return intervals ranging from 5 to 32 years, Caprio and Swetnam 1995), relatively small (median area = 115 ha, Scholl and Taylor 2010), low- to moderate-severity fires (van Wagtendonk and Fites-Kaufman 2006). In the modern post-suppression era, fires in Sierra Nevada forests have become larger in overall size and have greater proportions of moderate and high severity (van Wagtendonk and Lutz 2007), and this trend is predicted to continue as winter snowpack declines (Lutz et al. 2009). Prior to 1900, the mean fire-return interval in the YFDP was 29.5 years, with the last widespread fire occurring in 1900 (Barth et al. 2015).
The YFDP was burned on 1–2 September 2013 in a management-ignited fire set to control the spread of the Rim Fire, a large wildfire that burned 104 131 ha of Stanislaus National Forest and Yosemite National Park (Fig. 1b; Lydersen et al. 2014). The ignition occurred in the afternoon in a mixed-forest–chaparral vegetation type atop the Crane Flat lookout ~1 km from the plot, and no management action was taken within the YFDP before or after ignition. The fire backed downslope through the western portion of the plot during the night of 1 September, and burned upslope through the remaining eastern portion the following day (Larson et al. 2016). The fire was active within the YFDP for ~30 h, although smouldering continued in some large coarse woody debris through November 2013 (T. Furniss and J. Lutz, pers. obs.). Fire intensity ranged from low- to high-intensity surface fire with some crown torching (based on Fire Behaviour Assessment Team cameras and thermocouples, Lutz et al. 2017a; Fig. 1c). Surface fuel consumption was 95% for litter, 93% for duff, 90% for 1 h fuels, 86% for 10 h fuels, 96% for 100 h fuels, and 61% for ≥1000-h fuels (Larson et al. 2016). Although the fire was management ignited, satellite-derived fire severity (Fig. 1c) was consistent with recent fires in the mixed-conifer zone of the Sierra Nevada (van Wagtendonk 2007; van Wagtendonk and Lutz 2007; Lutz et al. 2009), and the area that was management ignited was found to be indistinguishable from the wildfire-ignited area within the fire footprint (except for that portion that was plume-dominated) using a wide range of remote sensing techniques (Kane et al. 2015).
In May 2014, we revisited every stem in the YFDP and measured CVS, DBH, and live or dead status (hereafter ‘immediate fire mortality’). We also conducted full mortality censuses in the summers of 2015 and 2016 to measure delayed fire-related mortality (i.e. mortality of trees that survived >1 year post-fire). We considered ‘mortality’ as the aboveground death of individual stems, a method that overestimates mortality of some hardwood species that are fire-adapted to re-sprout post-fire. Considering this, we also recorded whether C. nuttallii and Q. kelloggii individuals were sprouting post-fire.
Model parameterisation
For each species, we extracted the corresponding logistic model forms and regression coefficients used in the FOFEM software (Lutes 2016). Species-specific models based on CVS were available for A. concolor, P. lambertiana, and C. decurrens (FOFEMSP; Hood and Lutes 2017). Species-specific models were not available for Q. kelloggii and C. nuttallii, so we used the default model (FOFEMRA; Ryan and Reinhardt 1988). The FOFEMRA model uses two independent variables, CVS and bark thickness (BT), where BT is calculated according to the function DBH × Vsp, where Vsp is a species-specific coefficient (table 4.76 in Reinhardt and Crookston 2003).
We created locally-parameterised models based on the same independent variables and general model forms used in FOFEM, but with re-parameterised coefficients. For each species, we created 1st, 2nd, and 3rd order polynomial models with CVS as the single independent variable and 3-year post-fire status as the binomial response variable (as with FOFEMSP), and we chose the model with the minimum Akaike information criterion (AIC) as our final ‘CVS’ model. For Q. kelloggii and C. nuttallii, we created optimised models with both BT and CVS as independent variables, but we eliminated BT from our final models because we attained a better fit using CVS alone. All models we created were generalised linear models with a logit link and the logistic model form:
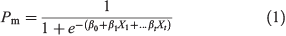
where Pm is probability of mortality (within 3 years), e is the base of the natural logarithm, β0 – βt are regression coefficients, and X1 – Xt are predictor variables (e.g. CVS, CVS2). We fit each model using the iteratively reweighted least-squares method of maximum likelihood estimation; model coefficients may be found in Table S1 (available as Supplementary material to this paper).
Upon preliminary analysis, we found that the third-order polynomial equations typically used in logistic mortality modelling often resulted in non-monotonic fits to our data (i.e. a tree with 25% CVS had a higher modelled probability of mortality, Pm, than a tree with 50% CVS; Fig. S2, available as Supplementary material to this paper). This may have been caused by the combination of two factors: tree DBH was negatively related to CVS (Fig. S1), and large-diameter trees can be more susceptible to fire damage compared with small trees (Kolb et al. 2007). The higher relative proportion of large-diameter trees at low CVS levels may have inflated Pm (20–30% CVS; Fig. S2), whereas the higher proportion of medium-sized trees may have reduced Pm for intermediate CVS levels (40–60% CVS; Fig. S2). This suggests that the dip in Pm is an artefact related to the interaction between CVS and DBH, and may not reflect the true physiological relationship between CVS and Pm for trees of the same size. Although there are multiple mechanisms through which fire damage may lead to mortality (e.g. reduced photosynthesis, Smith et al. 2016, 2017; increased susceptibility to beetles and pathogens, Parker et al. 2006; Hood and Bentz 2007), these mechanisms are all positively related to fire damage. In other words, a tree with more fire damage will have greater reduction to photosynthetic ability and be more susceptible to biotic mortality agents, and both of these indirect fire effects will increase probability of mortality. We resolved this problem in three different ways: we rarefied our dataset by CVS, we created additional CVS-based models that were constrained to be monotonic (i.e. no dip), and we created CVS-based models with a CVS : DBH interaction term. We rarefied our dataset by 20% CVS bin (10% bins used at high and low limits) by randomly selecting n trees from each CVS bin, where n is the minimum number of trees in any of the bins (n per species reported in Table 1). This rarefaction procedure reduced the severity of the dip, but it did not remove it entirely (Fig. S2). To reduce the dip completely, we developed an alternative CVS-based model form that was constrained to be monotonically increasing (slope was not held constant, but was always positive). This alternative model (CVSmono) used CVS and CVS2 terms to fit the lower range of CVS values, but replaced the CVS3 term with a higher-order polynomial (e.g. CVS8). Removing the CVS3 term removed the dip, and the high-order polynomial gave the curve an inflection point and a steep increase in predicted Pm values above the inflection. The power of the polynomial was chosen using an iterative procedure beginning with the lowest value necessary to obtain a monotonic fit (CVS4 or CVS5) and raising the power by one until minimum AIC was reached. As we increased the power of the polynomial, the inflection point moved to the right and the slope of the curve beyond the inflection point became steeper. We dropped the CVS2 term if we obtained a better AIC without it. Although this approach is novel, it was the most tractable way could find to constrain a logistic model to be monotonically increasing. Full R code developed for this model fitting procedure in the Supplementary material.
The final method we used to address the interaction between CVS and DBH was to develop additional CVS-based models which included both DBH and CVS : DBH interaction terms (one interaction term per CVS polynomial level; CVS : DBH, CVS2 : DBH, and CVS3 : DBH). In previously developed CVS-based mortality models, DBH has often been omitted because CVS and DBH can be co-linear, and dropping the DBH term may actually improve AIC (this was the case with FOFEMSP; Hood and Lutes 2017). However, eliminating the DBH term ignores any possible interactions between CVS and DBH (e.g. Kolb et al. 2007; Engber and Varner 2012), and this may bias CVS-based models to be less accurate for large-diameter trees (which are less abundant).
To facilitate comparisons with previous studies, we created one final CVS model based only on trees ≥10 cm DBH (CVSgt10). Lastly, we generated species-specific mortality models using pre-fire DBH as the single predictor. In total, we evaluated and compared six models for each species: FOFEM (FOFEMRA for Q. kelloggii and C. nuttallii and FOFEMSP for all other species), four locally-parameterised CVS-based models (CVS, CVSmono, CVS + DBH and CVSgt10) and a locally-parameterised DBH model (DBH). All CVS-based models were parameterised using the rarefied dataset.
Model validation
We validated all models using 10-fold cross validation (sensu Regelbrugge and Conard 1993; Hood and Lutes 2017) to minimise the bias associated with parameterising and validating models using the same dataset (Kohavi 1995). We performed this procedure by first partitioning our data into 10 random groups. We then used nine groups to parameterise each model and generate predictions for the trees in the 10th group. This process was repeated 10 times, leaving out a different group each time. The resulting model prediction for each tree is therefore based on a model that was parameterised using a different subset of the data. Although models were parameterised using the rarefied dataset, we used the full dataset to validate each model.
We summarised model performance in three ways: individual tree-level accuracy (correctly classifying individual stems), stand-level accuracy (predicting the proportion of mortality per species and diameter class), and accuracy in predicting post-fire tree spatial pattern. A key distinction between these three levels is that individual tree metrics use the model response value (Pm) as a binomial classifier thus requiring a cut-off threshold (e.g. trees with Pm ≥0.5 are predicted to die whereas trees with Pm <0.5 are predicted to survive). Stand-level and spatial pattern accuracy may be summarised by using Pm as continuous probability value (e.g. for trees with Pm = 0.8, 80% will be predicted to die).
Individual tree accuracy
We assessed individual tree-level model accuracy by calculating sensitivity (correctly identified mortalities), specificity (correctly identified survival), overall accuracy (percentage correctly categorised), ΔAIC (AIC for each model – the lowest AIC value) and area under the Receiver Operating Characteristics (ROC) curve (AUC). We used a threshold Pm value of 0.5 to classify tress as live or dead.
Although individual tree-level metrics are widely used to evaluate mortality model accuracy (e.g. Grayson et al. 2017), these metrics may not be simply scaled up to evaluate stand-level performance. In other words, a model may have high individual-tree accuracy while simultaneously systematically over- or under-predicting mortality at the population or forest stand level. The strength of stand-level model accuracy assessment is that it permits the evaluation and comparison of mortality models in a way that describes observable changes in forest structure following fire. For example, a model may accurately predict small-diameter mortality while under-predicting large-diameter mortality (due to large-diameter trees having unique vulnerabilities to fire damage, Kolb et al. 2007). This model would have high individual-level accuracy because small-diameter trees are abundant and individual accuracy metrics weight all trees equally, but it would not be reliable for predicting mortality of large-diameter trees. Large-diameter trees represent an ecologically unique element of forest structure (Lutz et al. 2018b), and accurately predicting their fate following fire is important for improved predictions of aboveground biomass and carbon storage (sensu Lutz et al. 2017b).
Stand-level accuracy
We used individual-tree model response values to scale up our predictions to the population-level for each species. Although this analysis was based on populations (grouped by species), we refer to this scale as ‘stand level’ to maintain consistency with previous studies (sensu Hood et al. 2007). We assessed model accuracy by grouping trees by species and diameter and calculating percentage error as:

where Nmodel is the number of modelled mortalities, Nobs is the number of observed mortalities, and Nbin is the number of trees in each diameter class. This approach is similar to the method used by Hood et al. (2007) to assess stand-level accuracy, but we grouped stems by diameter class rather than by Pm (sensu Kane et al. 2017). This allows us to evaluate model performance across a range of diameter classes rather than across the range of Pm values. The number of dead trees predicted were identified for each model by assigning a status of either live or dead based on the continuous value of Pm for that individual stem (e.g. a stem with a Pm of 0.85 has an 85% chance of being identified as a dead tree), and these dead trees were summed for each bin.
Multi-scale stand-level accuracy
We summarised stand-level accuracy across a range of spatial scales by sampling trees within randomly located quadrats within the YFDP ranging in area from 0.04 ha (20 × 20 m) to 2.56 ha (160 × 160 m). We sampled 10 quadrats of each size without replacement and calculated the stand-level error for all trees within each quadrat. There are two potential sources of this stand-level error: (1) small spatial scales include few trees, and there is more stochastic error because there is higher variability between sample means for smaller samples compared with larger samples, and (2) spatially correlated error due to the spatial autocorrelation of agents of delayed mortality. In other words, trees with the same level of fire damage may die at different rates if they are on a ridge v. in a drainage, or if they are in a beetle-kill patch v. a patch with no beetles. As mortality models predict mortality based only on individual tree properties, these neighbourhood-level factors affecting mortality contribute to model error.
To differentiate between these two sources of error, we used a null model designed to capture stochastic error (due to small sample size) but not spatially correlated error. We created this model by pairing each spatially explicit sample with a non-spatial sample of the same number of trees, randomly selected from the entire YFDP. This null model may be interpreted as the amount of error due to small sample sizes, and any excess error is attributable to spatially correlated processes that modify the probability of mortality for all trees within a given area.
We note that spatially correlated error is not the same as patchiness in fire effects: patchy fire behaviour is largely captured by tree-level metrics of fire damage such as CVS (resulting in spatially correlated mortality, but not necessarily model error), whereas spatially correlated error describes model error due primarily to the spatial signature of factors influencing delayed mortality.
Spatial pattern accuracy
We further scaled our assessment of model performance to the community level by evaluating live tree spatial patterns for the entire forest community (all species grouped). We assessed post-fire spatial pattern accuracy by quantifying and comparing pre-fire, post-fire, and modelled post-fire spatial patterns of trees within the YFDP. We used two methods: clump size analysis, a method of local pattern analysis often used to characterise spatial patterns in frequent-fire forest ecosystems (Plotkin et al. 2002; Larson and Churchill 2008); and spatial point pattern analysis, a method that has been used to infer ecological process in a variety of contexts (e.g. Lutz et al. 2014a; Larson et al. 2015; Furniss et al. 2017).
For the clump size analysis, we summarised spatial pattern as the number of clumps of trees as a function of clump sizes (i.e. number of clumps with 2 trees, 3 trees, 4 trees, etc.). We used an inter-tree distance threshold of 6 m to identify distinct clumps (i.e. clumps are groups of trees which are spaced no further apart than 6 m), as this was a found to be an optimal distance by Churchill et al. (2013). We compared each model by generating 99 simulations of mortality (where each tree was assigned a status of live or dead based on Pm) to obtain an estimate of the amount of variability in the modelled spatial pattern for each model.
For the point pattern analysis, we summarised spatial patterns with the pair correlation function (PCF), g(r), a point pattern summary statistic that describes the second-order characteristics of a spatial pattern across a range of scales (Wiegand and Moloney 2004). The PCF is defined as:
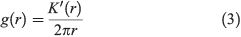
where K′(r) is the derivative of Ripley’s K function (Ripley 1976). To summarise observed patterns, we calculated gpre(r) based on the pattern of trees that were alive pre-fire in 2013, and gpost(r) based on the pattern of trees that survived for at least 3 years post-fire (live as of 2016). We quantified model accuracy in predicting post-fire spatial patterns by generating 99 simulations of mortality for each model (where mortality was re-assigned for each simulation, as with the clump analysis), and gmodel(r) was calculated for the set of ‘surviving’ trees for each of these simulations. We generated simulation envelopes (Baddeley et al. 2014) based on the minimum and maximum values from these simulations, and an estimate of the true value of gmodel(r) based on the mean value from the simulations. We calculated change in pattern by gpost(r) – gpre(r). We compared the observed and modelled patterns to the null model of complete spatial randomness (CSR; Wiegand and Moloney 2004) for the static patterns, gmodel(r), and the null model of ‘no change’ for the differenced patterns, gpost(r) – gpre(r).
For the multi-scale accuracy and spatial pattern analyses, we omitted two of the CVS-based models (CVS, CVSmono, and CVSgt10 all performed similarly; we retained the best one) to maintain interpretability of the figures. Analyses were conducted in R (ver. 3.4.1, R Foundation for Statistical Computing, Vienna, Austria, https://cran.r-project.org, accessed 7 November 2018) using the spatstat package (ver. 1.52–1; Baddeley et al. 2015; http://www.spatstat.org, accessed 7 November 2018).
Results
Out of 34 174 pre-fire stems (1 cm ≤ DBH < 201 cm), there was immediate mortality of 24 151 stems and delayed mortality of 3818 stems (Table 1). The mean CVS for immediate mortalities was 99.7%, 66% for delayed mortalities, and 23% for surviving trees (Fig. S3, available as Supplementary material to this paper). The mean CVS for trees ≥1 cm DBH was 82%, 19% for trees ≥50 cm DBH, and 12% for trees ≥100 cm DBH. Mortality rates (3-year rates) by diameter class were 82% for trees ≥1 cm DBH, 63% for trees ≥50 cm DBH, and 28% for trees ≥100 cm DBH. Mortality rates for conifers were 84% for A. concolor, 77% for P. lambertiana, and 71% for C. decurrens (Table 1). Mortality rates for the hardwoods were 82% for C. nuttallii and 69% for Q. kelloggii, although 19% of top-killed C. nuttallii and 70% of top-killed Q. kelloggii were re-sprouting post-fire. The mean (and median) DBH was 7.4 cm (5.2 cm) for immediate mortality, 24.8 cm (18.1 cm) for delayed mortality, and 35.1 cm (25.9 cm) for surviving trees.
Individual tree accuracy
The locally-parameterised CVS-based models had the best AIC and higher overall accuracy compared with FOFEM and DBH-based models (Table 2). Adding a DBH interaction term (CVS + DBH model) improved AIC for A. concolor, but did not improve AIC for other species. The monotonic CVS model (CVSmono) improved AIC for all conifers (Table 2). Although the AIC of the FOFEM models was worse than the AIC of the locally-parameterised CVS models, overall accuracy (i.e. total percentage correct) of FOFEM was similar for all three gymnosperms.

|
Stand-level accuracy
Considering stand-level accuracy, the DBH model was the best model for small- to medium-diameter trees (<20 cm DBH) of most species (Table 2). For A. concolor, the DBH model was the most accurate for stand-level predictions for all diameter classes. For P. lambertiana, the FOFEMSP model was best for stems <10 cm DBH, the CVS models were best for stems 10 ≤ DBH <100, and the DBH model was most accurate for stems ≥100 cm DBH. Adding the DBH interaction term improved model performance considerably for A. concolor, compared with CVS-based models without the interaction term. The DBH interaction term did not improve performance for most size classes of C. decurrens and P. lambertiana, but the CVS + DBH model did improve accuracy by 2% for large-diameter C. decurrens and P. lambertiana (>100 cm DBH; Table 2). In contrast, the CVS + DBH model decreased model accuracy for the largest stems of both hardwood species. The CVSmono model was more accurate than the non-monotonic CVS model for stems <20 cm among all species, but the two CVS models were generally equivalent for larger diameter classes (Table 2, Fig. 2). The CVS models based only on stems ≥10 cm (CVSgt10) were generally equivalent to the base CVS model for stems ≥20 cm DBH, but accuracy was worse for stems <20 cm DBH and all sizes of Q. kelloggii.

|
Stand-level accuracy of the FOFEM models was within 15% of observed mortality for A. concolor, C. decurrens and P. lambertiana <40 cm DBH, but mortality was consistently under-predicted (Table 2, Fig. 2). FOFEM under-predicted large-diameter (≥100 cm DBH) P. lambertiana mortality by 17% and over-predicted mortality for Q. kelloggii and C. nuttallii, especially for stems ≥10 cm DBH (18–32%).
Multi-scale accuracy
Stand-level error was negatively related to spatial scale (Fig. 3a–d). We observed this pattern for all models, as well as for each null model. The decreasing error in the null models indicates that some of the error was due to the small number of trees included in the spatial samples at small scales. As spatial scale increased, sample size grew and error in the null model was reduced. However, we also observed additional error in the spatially explicit samples that was greater than the error captured by the null models, indicating that there was spatially correlated error. The CVS-based models were the most accurate at small scales, predicting mortality within 10% of observed levels at all scales >0.1 ha. Model error for FOFEM and the DBH model fell within 10% at scales >1.4 and >1.2 ha respectively, but the DBH model had much greater error at scales <1 ha.

|
Spatial pattern accuracy
The fire decreased the number of clumps from 3 to 1 ha−1 for clumps of 5–20 trees, and mean clump size decreased from 10 to 7 trees per clump. All models accurately predicted this change (Fig. 3e), although the FOFEM model slightly overestimated the number of clumps at clump sizes ranging from 5 to 26 trees per clump. We were not able to differentiate the CVS- or DBH-based models from the observed pattern using the clump size analysis.
The spatial pattern of live stems within the YFDP became more aggregated after the fire (Fig. 3f). Both the CVSmono and CVS + DBH models accurately predicted this change in pattern, although the magnitude of the observed increase in aggregation was greater than the models predicted, especially at small scales (0 to 2 m; Fig. 3g). The CVSmono model had the greatest spatial pattern accuracy: the mean value of g(r) from the 99 simulations was the closest to the observed post-fire pattern, and this was the only model for which the observed value of gpost(r) – gpre(r) fell within the model’s simulation envelope (at r >2 m; Fig. 3f, g). In contrast to the observed increase in aggregation post-fire, the DBH and FOFEM models both predicted reduced aggregation at small scales post-fire (Fig. 3g). Although FOFEM correctly predicted increased aggregation at spatial scales >1.5 m, the DBH model predicted increased dispersion at all scales 0 to 10 m.
Discussion
Model validation
Mortality of individual trees was predicted with a high degree of accuracy by all CVS-based models (CVS, CVSmono, CVSgt10, CVS + DBH, and FOFEM; Table 2). Indeed, CVS is a direct measure of physical damage incurred during the fire, and this damage is closely related to tree death (Peterson 1985; Weatherby et al. 1994; Sieg et al. 2006). This result is intuitive and expected, and it supports decades of previous work that have focussed on CVS as a key parameter in empirical mortality models (Ryan and Reinhardt 1988; Woolley et al. 2012; Hood and Lutes 2017; Grayson et al. 2017).
Immediate mortality was composed almost entirely of trees with 100% CVS, whereas delayed mortality was dominated by trees with lower CVS (Fig. S3). Mortality models based on 3-year mortality (such as FOFEM) are not well calibrated to predict immediate mortality, as they will over-predict mortality for trees with CVS <100% (Fig. S3). The FOFEMSP models more closely reflected the observed patterns in delayed mortality for most species, as to be expected because they were parameterised based on 3-year mortality. We used 3 years as the cut-off for delayed mortality to maintain consistency with previous studies, although recent work has suggested that this timespan may not be sufficient to fully capture all delayed mortality (van Mantgem et al. 2011).
Although the FOFEMSP models had high individual-tree accuracy, they under-predicted mortality at the stand level for A. concolor, C. decurrens, and P. lambertiana by 2 to 18% (Table 2, Fig. 2). A possible explanation for this is that the Sierra Nevada experienced a multi-year drought from 2012 to 2015 (Belmecheri et al. 2016), and this may have exaggerated mortality (e.g. Stephens et al. 2018). The extent to which fire-related mortality was affected by the drought is impossible to quantify for the YFDP, and a thorough analysis of the interactive effects between bark beetles, drought, and fire on tree mortality in the Sierra Nevada will require a multi-plot analysis that is beyond the scope of this study. Other studies have found that pre-fire climate appears to have a stronger influence on fire-related mortality than does post-fire climate (van Mantgem et al. 2013), suggesting that the timing of the Rim Fire early in the drought may have reduced the potential confound between drought- and fire-induced mortality.
This reveals an important question: will mortality models developed under non-drought conditions be useful in predicting mortality for fires that occur in a future climate characterised by greater drought stress? Although we cannot quantify the degree to which drought influenced mortality, we found that mortality models parameterised for past climates may under-predict mortality when fire events are coupled with multi-year drought. As climate warms and drought becomes more frequent, mortality models may need to be revised to reflect the modified relationship between fire damage and mortality probability under a drier climate. This may be done through re-parameterising models using fires that burned during a drought (as in the present study), or by explicitly including climatic variables as independent variables (more challenging, but more adaptable). Addressing this issue is a high priority for management-oriented modelling research, as the suitability of existing mortality models may decline as the co-occurrence of drought and fire becomes increasingly frequent.
In contrast to the under-prediction of mortality for conifers, the FOFEMRA model greatly over-predicted stand-level mortality of C. nuttallii and Q. kelloggii by 5 to 32% (Table 2). Even for stems with 0% CVS, the FOFEMRA model predicted a 72% chance of mortality for Q. kelloggii and 84% chance of mortality for C. nuttallii, but observed mortality was <10% for stems with 0% CVS for both species (Fig. 2). This is consistent with Kane et al. (2017) who found FOFEM over-predicted mortality for three hardwood species (including Q. kelloggii). Our observation that 70% of top-killed Q. kelloggii re-sprouted post-fire indicates that aboveground stem death may not be an appropriate measure of mortality for individuals of re-sprouting species. Re-sprouting individuals have an important effect on post-fire regeneration by rapidly sprouting new stems that grow much faster than conifer seedlings post-fire, and these sprouts maintain spatial pattern of the parent trees. Other studies have observed this discrepancy between actual mortality and top-kill (e.g. Catry et al. 2013), although most mortality models are primarily focussed on top-kill. This result underscores the need to develop more species-specific models for FOFEM, and the need to consider multiple types of mortality for hardwoods.
Individual tree v. stand-level accuracy
Surprisingly, the high individual-tree accuracy did not always translate into high stand-level accuracy, and this discrepancy highlights the importance of multiple tests of model performance. This was especially evident with the FOFEM models, which generally performed well at the individual tree level but had high stand-level error for some species and diameter classes. Although this has been considered elsewhere (e.g. Hood et al. 2007; Belote et al. 2015), individual-tree accuracy dominates the literature as the most widely used method for model parameterisation, validation, and comparison (e.g. Hood and Lutes 2017; Grayson et al. 2017). These results support the inclusion of stand-level accuracy metrics in future model development as this permits the explicit consideration of model accuracy for rare but important subpopulations such as large-diameter trees. The disparity between individual and stand-level accuracy should also be considered when using mortality models for stand-level inference and management decisions such as post-fire salvage harvest.
CVS : DBH interaction
Pre-fire models based on DBH alone were often more accurate than the CVS-based models at the stand-level, most notably in predicting mortality of A. concolor and large-diameter P. lambertiana (Table 2). Although this may be partially explained by the tight correlation between CVS and DBH (Fig. S1), DBH should not perform better than CVS if it is primarily acting as a proxy for CVS. An alternative explanation is that there could be an interaction between CVS and DBH at large diameters that is not captured by using CVS alone (McHugh and Kolb 2003; Kolb et al. 2007). In other words, a small-diameter stem with 80% CVS may not have the same Pm as a large-diameter stem with 80% CVS. The presence of a CVS : DBH interaction also explains why stand-level accuracy was generally higher for the CVS + DBH model compared with CVS alone.
Interestingly, despite the improved stand-level performance of the CVS + DBH, AIC was best for CVS alone (all species except A. concolor). Standard model selection procedures are generally based only on AIC, and would therefore select the CVS model without a DBH term (sensu Hood and Lutes 2017). Although this maximises AIC, our results demonstrate AIC does not necessarily correlate with stand-level accuracy, especially for large-diameter trees. To maximise model accuracy across a broad range of tree diameters, we suggest evaluating models based on stand-level accuracy in addition to AIC, and including a DBH interaction term to account for the known interactive effects between CVS and DBH.
The high accuracy of the DBH model at the stand level suggests that post-fire data may not be necessary to develop an acceptable stand-level mortality model. However, as DBH does not implicitly capture fire behaviour as CVS does, site-specific fuel information (e.g. surface fuel loads) would have to be incorporated to calibrate the model for use in different forests. The resulting model would be similar to a CVS-based model used in a pre-fire context, which relies on a separate model to predict scorch height based on fuel levels. This would enable users to assess mortality as a function of DBH rather than CVS, and this may be useful for managers seeking to minimise (or maximise) mortality for specific diameter classes.
A problem we encountered with the DBH models is that standard logistic model forms did not represent the data well. First-, second-, and third-order polynomial models all predicted low Pm values (0 to 0.1%) at the large end of the diameter range for all conifer species, whereas the data show the true proportion of mortality was closer to 50% (Fig. S4, available as Supplementary material to this paper). We expect the true probability of mortality to be minimised for intermediate diameters and to increase for trees at the upper diameter range (e.g. McHugh and Kolb 2003). There are a few possible explanations for this: large-diameter trees often have cavities and scars from previous fires that can serve as an entry point for flames and embers and can lead to mechanical failure (7 out of 20 immediate mortalities >100 cm DBH were due to mechanical failure at a fire scar); they often have large-duff mounds around the base that can smoulder and cause prolonged soil heating at the root crown (Varner et al. 2009), and they may be more susceptible to beetle attack and drought post-fire (Hood and Bentz 2007; Kolb et al. 2007). Alternative approaches such as using constrained linear regression to predict the proportion of mortality (based on binned data) offer more control over the shape of the model response curve (compared with logistic regression), and this may result in models that more closely reflect the observed shape of the DBH–mortality response curve.
Monotonic v. third-order polynomial models
The standard third-order polynomial CVS models predicted individual-tree mortality with a high degree of accuracy, but the CVSmono models improved individual and stand-level accuracy for all conifers in this study (Table 2). Graphical representations of these models demonstrate differences in the fundamental shape of these two model forms (Fig. 2, S2). The third-order polynomial models had a dip in Pm values in the middle of CVS range whereas the CVSmono models had a steady increase (e.g. P. lambertiana) or a slight plateau (e.g. A. concolor). Although there may be a biological basis for a plateau in Pm at intermediate CVS levels, a negative relationship is biologically implausible. Fitting monotonic models solved this problem while still capturing the subtleties of the underlying data that would have been lost by using a simple linear formula (e.g. low slope at low CVS, steep slope at upper CVS). Additionally, CVSmono models maintained high Pm for trees with 100% CVS whereas rarefied CVS models reduced Pm, causing the CVS models to under-predict mortality for trees with 100% CVS. Although the exact monotonic models we generated may not be broadly applicable to other sites as the position of the inflection point (determined by the power of the polynomial and the coefficients) may be highly susceptible to specific sites and fire events, we suggest a monotonic model form as an alternative if the common third-order polynomial model form results in a non-monotonic fit. Monotonic CVS models were more accurate at all scales, and they bear more relevance to the underlying processes determining mortality.
Multi-scale accuracy
Stand-level accuracy was dependent on spatial scale for all models. We were able to partition this error into two categories: error due to small sample size (this error is represented by the null models; grey regions in Fig. 3a–d) and spatially correlated error (this error is represented by the coloured areas outside of the grey regions in Fig. 3a–d). We were not able to identify the mechanisms driving the spatially correlated error, but there are a few plausible explanations based on the spatially explicit nature of ecological processes that mediate delayed mortality. For example, imagine two stands that were burned identically; FOFEM will predict the same probability of mortality for each tree, and the same proportion of mortality at the stand level. If one of these stands experienced a bark beetle attack immediately post-fire whereas the other stand did not, the FOFEM mortality prediction will be too low for the stand that was attacked by beetles (and too high for the beetle-free stand), resulting in spatially correlated error. One could imagine a similar scenario based on other mechanisms that mediate delayed mortality, such as spatial variability of soil depth or moisture holding capacity, or patchily distributed pathogens. Mortality models do not yet include these mechanisms as input variables, but they implicitly consider them by predicting mortality based on average mortality rates. If a prediction is made for a large-enough area, these spatially correlated factors will be integrated together and the average mortality rates become a reasonable approximation. However, the scale at which this happens must be fairly large as we found spatially correlated error at all spatial scales up to the maximum scale of our analysis (2.5 ha).
Spatial patterns
Restoring structural heterogeneity and spatial patterns to reflect pre-fire suppression reference conditions is a frequent goal of prescribed fire restoration efforts (North et al. 2009), but the ability of mortality models to accurately predict change in spatial pattern remains unstudied. We found that both point pattern analysis and clump size analysis detected a change in pattern post-fire, but point pattern analysis was more sensitive to differences among modelled post-fire patterns. A likely explanation for this is that our choice of a 6-m threshold for the clump size analysis limits the scale of pattern detection to spatial scales >6 m, and the greatest pattern dynamics we observed using the point pattern analysis were at spatial scales 0 to 2 m. The clump size analysis may be better suited to larger-scale pattern dynamics, which all mortality models predicted reasonably well.
The point pattern analysis showed that the spatial pattern of live trees became more aggregated post-fire, and the CVSmono model predicted this with the greatest accuracy (Fig. 3f, g). The FOFEM model and the DBH model were inaccurate at small spatial scales, predicting increased dispersion rather than increased aggregation post-fire. FOFEM accuracy improved at scales >1.5 m, whereas the DBH model was inaccurate at all scales 0–10 m.
The DBH model predicted a more dispersed (i.e. regular) post-fire pattern because the model predicted that large-diameter trees would survive and small-diameter trees would die (Fig. S4). The resulting spatial pattern is therefore closely based on the pre-fire spatial pattern of large-diameter trees, which was more regular than the pre-fire pattern of small-diameter trees. The CVS models, in contrast, use CVS, which is an indirect measure of fire intensity and it therefore reflects the spatial auto-correlation of fire behaviour and subsequent mortality. In other words, small scale patterns in fire intensity are driven by small scale heterogeneity in fuels, stand structure, and wind (Thaxton and Platt 2006; Hiers et al. 2009; Loudermilk et al. 2012); and measurements of CVS implicitly captured this patchiness. The mortality we predicted by the CVS models was therefore spatially structured, resulting in a predicted post-fire spatial pattern that closely reflects the observed post-fire pattern.
The FOFEM models had poor spatial pattern accuracy at small scales even though they are based on CVS. This was because the FOFEMRA model greatly over-predicted mortality of the two hardwood species (15% for C. nuttallii, 19% for Q. kelloggii), and those species tend to be highly aggregated (Fig. S5a, available as Supplementary material to this paper). This resulted in a modelled post-fire spatial pattern that included very few C. nuttallii or Q. kelloggii and was therefore much more dispersed (Fig. S5b). The CVS-based models predicted hardwood survival more accurately, resulting in modelled spatial patterns that more closely reflected the observed post-fire pattern (Fig. 3f, g). This finding highlights the need to develop species-specific mortality models for hardwoods which will improve the spatial pattern accuracy of FOFEM.
Model validation with census v. sample datasets
The YFDP dataset is unique among the datasets used in previous mortality model validations, and many of the novel contributions of this study may be attributed to the representative nature of this dataset. As the population of each species and diameter class was a known quantity, we were able to quantify percentage error – a metric that easily translates to population-level predictions for a given forest stand. Although the data were numerically dominated by small- and medium-diameter trees, we were able to quantify percentage error across the full range of diameter classes, and this demonstrated the importance of using stand-level metrics in addition to individual-tree accuracy when comparing models. The spatial nature of the dataset allowed us to determine the scales at which there was spatially correlated error in model predictions, and to differentiate this from error due to small sample sizes. We were also able to use mortality models to predict change in spatial patterns, and we demonstrated how this can be used to compare models.
Conclusions
The large sample size in this study allowed us to conduct a detailed validation of FOFEMs for five species, and to evaluate logistic mortality models in a few novel ways. The FOFEMSP models had high individual tree accuracy, but they systematically under-predicted mortality at the stand level. Some of this error is likely due to the timing of the Rim Fire in the middle of a severe, multi-year drought. We showed that existing mortality models may not be sufficient to accurately predict mortality under future climates, and this may require re-parameterising mortality models to capture the modified relationship between CVS and mortality under drought conditions. The models we developed in this study accomplish this for five species, although we recommend validating these models with independent data before they are applied in a management context. The FOFEMRA model was inadequate for C. nuttallii and Q. kelloggii, and accuracy may be improved by 15 to 21% (individual accuracy, Table 2) by using the CVS models we created (Table S1). Incorporating these species-specific models into FOFEM will also improve community-level spatial pattern predictions.
We compared five different locally-parameterised models and found that there was no clear winner. Although CVS models had high individual-tree accuracy, DBH models were often more accurate at the stand level. Incorporating a DBH interaction term into CVS-based models improved stand-level performance, but the interaction term also introduced a considerable decline in accuracy for stems at the upper limit of the DBH range (e.g. A. concolor >100 cm DBH, Q. kelloggii >20 cm DBH, C. nuttallii >5 cm DBH). The CVSmono models were generally the most accurate according to both AIC and stand-level metrics, but the monotonic model fitting procedure we developed created models with inflection points that may be less accurate when validated with independent data. These results emphasise the need to develop a stronger theoretical foundation for model forms; model parameters should be chosen based on known processes and interactions, and model forms should be constrained to biologically plausible relationships.
We found that stand-level accuracy improved with increasing spatial scale, although 2.5 ha was not large enough to eliminate spatially correlated error entirely. The spatial analysis revealed the importance of spatial processes to fire-related mortality, and it demonstrated that CVS captures some of this spatial variability. This study not only provides robust estimates of multi-scale mortality model accuracy for five species – it offers a re-evaluation of the fundamental approach (i.e. individual-level accuracy metrics and third-order polynomial model forms) that have dominated empirical mortality modelling for 30 years, and it reveals that existing models may be inadequate for fires that occur during drought. Logistic mortality models are well suited to individual tree predictions, but evaluating accuracy with multi-scale performance metrics and exploring alternative modelling approaches will enhance our ability to model population and community level fire effects.
Conflicts of interest
The authors declare that there are no conflicts of interest.
Acknowledgements
Funding was provided by the Joint Fire Science Program (award 16–1-04–02), the National Park Service (Awards P14AC00122 and P14AC00197), the Ecology Center at Utah State University, and the Utah Agricultural Extension Station, Utah State University, which has designated this as journal paper number #9072. We thank two anonymous reviewers and the Associate Editor for their well-considered and constructive comments. We thank Yosemite National Park for logistical assistance, and the Yosemite Forest Dynamics Plot field crews, volunteers, and students (listed individually at http://yfdp.org) for their work. This work was performed under National Park Service research permits YOSE-2013-SCI-0012, YOSE-2014-SCI-0005, YOSE-2015-SCI-0014, and YOSE-2016-SCI-0006 for study YOSE-0051. The Yosemite Forest Dynamics Plot was made possible by a grant from Jennifer Walston Johnson to the Smithsonian ForestGEO.
References
Allen CD, Savage M, Falk DA, Suckling KF, Swetnam TW, Schulke T, Stacey PB, Morgan P, Hoffman M, Klingel JT (2002) Ecological restoration of Southwestern ponderosa pine ecosystems: a broad perspective. Ecological Applications 12, 1418–1433.| Ecological restoration of Southwestern ponderosa pine ecosystems: a broad perspective.Crossref | GoogleScholarGoogle Scholar |
Anderson-Teixeira KJ, Davies SJ, Bennett AC, Gonzalez-Akre EB, Muller-Landau HC, Wright JS, Abu Salim K, Almeyda Zambrano AM, Alonso A, Baltzer JL, Basset Y, Bourg NA, Broadbent EN, Brockelman WY, Bunyavejchewin S, Burslem DFRP, Butt N, Cao M, Cardenas D, Chuyong GB, Clay K, Cordell S, Dattaraja HS, Deng X, Detto M, Du X, Duque A, Erikson DL, Ewango CEN, Fischer GA, Fletcher C, Foster RB, Giardina CP, Gilbert GS, Gunatilleke N, Gunatilleke S, Hao Z, Hargrove WW, Hart TB, Hau BCH, He F, Hoffman FM, Howe RW, Hubbell SP, Inman-Narahari FM, Jansen PA, Jiang M, Johnson DJ, Kanzaki M, Kassim AR, Kenfack D, Kibet S, Kinnaird MF, Korte L, Kral K, Kumar J, Larson AJ, Li Y, Li X, Liu S, Lum SKY, Lutz JA, Ma K, Maddalena DM, Makana J-R, Malhi Y, Marthews T, Mat Serudin R, McMahon SM, McShea WJ, Memiaghe HR, Mi X, Mizuno T, Morecroft M, Myers JA, Novotny V, de Oliveira AA, Ong PS, Orwig DA, Ostertag R, den Ouden J, Parker GG, Phillips RP, Sack L, Sainge MN, Sang W, Sri-ngernyuang K, Sukumar R, Sun I-F, Sungpalee W, Suresh HS, Tan S, Thomas SC, Thomas DW, Thompson J, Turner BL, Uriarte M, Valencia R, Vallejo MI, Vicentini A, Vrška T, Wang X, Wang Xugao, Weiblen G, Wolf A, Xu H, Yap S, Zimmerman J (2015) CTFS-ForestGEO: a worldwide network monitoring forests in an era of global change. Global Change Biology 21, 528–549.
| CTFS-ForestGEO: a worldwide network monitoring forests in an era of global change.Crossref | GoogleScholarGoogle Scholar |
Baddeley AJ, Diggle PJ, Hardegen A, Lawrence T, Milne RK, Nair G (2014) On tests of spatial pattern based on simulation envelopes. Ecological Monographs 84, 477–489.
| On tests of spatial pattern based on simulation envelopes.Crossref | GoogleScholarGoogle Scholar |
Baddeley A, Rubak E, Turner R (2015) Spatial point patterns: methodology and applications with R. (Chapman & Hall/CRC Press: London, UK)
Barth MF, Larson AJ, Lutz JA (2015) A forest reconstruction model to assess changes to Sierra Nevada mixed-conifer forest during the fire suppression era. Forest Ecology and Management 354, 104–118.
| A forest reconstruction model to assess changes to Sierra Nevada mixed-conifer forest during the fire suppression era.Crossref | GoogleScholarGoogle Scholar |
Battaglia M, Smith FW, Shepperd WD (2009) Predicting mortality of ponderosa pine regeneration after prescribed fire in the Black Hills, South Dakota, USA. International Journal of Wildland Fire 18, 176–190.
| Predicting mortality of ponderosa pine regeneration after prescribed fire in the Black Hills, South Dakota, USA.Crossref | GoogleScholarGoogle Scholar |
Belmecheri S, Babst F, Wahl ER, Stahle DW, Trouet V (2016) Multi-century evaluation of Sierra Nevada snowpack. Nature Climate Change 6, 2–3.
| Multi-century evaluation of Sierra Nevada snowpack.Crossref | GoogleScholarGoogle Scholar |
Belote TR, Larson AJ, Dietz MS (2015) Tree survival scales to community-level effects following mixed-severity fire in a mixed-conifer forest. Forest Ecology and Management 353, 221–231.
| Tree survival scales to community-level effects following mixed-severity fire in a mixed-conifer forest.Crossref | GoogleScholarGoogle Scholar |
Caprio AC, Swetnam TW (1995) Historic fire regimes along an elevational gradient on the west slope of the Sierra Nevada, California. In ‘Proceedings – Symposium on Fire in Wilderness and Park Management’. (Eds JK Brown, RW Mutch, CW Spoon, RH Wakimoto) USDA Forest Service, General Technical Report INT-GTR-320, pp. 173–179. (Ogden, UT, USA)
Catry FX, Pausas JG, Moreira F, Fernandes PM, Rego F (2013) Post-fire response variability in Mediterranean Basin tree species in Portugal. International Journal of Wildland Fire 22, 919–932.
| Post-fire response variability in Mediterranean Basin tree species in Portugal.Crossref | GoogleScholarGoogle Scholar |
Churchill DJ, Larson AJ, Dahlgreen MC, Franklin JF, Hessburg PF, Lutz JA (2013) Restoring forest resilience: From reference spatial patterns to silvicultural prescriptions and monitoring. Forest Ecology and Management 291, 442–457.
| Restoring forest resilience: From reference spatial patterns to silvicultural prescriptions and monitoring.Crossref | GoogleScholarGoogle Scholar |
Engber EA, Varner JM (2012) Predicting Douglas-fir sapling mortality following prescribed fire in an encroached grassland. Restoration Ecology 20, 665–668.
| Predicting Douglas-fir sapling mortality following prescribed fire in an encroached grassland.Crossref | GoogleScholarGoogle Scholar |
Furniss TJ, Larson AJ, Lutz JA (2017) Reconciling niches and neutrality in a subalpine temperate forest. Ecosphere 8, e01847
| Reconciling niches and neutrality in a subalpine temperate forest.Crossref | GoogleScholarGoogle Scholar |
Ganio LM, Progar RA (2017) Mortality predictions of fire-injured large Douglas-fir and ponderosa pine in OR and WA, USA. Forest Ecology and Management 390, 47–67.
| Mortality predictions of fire-injured large Douglas-fir and ponderosa pine in OR and WA, USA.Crossref | GoogleScholarGoogle Scholar |
Ganio LM, Woolley T, Shaw DC, Fitzgerald SA (2015) The discriminatory ability of Post-fire tree mortality logistic regression models. Forest Science 61, 344–352.
| The discriminatory ability of Post-fire tree mortality logistic regression models.Crossref | GoogleScholarGoogle Scholar |
Grayson LM, Progar RA, Hood SM (2017) Predicting post-fire tree mortality for 14 conifers in the Pacific Northwest, USA: model evaluation, development, and thresholds. Forest Ecology and Management 399, 213–226.
| Predicting post-fire tree mortality for 14 conifers in the Pacific Northwest, USA: model evaluation, development, and thresholds.Crossref | GoogleScholarGoogle Scholar |
Hiers JK, O’Brien JJ, Mitchell RJ, Grego JM, Loudermilk EL (2009) The wildland fuel cell concept: an approach to characterize fine-scale variation in fuels and fire in frequently burned longleaf pine forests. International Journal of Wildland Fire 18, 315–325.
| The wildland fuel cell concept: an approach to characterize fine-scale variation in fuels and fire in frequently burned longleaf pine forests.Crossref | GoogleScholarGoogle Scholar |
Hood S, Bentz B (2007) Predicting post-fire Douglas-fir beetle attacks and tree mortality in the northern Rocky Mountains. Canadian Journal of Forest Research 37, 1058–1069.
| Predicting post-fire Douglas-fir beetle attacks and tree mortality in the northern Rocky Mountains.Crossref | GoogleScholarGoogle Scholar |
Hood SM, Lutes D (2017) Predicting post-fire tree mortality for 12 western US conifers using the First Order Fire Effects Model (FOFEM). Fire Ecology 13, 66–84.
| Predicting post-fire tree mortality for 12 western US conifers using the First Order Fire Effects Model (FOFEM).Crossref | GoogleScholarGoogle Scholar |
Hood SM, McHugh CW, Ryan KC, Reinhardt E, Smith SL (2007) Evaluation of a post-fire tree mortality model for western USA conifers. International Journal of Wildland Fire 16, 679–689.
| Evaluation of a post-fire tree mortality model for western USA conifers.Crossref | GoogleScholarGoogle Scholar |
Kane VR, Cansler CA, Povak NA, Kane JT, McGaughey RJ, Lutz JA, Churchill DJ, North MP (2015) Mixed severity fire effects within the Rim Fire: relative importance of local climate, fire weather, topography, and forest structure. Forest Ecology and Management 358, 62–79.
| Mixed severity fire effects within the Rim Fire: relative importance of local climate, fire weather, topography, and forest structure.Crossref | GoogleScholarGoogle Scholar |
Kane JM, van Mantgem PJ, Lalemand LB, Keifer M (2017) Higher sensitivity and lower specificity in post-fire mortality model validation of 11 western US tree species. International Journal of Wildland Fire 26, 444–454.
Keeler-Wolf T, Moore P, Reyes E, Menke J, Johnson D, Karavidas D (2012) Yosemite National Park vegetation classification and mapping project report. Natural Resources Technical Report, US Department of the Interior, National Park Service. NPS/YOSE/NRTR – 2012/598 (Fort Collins, CO).
Kohavi R (1995) A study of cross-validation and bootstrap for accuracy estimation and model selection. In ‘IJCAI’95 Proceedings of the 14th international joint conference on Artificial intelligence – Volume 2’, August 20-25, Montreal, QC, Canada. pp. 1137–1145. (Morgan Kaufmann Publishers Inc.: San Francisco, CA)
Kolb TE, Agee JK, Fulé PZ, McDowell NG, Pearson K, Sala A, Waring RH (2007) Perpetuating old ponderosa pine. Forest Ecology and Management 249, 141–157.
| Perpetuating old ponderosa pine.Crossref | GoogleScholarGoogle Scholar |
Larson AJ, Churchill D (2008) Spatial patterns of overstory trees in late-successional conifer forests. Canadian Journal of Forest Research 38, 2814–2825.
| Spatial patterns of overstory trees in late-successional conifer forests.Crossref | GoogleScholarGoogle Scholar |
Larson AJ, Churchill D (2012) Tree spatial patterns in fire-frequent forests of western North America, including mechanisms of pattern formation and implications for designing fuel reduction and restoration treatments. Forest Ecology and Management 267, 74–92.
| Tree spatial patterns in fire-frequent forests of western North America, including mechanisms of pattern formation and implications for designing fuel reduction and restoration treatments.Crossref | GoogleScholarGoogle Scholar |
Larson AJ, Lutz JA, Donato DC, Freund JA, Swanson ME, HilleRisLambers J, Sprugel DG, Franklin JF (2015) Spatial aspects of tree mortality strongly differ between young and old-growth forests. Ecology 96, 2855–2861.
| Spatial aspects of tree mortality strongly differ between young and old-growth forests.Crossref | GoogleScholarGoogle Scholar |
Larson AJ, Cansler CA, Cowdery SG, Hiebert S, Furniss TJ, Swanson ME, Lutz JA (2016) Post-fire morel (Morchella) mushroom abundance, spatial structure, and harvest sustainability. Forest Ecology and Management 377, 16–25.
| Post-fire morel (Morchella) mushroom abundance, spatial structure, and harvest sustainability.Crossref | GoogleScholarGoogle Scholar |
Loudermilk EL, O’Brien JJ, Mitchell RJ, Cropper WP, Hiers JK, Grunwald S, Grego J, Fernandez-Diaz JC (2012) Linking complex forest fuel structure and fire behaviour at fine scales. International Journal of Wildland Fire 21, 882–893.
| Linking complex forest fuel structure and fire behaviour at fine scales.Crossref | GoogleScholarGoogle Scholar |
Lutes DC (2016) FOFEM 6.3 User Guide. USDA Forest Service, Rocky Mountain Research Station, Fire Modeling Institute (Missoula, MT, USA). Available at https://www.firelab.org/document/fofem-files [verified Nov 7 2018].
Lutz JA (2015) The evolution of long-term data for forestry: large temperate research plots in an era of global change. Northwest Science 89, 255–269.
| The evolution of long-term data for forestry: large temperate research plots in an era of global change.Crossref | GoogleScholarGoogle Scholar |
Lutz JA, van Wagtendonk JW, Thode AE, Miller JD, Franklin JF (2009) Climate, lightning ignitions, and fire severity in Yosemite National Park, California, USA. International Journal of Wildland Fire 18, 765–774.
| Climate, lightning ignitions, and fire severity in Yosemite National Park, California, USA.Crossref | GoogleScholarGoogle Scholar |
Lutz JA, Larson AJ, Swanson ME, Freund JA (2012) Ecological importance of large-diameter trees in a temperate mixed-conifer forest. PLoS One 7, e36131
| Ecological importance of large-diameter trees in a temperate mixed-conifer forest.Crossref | GoogleScholarGoogle Scholar |
Lutz JA, Larson AJ, Freund JA, Swanson ME, Bible KJ (2013) The importance of large-diameter trees to forest structural heterogeneity. PLoS One 8, e82784
| The importance of large-diameter trees to forest structural heterogeneity.Crossref | GoogleScholarGoogle Scholar |
Lutz JA, Larson AJ, Furniss TJ, Donato DC, Freund JA, Swanson ME, Bible KJ, Chen J, Franklin JF (2014a) Spatially nonrandom tree mortality and ingrowth maintain equilibrium pattern in an old-growth Pseudotsuga–Tsuga forest. Ecology 95, 2047–2054.
| Spatially nonrandom tree mortality and ingrowth maintain equilibrium pattern in an old-growth Pseudotsuga–Tsuga forest.Crossref | GoogleScholarGoogle Scholar |
Lutz JA, Schwindt KA, Furniss TJ, Freund JA, Swanson ME, Hogan KI, Kenagy GE, Larson AJ (2014b) Community composition and allometry of Leucothoe davisiae, Cornus sericea, and Chrysolepis sempervirens. Canadian Journal of Forest Research 44, 677–683.
| Community composition and allometry of Leucothoe davisiae, Cornus sericea, and Chrysolepis sempervirens.Crossref | GoogleScholarGoogle Scholar |
Lutz JA, Furniss TJ, Germain SJ, Becker KML, Blomdahl EM, Jeronimo SMA, Cansler CA, Freund JA, Swanson ME, Larson AJ (2017a) Shrub communities, spatial patterns, and shrub-mediated tree mortality following reintroduced fire in Yosemite National Park, California, USA. Fire Ecology 13, 104–126.
| Shrub communities, spatial patterns, and shrub-mediated tree mortality following reintroduced fire in Yosemite National Park, California, USA.Crossref | GoogleScholarGoogle Scholar |
Lutz JA, Matchett JR, Tarnay L, Smith D, Becker KML, Furniss TJ, Brooks M (2017b) Fire and the distribution and uncertainty of carbon sequestered as aboveground tree biomass in Yosemite and Sequoia & Kings Canyon National Parks. Land 6, 10.
| Fire and the distribution and uncertainty of carbon sequestered as aboveground tree biomass in Yosemite and Sequoia & Kings Canyon National Parks.Crossref | GoogleScholarGoogle Scholar |
Lutz JA, Larson AJ, Swanson ME (2018a) Advancing fire science with large forest plots and a long-term multidisciplinary approach. Fire 1, 5.
| Advancing fire science with large forest plots and a long-term multidisciplinary approach.Crossref | GoogleScholarGoogle Scholar |
Lutz JA, Furniss TJ, Johnson DJ, Davies SJ, Allen D, Alonso A, Anderson-Teixeira KJ, Andrade A, Baltzer J, Becker KML, Blomdahl EM, Bourg NA, Bunyavejchewin S, Burslem DFRP, Cansler CA, Cao K, Cao M, Cárdenas D, Chang L-W, Chao K-J, Chao W-C, Chiang J-M, Chu C, Chuyong GB, Clay K, Condit R, Cordell S, Dattaraja HS, Duque A, Ewango CEN, Fischer GA, Fletcher C, Freund JA, Giardina C, Germain SJ, Gilbert GS, Hao Z, Hart T, Hau BCH, He F, Hector A, Howe RW, Hsieh C-F, Hu Y-H, Hubbell SP, Inman-Narahari FM, Itoh A, Janík D, Kassim AR, Kenfack D, Korte L, Král K, Larson AJ, Li Y, Lin Y, Liu S, Lum S, Ma K, Makana J-R, Malhi Y, McMahon SM, McShea WJ, Memiaghe HR, Mi X, Morecroft M, Musili PM, Myers JA, Novotny V, de Oliveira A, Ong P, Orwig DA, Ostertag R, Parker GG, Patankar R, Phillips RP, Reynolds G, Sack L, Song G-ZM, Su S-H, Sukumar R, Sun I-F, Suresh HS, Swanson ME, Tan S, Thomas DW, Thompson J, Uriarte M, Valencia R, Vicentini A, Vrška T, Wang X, Weiblen GD, Wolf A, Wu S-H, Xu H, Yamakura T, Yap S, Zimmerman JK (2018b) Global importance of large-diameter trees. Global Ecology and Biogeography 27, 849–864.
| Global importance of large-diameter trees.Crossref | GoogleScholarGoogle Scholar |
Lydersen JM, North MP, Collins BM (2014) Severity of an uncharacteristically large wildfire, the Rim Fire, in forests with relatively restored frequent fire regimes. Forest Ecology and Management 328, 326–334.
| Severity of an uncharacteristically large wildfire, the Rim Fire, in forests with relatively restored frequent fire regimes.Crossref | GoogleScholarGoogle Scholar |
McHugh CW, Kolb TE (2003) Ponderosa pine mortality following fire in northern Arizona. International Journal of Wildland Fire 12, 7–22.
| Ponderosa pine mortality following fire in northern Arizona.Crossref | GoogleScholarGoogle Scholar |
Meddens AJH, Kolden CA, Lutz JA, Abatzoglou J, Hudak A (2018) Spatiotemporal patterns of unburned areas within fire perimeters in the northwestern United States from 1984 to 2014. Ecosphere 9, e02029
| Spatiotemporal patterns of unburned areas within fire perimeters in the northwestern United States from 1984 to 2014.Crossref | GoogleScholarGoogle Scholar |
Michaletz ST, Johnson EA (2006) A heat transfer model of crown scorch in forest fires. Canadian Journal of Forest Research 36, 2839–2851.
| A heat transfer model of crown scorch in forest fires.Crossref | GoogleScholarGoogle Scholar |
Miller JD, Thode AE (2007) Quantifying burn severity in a heterogeneous landscape with a relative version of the delta Normalized Burn Ratio (dNBR). Remote Sensing of Environment 109, 66–80.
| Quantifying burn severity in a heterogeneous landscape with a relative version of the delta Normalized Burn Ratio (dNBR).Crossref | GoogleScholarGoogle Scholar |
North M, Innes J, Zald H (2007) Comparison of thinning and prescribed fire restoration treatments to Sierran mixed-conifer historic conditions. Canadian Journal of Forest Research 37, 331–342.
| Comparison of thinning and prescribed fire restoration treatments to Sierran mixed-conifer historic conditions.Crossref | GoogleScholarGoogle Scholar |
North M, Stine P, O’Hara K, Zielinski W, Stephens S (2009) An ecosystem management strategy for Sierran mixed-conifer forests. USDA Forest Service, General Technical Report PSW-GTR-220. (Albany, CA, USA)
Parker TJ, Clancy KM, Mathiasen RL (2006) Interactions among fire, insects and pathogens in coniferous forests of the interior western United States and Canada. Agricultural and Forest Entomology 8, 167–189.
| Interactions among fire, insects and pathogens in coniferous forests of the interior western United States and Canada.Crossref | GoogleScholarGoogle Scholar |
Peterson DL (1985) Crown scorch volume and scorch height: estimates of postfire tree condition. Canadian Journal of Forest Research 15, 596–598.
| Crown scorch volume and scorch height: estimates of postfire tree condition.Crossref | GoogleScholarGoogle Scholar |
Plotkin JB, Chave J, Ashton PS (2002) Cluster analysis of spatial patterns in Malaysian tree species. American Naturalist 160, 629–644.
| Cluster analysis of spatial patterns in Malaysian tree species.Crossref | GoogleScholarGoogle Scholar |
Regelbrugge JC, Conard SG (1993) Modeling tree mortality following wildfire in Pinus ponderosa forests in the central Sierra Nevada of California. International Journal of Wildland Fire 3, 139–148.
| Modeling tree mortality following wildfire in Pinus ponderosa forests in the central Sierra Nevada of California.Crossref | GoogleScholarGoogle Scholar |
Reinhardt ED, Crookston NL (2003) The fire and fuels extension to the forest vegetation simulator. USDA Forest Service, Rocky Mountain Research Station, General Technical Report RMRS-GTR-116. (Ogden, UT, USA)
Reinhardt ED, Dickinson MB (2010) First-order fire effects models for land management: overview and issues. Fire Ecology 6, 131–150.
| First-order fire effects models for land management: overview and issues.Crossref | GoogleScholarGoogle Scholar |
Ripley BD (1976) The second-order analysis of stationary point processes. Journal of Applied Probability 13, 255–266.
| The second-order analysis of stationary point processes.Crossref | GoogleScholarGoogle Scholar |
Ryan KC, Amman GD (1994) Interactions between fire-injured trees and insects in the greater Yellowstone area. In ‘Plants and their Environments: Proceedings of the First Biennial Scientific Conference on the Greater Yellowstone Ecosystem’. (Ed. DG Despain) US Department of the Interior, National Park Service, Natural Resources Publication Office, Technical report NPS/NRYELL/NRTR, pp. 259–271. (Denver, CO, USA)
Ryan KC, Amman GD (1996). Bark beetle activity and delayed tree mortality in the Greater Yellowstone Area following the 1988 fires. In ‘The ecological implications of fire in Greater Yellowstone: Proceedings of the second biennial conference on the Greater Yellowstone Ecosystem’, 19–21 September 1993, Yellowstone National Park, WY. (Eds RE Keane, KC Ryan, and SW Running) pp. 151–158. (International Association of Wildland Fire: Fairland, WA)
Ryan KC, Reinhardt ED (1988) Predicting postfire mortality of seven western conifers. Canadian Journal of Forest Research 18, 1291–1297.
| Predicting postfire mortality of seven western conifers.Crossref | GoogleScholarGoogle Scholar |
Scholl AE, Taylor AH (2010) Fire regimes, forest change, and self-organization in an old-growth mixed-conifer forest, Yosemite National Park, USA. Ecological Applications 20, 362–380.
| Fire regimes, forest change, and self-organization in an old-growth mixed-conifer forest, Yosemite National Park, USA.Crossref | GoogleScholarGoogle Scholar |
Sieg CH, McMillin JH, Fowler JF, Allen KK, Negron JF, Wadleigh LL, Anhold JA, Gibson KE (2006) Best predictors for postfire mortality of ponderosa pine trees in the Intermountain West. Forest Science 52, 718–728.
Smith AMS, Sparks AM, Kolden CA, Abatzoglou JT, Talhelm AF, Johnson DM, Boschetti L, Lutz JA, Apostol KG, Yedinak KM, Tinkham WT, Kremens RJ (2016) Towards a new paradigm in fire severity research using dose–response experiments. International Journal of Wildland Fire 25, 158–166.
| Towards a new paradigm in fire severity research using dose–response experiments.Crossref | GoogleScholarGoogle Scholar |
Smith AMS, Talhelm AF, Johnson DM, Sparks AM, Kolden CA, Yedinak KM, Apostol KG, Tinkham WT, Abatzoglou JT, Lutz JA, Davis AS, Pregitzer KS, Adams HD, Kremens RL (2017) Effects of fire radiative energy density dose on Pinus contorta and Larix occidentalis seedling physiology and mortality. International Journal of Wildland Fire 26, 82–94.
| Effects of fire radiative energy density dose on Pinus contorta and Larix occidentalis seedling physiology and mortality.Crossref | GoogleScholarGoogle Scholar |
Stephens S, Fry D, Franco-Vizcaíno E (2008) Wildfire and spatial patterns in forests in Northwestern Mexico: The United States wishes it had similar fire problems. Ecology and Society 13,
| Wildfire and spatial patterns in forests in Northwestern Mexico: The United States wishes it had similar fire problems.Crossref | GoogleScholarGoogle Scholar |
Stephens S, Collins BM, Fettig CJ, Finney MA, Hoffman CM, Knapp EE, North MP, Safford H, Wayman RB (2018) Drought, tree mortality, and wildfire in forests adapted to frequent fire. Bioscience 68, 77–88.
| Drought, tree mortality, and wildfire in forests adapted to frequent fire.Crossref | GoogleScholarGoogle Scholar |
Thaxton JM, Platt WJ (2006) Small-scale fuel variation alters fire intensity and shrub abundance in a pine savanna. Ecology 87, 1331–1337.
| Small-scale fuel variation alters fire intensity and shrub abundance in a pine savanna.Crossref | GoogleScholarGoogle Scholar |
van Mantgem PJ, Stephenson NL, Knapp E, Battles J, Keeley JE (2011) Long-term effects of prescribed fire on mixed conifer forest structure in the Sierra Nevada, California. Forest Ecology and Management 261, 989–994.
| Long-term effects of prescribed fire on mixed conifer forest structure in the Sierra Nevada, California.Crossref | GoogleScholarGoogle Scholar |
van Mantgem PJ, Nesmith JCB, Keifer M, Knapp EE, Flint A, Flint L (2013) Climatic stress increases forest fire severity across the western United States. Ecology Letters 16, 1151–1156.
| Climatic stress increases forest fire severity across the western United States.Crossref | GoogleScholarGoogle Scholar |
van Wagtendonk JW (2007) The history and evolution of wildland fire use. Fire Ecology 3, 3–17.
| The history and evolution of wildland fire use.Crossref | GoogleScholarGoogle Scholar |
van Wagtendonk JW, Fites-Kaufman J (2006) Sierra Nevada bioregion. In ‘Fire in California’s Ecosystems’. (Eds NG Sugihara, JW van Wagtendonk, J Fites-Kaufman, KE Shaffer, AE Thode) pp. 264–294. (University of California Press: Berkeley, CA, USA)
van Wagtendonk JW, Lutz JA (2007) Fire regime attributes of wildland fires in Yosemite National Park, USA. Fire Ecology 3, 34–52.
| Fire regime attributes of wildland fires in Yosemite National Park, USA.Crossref | GoogleScholarGoogle Scholar |
Varner MJ, Putz FE, O’Brien JJ, Hiers JK, Mitchell RJ, Gordon DR (2009) Post-fire tree stress and growth following smoldering duff fires. Forest Ecology and Management 258, 2467–2474.
| Post-fire tree stress and growth following smoldering duff fires.Crossref | GoogleScholarGoogle Scholar |
Weatherby JC, Mocettini P, Gardner BR (1994) Biological evaluation of tree survivorship within the Lowman fire boundary, 1989–1993. USDA Forest Service, Forest Health Protection, Boise Field Office, Report no. R4-94-06 (Boise, ID, USA).
Wiegand T, Moloney KA (2004) Rings, circles, and null-models for point pattern analysis in ecology. Oikos 104, 209–229.
| Rings, circles, and null-models for point pattern analysis in ecology.Crossref | GoogleScholarGoogle Scholar |
Woolley T, Shaw DC, Ganio LM, Fitzgerald S (2012) A review of logistic regression models used to predict post-fire tree mortality of western North American conifers. International Journal of Wildland Fire 21, 1–35.
| A review of logistic regression models used to predict post-fire tree mortality of western North American conifers.Crossref | GoogleScholarGoogle Scholar |