

Sunlight can have a stronger influence than air temperature on soil solarisation: observational evidence from Australia
Maximilian McQuillan A * , Ronald J. Smernik A and Ren Ryba B
A
B
Abstract
Soil solarisation is a method for pest and weed control pioneered in agriculture, and it is increasingly being adopted by restoration practitioners. Solarisation works by covering moist soil during hot periods with a sheet of clear plastic. The success of soil solarisation depends in large part on increasing the temperature of the topsoil. Topsoil temperature depends on several physical variables, including soil moisture content, ambient temperature, and sunlight intensity. In restoration scenarios, solarisation can be used to reduce weed and pathogen loads prior to planting target plants. It is rarely possible to have tight control over all the variables that are important for solarisation; however, practitioners can time interventions to maximise seasonal temperature and sunlight intensity. In this study, we investigated how these two key physical variables – temperature and sunlight – contributed to the success of soil solarisation. We found that while both ambient temperature and sunlight contributed to soil temperature, the data suggests that sunlight was the more influential driver of soil temperature. These results show that, when planning for soil solarisation during ecological restoration, land managers can benefit by considering sunlight as well as air temperature. The result that sunlight may be the more influential driver of soil temperature empowers land managers to better plan solarisation using sunlight projections, even when temperature is not optimal or is unpredictable.
Keywords: grassland restoration ecology, non-native plants, soil biology, soil seed bank, soil solarisation, soil temperature, southern hemisphere, tillage, weeds.
Introduction
Soil solarisation is a method of controlling soil pathogens and nuisance plants by covering moist soil during hot periods with a sheet of clear plastic. Soil solarisation was pioneered for agriculture in the Middle East in the mid-1970s (Katan 1981) and has reportedly been used in over 60 countries (Katan and Gamliel 2010). More recently, there has been renewed interest in solarisation because it uses less pesticide (D’Addabbo et al. 2010). Solarisation is a particularly promising option in restoration projects where it can reduce the abundance of exotic plant propagules from the soil seed bank over the course of only 4–6 weeks and alternative methods (e.g. topsoil removal with heavy machinery) are often unviable (Bainbridge 1990).
The sheet of clear polyethylene plastic used in soil solarisation generates a greenhouse effect in the upper layers of the soil. The soil temperature increases, which triggers a series of interrelated physical, biological, and chemical events that can destroy unwanted plant propagules (Horowitz et al. 1983; Bainbridge 1990).
It is well-accepted that in the absence of a complete, long-term weed survey, the success of soil solarisation can be estimated by measuring the short-term increase in soil temperature. Specifically, research over the past 40 years has indicated that the main driver of the success of solarisation is the ability to increase soil temperature, which kills target organisms (Horowitz et al. 1983; D’Addabbo et al. 2010). The greater the increase in soil temperature, the more effective solarisation becomes (Abed Gatea Al-Shammary et al. 2020). Previous studies have suggested that solarisation can successfully control plant seeds and microbial pathogens at depths of 0–10 cm, with some studies showing mortality of seeds and pathogens even beyond 20 cm depth (D’Addabbo et al. 2010; Gill et al. 2017).
Many edaphic factors are known to influence the efficiency of heat transfer during solarisation. Such factors include soil texture, soil structure, and soil moisture content. Restoration practitioners have control over some factors known to influence solarisation, but not others. Specifically, practitioners do have control over the timing of solarisation, which determines the magnitude of both temperature and solar radiation – the drivers responsible for raising the temperature of solarised soil. In contrast, practitioners typically do not have the option to artificially water or till the soil due to infrastructure and equipment limitations (Cohen et al. 2019).
However, there is ambiguity around the optimal time to apply the solarisation treatment (Kanellou et al. 2023). Existing guides simply recommend that practitioners choose the hottest and sunniest part of the year (Bainbridge 1990) and to refer to meteorological data from previous years to determine when this is (Abed Gatea Al-Shammary et al. 2020). The weakness of this advice is that it does not help restoration practitioners understand the relative importance of different variables. How much should a land manager prioritise temperature, which can typically only be predicted days in advance, compared with sunlight intensity?
There are indications in the literature that solar radiation is an important contributing factor to the success of soil solarisation. One indication is the observation that translucent plastic works better than non-translucent plastic (Avissar et al. 1986; Al-Karaghouli et al. 1990), and another indication is mathematical modelling that uses solar radiation as one explanatory factor (Mahrer et al. 1987). However, for land managers, the relative contribution of solar radiation remains elusive. Furthermore, sunlight intensity varies globally, primarily with latitude, but also with altitude and cloudiness (Van Geffen et al. 2017). Most research on solarisation has been conducted in the northern hemisphere at high (e.g. southern Europe) to mid (e.g. the Middle East) latitudes, so the results of such research may not be applicable to restoration projects in the southern hemisphere (e.g. Australia). This study fills this gap by examining solarisation at a mid latitude site (approximately 35°) in the southern hemisphere.
Thus, the relative effects of solar radiation and temperature on soil solarisation are unknown. The aim of this study is to provide insights into the relative contribution of sunlight and air temperature to soil solarisation, enabling restoration practitioners – particularly in the southern hemisphere – to better plan and optimise this technique.
To address this gap, we conducted an analysis to statistically distinguish between the relative contribution to solarisation of air temperature and of sunlight. If sunlight is the primary driver of solarisation, then the statistical contribution of UV to soil temperature will be large while the statistical contribution of air temperature to soil temperature will be minimal. If air temperature is the primary driver of solarisation, then the reverse will be true. If sunlight and air temperature both make separate contributions to solarisation, then both UV and air temperature will display a moderate statistical contribution to soil temperature.
Materials and methods
Study site
The data were collected during a native temperate grassland restoration project on a Black Vertosol (Isbell 2021) soil (see Supplementary Table S2 for the full soil profile description) in an urban national park (35.06022S, 138.54983E) in Kaurna Country/Adelaide, South Australia. Eight temperature sensors (TMSs) (Wild et al. 2019) (TOMST, Czechia) were installed across eight 5 m × 5 m research plots (one per plot). These sensors recorded soil temperature 6 cm below the soil surface and air temperature 15 cm above the soil surface, at 15-min intervals.
Treatments
Each plot was randomly located within the grassland and randomly assigned to one of three treatments: (1) control (two replicates), where no plastic was placed over the soil; (2) 6-week solarisation treatment (two replicates), where clear 210-micron thick polyethylene (PE) plastic was placed over the soil and removed after 6 weeks; and (3) 12-week treatment, where the same plastic was placed over the soil and removed after 12 weeks (four replicates). This study reports on a subset of a larger randomised restoration experiment, which consists of five treatments (the two solarisation treatments described here, one herbicide treatment and two topsoil removal treatments) and one control, all with six replicates. Only the data pertaining to the solarisation treatments are reported on here.
The control serves one purpose in this study, which is to provide a baseline soil temperature measure to compare the solarisation treatments – this provided the necessary information to confirm that solarisation had successfully increased soil temperatures. However, the statistical analyses required capturing the seasonal variation in the environmental variables, and this necessitated using only the 12-week solarisation data. As such, more loggers were assigned to the 12-week solarisation treatment. It is also worth noting that the variation between replicates within each treatment was minimal.
Data collection
The experiment began on 26 January 2023, following two summer rainfall events1, and corresponds to the middle of the local summer, with peak daily UV radiation (max. UV index 11). Details of how UV was quantified are given below. Data collection continued for 105 days, with milestones at 42 days (max. UV index 8.7) and 84 days (max. UV index 5). The experiment ended on 11 May 2023 (max. UV index 3.2). One logger (control plot) was destroyed by a wild animal during the experiment.
Sunlight data were obtained separately, from the Australian Government, which measures and publishes UV index data at 1-min intervals (ARPANSA 2023). This data is collected by sensors on the ground at a number of sites across Australia. The data for Adelaide City, located 15 km north-east of the study site, were used. UV radiation is strongly correlated with total solar radiation, enabling the use of UV radiation as a relative measure of solar radiation incident on the soil (Santos et al. 2011). The timing of the study, the weeks between the middle of summer and the middle of autumn, provides a natural gradient of different sunlight intensities. Furthermore, different days had different levels of cloud cover. The sunlight incident on the ground decreases when there is substantial cloud cover; attenuation by clouds is similar across different wavelengths of sunlight (Chen 1975). Therefore, the measured UV index is suitable as a relative proxy of total sunlight even on cloudy days. This is particularly useful for this study, as this means that the dataset contains both high-temperature, low-sunlight days and low-temperature, high-sunlight days.
Data analysis
The dataset was analysed as a set of 105 daily observations, with each day being assigned the soil and air temperature that was closest to the solar maximum on that day. This accounts for the fact that multiple temperature readings on each day would be very closely correlated with each other. Each day was then assigned a value for sunlight that was equal to the average UV intensity across the day from sunrise up until that day’s solar maximum (i.e. the integral of the day’s UV curve divided by time). This corrects for the confounding effect of day length and accounts for different durations of cloud cover each day. A daily timescale is also appropriate for the response variable; soil temperature which was measured 6 cm below the soil surface. At this depth, temperature changes relatively slowly with only small diurnal fluctuations. This resulted in a dataset containing daily observations of soil temperature at −6 cm, and air temperature at +15 cm, and UV radiation, across 105 days and three treatments. It is well-understood that daytime soil temperature is highest at the surface and decreases with depth (Reddy 2012). Practitioners are typically interested in the top few centimetres of soil. Therefore, 6 cm provides an appropriate, if conservative, measure of the effects of solarisation. Temperatures above 6 cm, including at the surface, would be slightly higher than the soil temperatures we report here.
First, to test the assumption that the clear plastic covers were successful in increasing soil temperature, the time series of soil temperature in each of the three treatments were visualised (Fig. 1a). The time series was visualised as the mean for each treatment; variation within treatments was minimal.
The relative contribution of temperature and sunlight to soil solarisation. The main implication of this figure is that soil solarisation increases soil temperature (a), that air temperature and sunlight both contribute to the success of soil solarisation (b), and that the contribution of sunlight to solarisation may be more important than that of temperature (c). (a) Time series showing the daily topsoil (at −6 cm) temperature at the time of peak daily sunlight, averaged across the sensors within each treatment (vertical dotted lines delineate the 6 and 12 week treatment times); (b) Air temperature and sunlight partitioned into categorical variables (‘+’ indicates days with greater than the mean sunlight or temperature, and ‘−’ indicates days with less than the mean sunlight or temperature). Letters indicate differences between groups as calculated using ANOVA and Tukey’s post hoc test; (c) Principal component analysis (PCA), with data coloured based on the same grouping as in (b). Note that the vertical axes differ between plots.
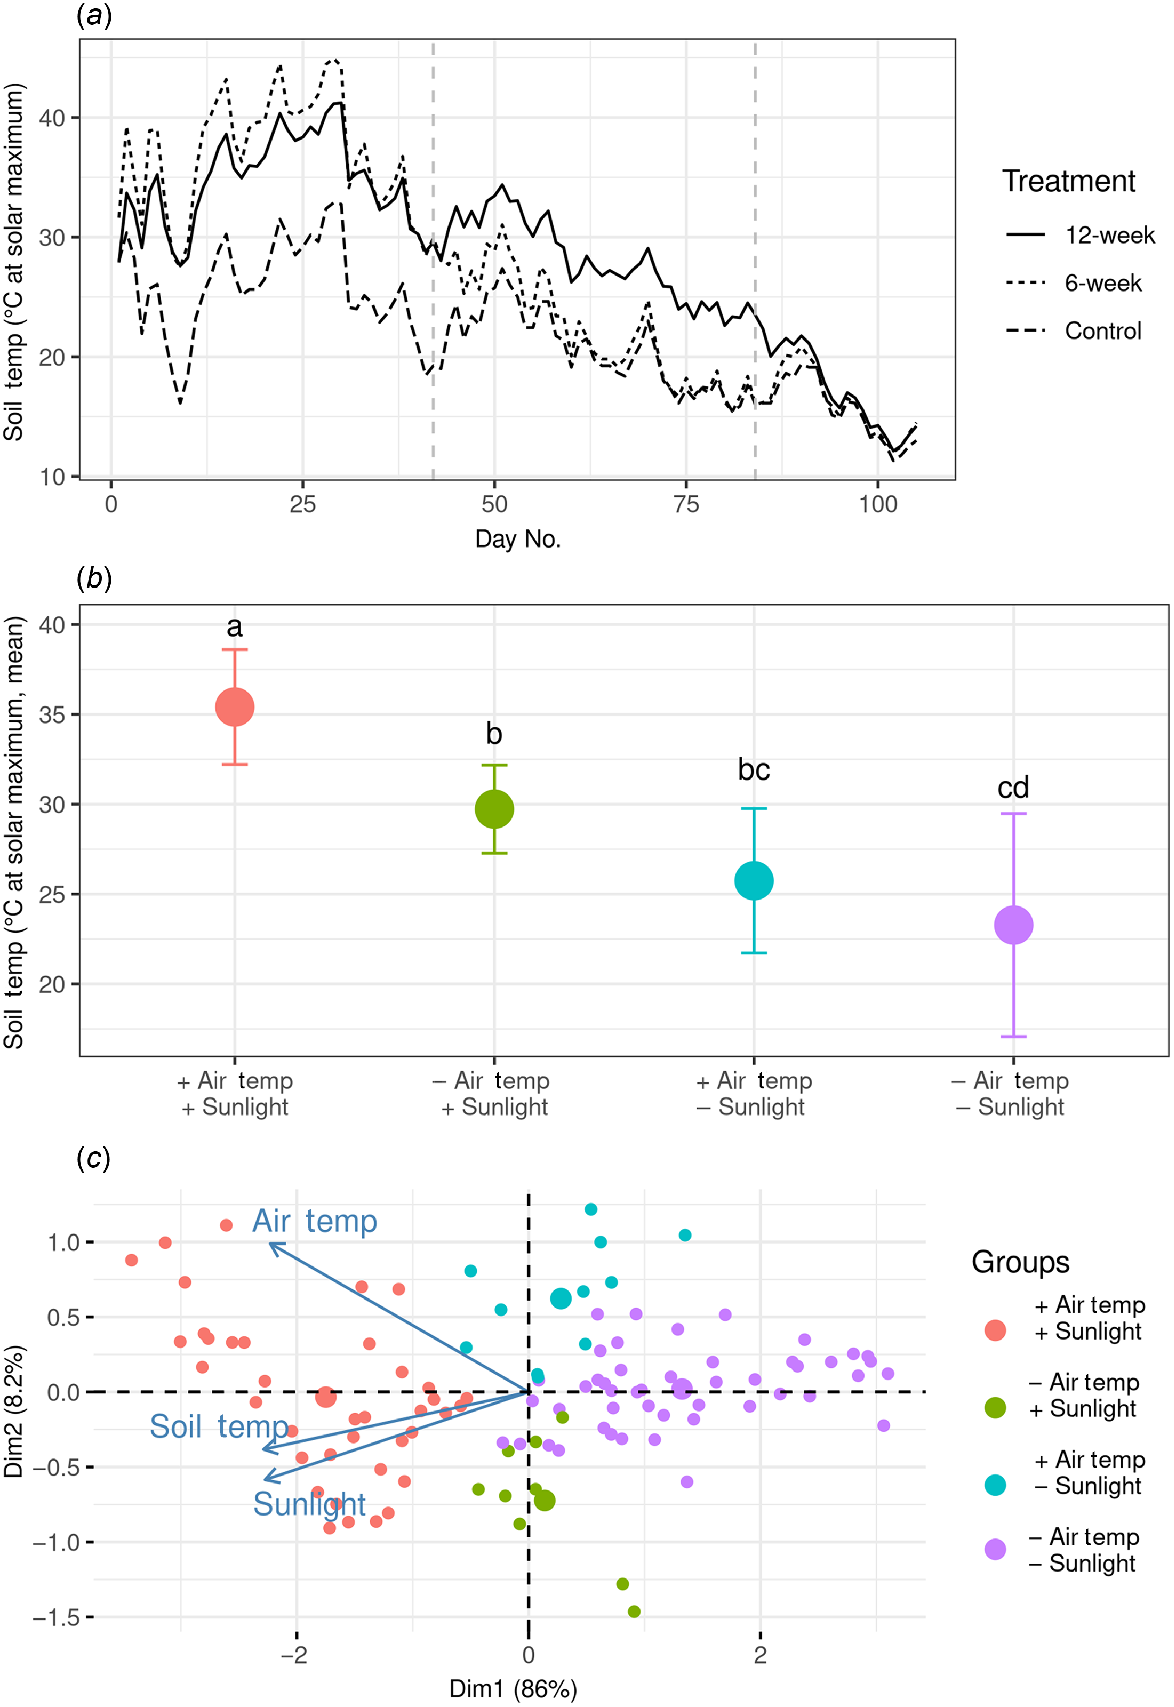
Second, using data from the 12-week treatment, statistical tests were conducted to measure the effect of air temperature and sunlight on soil temperature. A linear regression model was generated using the raw variables. Also, to provide results more readily interpretable by land managers, the two explanatory variables (air temperature and sunlight) were partitioned into categorical variables, with each data point being assigned to the factor ‘high’ (greater than the mean) or ‘low’ (smaller than the mean). The effects of these categorical variables on soil temperature were examined using an ANOVA and Tukey’s post hoc test, and the results were visualised (Fig. 1b).
Third, to mitigate concerns about correlation between the two explanatory variables (air temperature and sunlight), a principal component analysis (PCA) was conducted, and the results visualised (Fig. 1c). The PCA axes were generated using the three key continuous variables: air temperature, sunlight, and soil temperature. The principal component plot was visualised, with points coloured by the predictor variables (sunlight and air temperature) for clarity (Fig. 1c).
All data analysis was conducted in R, using the packages myClim and factoextra for data analysis and ggplot2 and gridExtra for visualisation (Wickham 2016; Auguie 2017; Kassambara and Mundt 2020; Man et al. 2023; R Core Team 2023).
Results
On average, the soil temperature at solar maximum was 31.2°C (s.d., 5.0) in the solarised plots and 23.0°C (s.d., 4.6) in the control plots, over the 12-week period. This indicates that solarisation caused the soil temperature at solar maximum to increase by 8.2°C (s.d., 1.4). The mean air temperature was 24.7°C (s.d., 6.4°C), and the mean UV index (averaged between sunrise and daily maximum) was 2.5 (s.d., 1.1).
The visualised time series of the response variable (soil temperature; Fig. 1a), verifies that the clear plastic did indeed increase the soil temperature. This provides confidence that solarisation was performed successfully during the study. Time series of the input variables (UV index and air temperature) are visualised in the Supplementary material (Fig. S2), along with a time series of the difference in temperature between solarised and control treatments. Both the 6-week and 12-week treatments showed similarly higher soil temperature at daily maximum than the control plots over the first 42 days (Fig. 1a). When the solarisation plastic was removed in the plots assigned to the 6-week treatment, the soil temperature in those plots decayed to the same temperature as in the control plots over approximately 4 days. The difference in soil temperature between solarised and control treatments showed a gradual decrease over the 12-week study period, corresponding to the decrease in sunlight between summer and winter.
The linear regression (Table S1) revealed a strong effect of both sunlight (slope = 8.29; P < 0.01) and air temperature (slope = 0.988; P < 0.01), as well as their interaction (slope = −0.197; P < 0.01) on soil temperature. The ANOVA also supported this conclusion – the soil temperature was highest on days with both high sunlight and high air temperature (Fig. 1b). On days with high sunlight or high air temperature, the soil temperature was moderate, and still higher than days with low sunlight and low air temperature. Sunlight appears to have a slightly greater effect than air temperature, though this difference was not statistically significant (second and third columns in Fig. 1b).
The PCA supported this general conclusion. The biplot revealed that soil temperature was correlated with both sunlight and air temperature (Fig. 1c). Soil temperature appeared more strongly correlated (PCA vector more closely aligned) with sunlight than with air temperature.
Discussion
This study provides two main contributions to the field of existing knowledge on soil solarisation: (1) we use novel solar radiation data to differentiate the influence of air temperature from sunlight; and (2) the soil type in this study lies close to the edge of the texture spectrum (i.e. almost pure clay), providing useful information on the use of solarisation techniques on medium to heavy textured clay soils.
The relative effect of sunlight and ambient temperature on soil solarisation
Although solarisation is not used extensively in Australia, it has been noted that Australia should be a good candidate for solarisation due to its Mediterranean climate and long periods of intense solar radiation (Powles et al. 1988). However, to our knowledge, this claim has not been assessed using solar radiation data.
The results of the statistical analyses point to the conclusions that: (1) air temperature and sunlight are both correlated with high soil temperatures; and (2) solar radiation may influence soil temperature more than air temperature does. Fig. 1b reveals a higher mean soil temperature for days assigned low air temperature and high solar radiation than days assigned high air temperature and low solar radiation, though the difference between these two specific groups was not statistically significant. Likewise, Fig. 1c shows a higher correlation of soil temperature with sunlight than with air temperature. Therefore, both analyses point to the conclusion that soil temperature is more strongly correlated with solar radiation than with air temperature during solarisation. To account for correlation between the variables, these results should be verified with a perfectly crossed experiment – specifically, a laboratory experiment where air temperature and irradiation can be independently controlled.
If our interpretation is correct and is supported experimentally, then this has practical implications for practitioners who can use solar radiation rather than temperature to guide the timing and duration of solarisation. In global terms, temperate Australia (as represented by our study conducted in Adelaide) has extended periods of high solar radiation. To illustrate this point, we compared the local solar radiation regime to places where solarisation is more commonly used and not used. We use openly available global UV data from southern Australia, the Middle East, and western Europe. Fig. 2 shows the wide variance of solar radiation regimes across different parts of the world in terms of timing, duration, and magnitude.
Measured UV data from three locations, roughly representative of western Europe (Rome, Italy), the Middle East (Tel Aviv, Israel) and southern Australia (Adelaide) over 1 year. Data source: (Van Geffen et al. 2017).
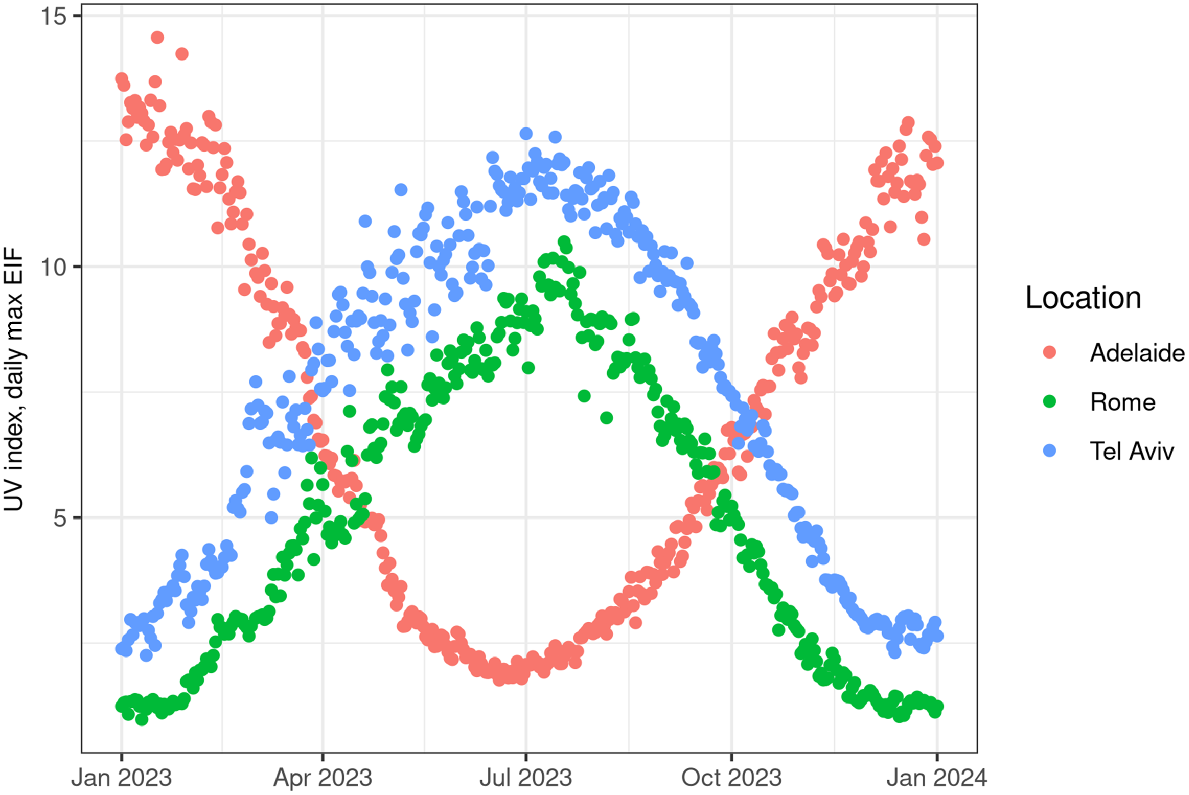
The fact that southern Australia (and by extension, those parts of the continent characterised by a Mediterranean climate) receives high levels of solar radiation in global terms is significant as soil solarisation is still relatively uncommon in Australia. This contrasts with numerous countries where solarisation is employed more regularly (e.g. Argentina, Australia, Egypt, Cameroon, Greece, India, Israel, Italy, Libya, Morocco, Spain, Sudan, Tunisia, the USA, South Africa, and others) for a diverse range of applications (e.g. agriculture, restoration, archaeology) (D’Addabbo et al. 2010; Gill et al. 2017; Kanellou et al. 2023; Shinde et al. 2023).
Solarisation applied to high clay content soils
The study site’s soil was classified as a Black Vertosol, which characteristically contain high amounts of clay, with medium to high clay textures recorded through the solum. These soils are a major feature of large parts of the Australian continent and are generally associated with major floodplains in central Queensland and New South Wales but are relatively uncommon in Southern Australia (Isbell 2021). The fact that they underlie the study site lends them as a good test case for the high end of the texture spectrum encountered in Australia’s Mediterranean climate zone. The high clay content and strong structure of this soil results in a very high-water holding capacity. This may be advantageous in a restoration scenario where adding water prior to solarisation (as recommended as best practice (Abed Gatea Al-Shammary et al. 2020)) is often unfeasible.
In our study, solarisation caused soil temperature to be elevated by 8.2°C on average (s.d., 1.4°) compared to the control plots. This is comparable to other studies conducted on clay soils. For example, Linke (1994) reports a 6.9–8.5°C soil temperature increase for a 60% clay soil in Syria. Similarly, Jacobsohn et al. (1980) report a 8–12°C soil temperature increase for a medium-fine textured soil in Israel, which therefore provides confidence that soil solarisation was performed successfully in this study. Furthermore, Sharma and Nene (1990) report a 10°C temperature difference at 5 cm in a clay soil in India. Interestingly, for the study most geographically proximate conducted just 13 km north-east of our study site, a higher difference in soil temperature between control treatments and solarisation treatments was reported (12°C higher than control at 5 cm; and 11°C higher at 15 cm, for a clay loam soil) (Powles et al. 1988).
It is not clear what variables impacted the higher temperature difference observed between our study site and that reported by Powles et al. (1988). The variation in seasons, stemming from the time disparity between our study and theirs, might have had an impact. Other factors may include the lighter soil texture and the fact that Powles et al. (1988) were able to irrigate their plots to field capacity prior to installing the plastic. Another factor that likely influenced our results is the dark soil colour (black), which would have caused the control soil to absorb more heat than a lighter coloured soil. Regardless, it is noteworthy that significant soil temperature increases are possible without prior irrigation to field capacity, at least on soils with significant clay content that impart a high water holding capacity.
Another observation, which is likely soil specific, was the time delay between the plastic being installed and the soil temperature rising. It took approximately 4 days for soil to reach this average temperature difference after the cover was installed and to return to baseline temperatures after the plastic was removed. This recharge and discharge time results from soil heat storage and highlights the need for consecutive days of high incident solar radiation and/or high ambient temperature for soil to reach high temperatures.
Study limitations
Our study encountered three main limitations. First, this was an observational study. The conclusions from this study could receive greater support from a fully crossed experimental study using different air temperatures and artificial light intensities. Secondly, the study was limited in space and in time. While we contribute to the literature by conducting a study in the under-represented southern hemisphere, it would be beneficial for this study to be replicated at a variety of locations across the southern hemisphere to ensure that the results are generalisable. Likewise, repeating the study at different parts of the year would provide further insight into the influence of timing on the effectiveness of solarisation. Thirdly, the outcome of solarisation depends on the soil type. We conducted this study at a site with a Self-Mulching Black Vertosol soil (Australian Soil Classification (Isbell 2021) code VE AE EI; see Table S2 for the full soil profile description). Repeating the study at additional sites would enable practitioners to be aware of how solarisation might be affected by soil type. Further research could also examine the relative effects of sunlight and temperature on mortality of microbial pathogens and plant propagules in soil. By complementing our results, such research would enrich practitioners’ understanding of the effects of solarisation on both soil temperature and activity of different types of organisms.
Conclusions
The results of this study have practical implications for practitioners implementing soil solarisation in restoration contexts. Restoration practitioners often cannot control all the variables that influence the success of soil solarisation (e.g. temperature, moisture). Practitioners do, however, have relatively good control over the timing of the treatment, which influences the available sunlight. Practitioners can predict sunlight levels based on established models that primarily consider the position of the Earth relative to the sun (e.g. UV index). This has practical implications for practitioners, especially in light of the relative importance of solar radiation in solarisation as identified in this study.
Our findings lead to specific recommendations for conducting soil solarisation. For example, practitioners can focus on conducting solarisation over time periods that are likely to be bright, rather than warm. Cold, bright days are still suitable for solarisation, and practitioners can begin solarisation even during the spring, while soil moisture is still high and leave the plastic in place until the period of peak solar radiation.
Additionally, soil solarisation can be planned around sunlight projections (e.g. UV index) rather than temperature projections. Since sunlight projections are available much further in advance than temperature projections, this enables practitioners to plan soil solarisation much earlier while soil moisture is still relatively high. This reduces the need to artificially water the soil prior to laying the plastic. Consequently, understanding the important role that solar radiation plays during solarisation empowers practitioners to improve the timing of solarisation projects.
Data availability
The data that support this study will be shared upon reasonable request to the corresponding author.
Declaration of funding
MM was supported by an Australian Government Research Training Program (RTP) Scholarship, and the native grassland restoration project discussed is funded by Green Adelaide.
Author contributions
Conceptualisation: MM, RR. Methodology: MM. Fieldwork and data collection: MM. Writing: MM, RR, RS. Data collection and analysis: MM, RR, RS. Supervision: RR, RS.
Acknowledgements
We acknowledge the Kaurna people, the First Peoples of Adelaide where we live and work, and their continuing connection to the land and waters. We pay our respects to all Elders, past and present. We are grateful to M. Breed for providing the TMS data loggers, and to D. Wilson, K. Delaporte, M. Schumacher, and S. Partridge for help setting up the experiment.
References
Abed Gatea Al-Shammary A, Kouzani A, Gyasi-Agyei Y, Gates W, Rodrigo-Comino J (2020) Effects of solarisation on soil thermal-physical properties under different soil treatments: a review. Geoderma 363, 114137.
| Crossref | Google Scholar |
Al-Karaghouli A, Al-Kayssi AW, Hasson AM (1990) The photometric properties of different colored plastic mulches used for soil solarization. Solar & Wind Technology 7, 119-123.
| Crossref | Google Scholar |
ARPANSA (2023) Ultraviolet radiation index, Realtime UV index, Location: Adelaide. Available at https://www.arpansa.gov.au/our-services/monitoring/ultraviolet-radiation-monitoring/ultraviolet-radiation-index
Auguie B (2017) gridExtra: miscellaneous functions for ‘Grid’ graphics. Available at https://CRAN.R-project.org/package=gridExtra
Avissar R, Mahrer Y, Margulies L, Katan J (1986) Field aging of transparent polyethylene mulches: I. Photometric properties. Soil Science Society of America Journal 50, 202-205.
| Crossref | Google Scholar |
Bainbridge DA (1990) Soil solarization for restorationists. Ecological Restoration 8, 96-98.
| Crossref | Google Scholar |
BoM (2023) Daily rainfall for Adelaide in January 2023. Available at http://www.bom.gov.au/climate/current/month/sa/archive/202301.adelaide.shtml
Chen CC (1975) Attenuation of electromagnetic radiation by haze, fog, clouds, and rain. Defense Technical Information Center, U.S. Department of Defense. Available at https://apps.dtic.mil/sti/pdfs/ADA011642.pdf
Cohen O, Gamliel A, Katan J, Shubert I, Guy A, Weber G, Riov J (2019) Soil solarization based on natural soil moisture: a practical approach for reducing the seed bank of invasive plants in wetlands. NeoBiota 51, 1-18.
| Crossref | Google Scholar |
D’Addabbo T, Miccolis V, Basile M, Candido V (2010) Soil solarization and sustainable agriculture. In ‘Sociology, organic farming, climate change and soil science’. (Ed. E Lichtfouse) pp. 217–274. (Springer) doi:10.1007/978-90-481-3333-8_9
Gill HK, Aujla IS, De Bellis L, Luvisi A (2017) The role of soil solarization in India: how an unnoticed practice could support pest control. Frontiers in Plant Science 8, 1515.
| Crossref | Google Scholar | PubMed |
Horowitz M, Regev Y, Herzlinger G (1983) Solarization for weed control. Weed Science 31, 170-179.
| Crossref | Google Scholar |
Jacobsohn R, Greenberger A, Katan J, Levi M, Alon H (1980) Control of Egyptian broomrape (Orobanche aegyptiaca) and other weeds by means of solar heating of the soil by polyethylene mulching. Weed Science 28, 312-316.
| Crossref | Google Scholar |
Kanellou E, Papafotiou M, Economou G, Ntoulas N (2023) Soil solarization as an alternative weed control method for archaeological sites in the Mediterranean region. Sustainability 15, 11324.
| Crossref | Google Scholar |
Kassambara A, Mundt F (2020) factoextra: extract and visualize the results of multivariate data analyses. Available at https://CRAN.R-project.org/package=factoextra
Katan J (1981) Solar heating (solarization) of soil for control of soilborne pests. Annual Review of Phytopathology 19, 211-236.
| Crossref | Google Scholar |
Linke K-H (1994) Effects of soil solarization on arable weeds under Mediterranean conditions: control, lack of response or stimulation. Crop Protection 13, 115-120.
| Crossref | Google Scholar |
Mahrer Y, Avissar R, Naot O, Katan J (1987) Intensified soil solarization with closed greenhouses: numerical and experimental studies. Agricultural and Forest Meteorology 41, 325-334.
| Crossref | Google Scholar |
Man M, Kalčík V, Macek M, Wild J, Kopecký M, Brůna J, Hederová L (2023) myClim: microclimatic data processing. Available at https://CRAN.R-project.org/package=myClim
Powles SB, Charman N, Poole F (1988) Solar heating (solarization) of the soil surface: effect on weed control, and yield of Phaseolus vulgaris. Plant Protection Quarterly 3, 31-35.
| Google Scholar |
R Core Team (2023) R: a language and environment for statistical computing. Available at https://www.R-project.org/
Reddy PP (2012) Soil solarisation. ‘Recent advances in crop protection’. pp. 159–183. (Springer India: New Delhi) doi:10.1007/978-81-322-0723-8_11
Santos JB, Villán DM, Castrillo AdM (2011) Analysis and cloudiness influence on UV total irradiation. International Journal of Climatology 31, 451-460.
| Crossref | Google Scholar |
Sharma SB, Nene YL (1990) Effects of soil solarization on nematodes parasitic to chickpea and pigeonpea. Journal of Nematology 22(4), 658-664.
| Google Scholar |
Shinde YA, Jagtap MP, Patil MG, Khatri N (2023) Experimental investigation on the effect of soil solarization incorporating black, silver, and transparent polythene, and straw as mulch, on the microbial population and weed growth. Chemosphere 336, 139263.
| Crossref | Google Scholar | PubMed |
Van Geffen J, Van Weele M, Allaart M, Van der AR (2017) TEMIS UV index and UV dose operational data products, version 2. Available at http://doi.org/10.21944/TEMIS-UV-OPER-V2
Wickham H (2016) ‘ggplot2: elegant graphics for data analysis.’ (Springer International Publishing: Cham) doi:10.1007/978-3-319-24277-4
Wild J, Kopecký M, Macek M, Šanda M, Jankovec J, Haase T (2019) Climate at ecologically relevant scales: a new temperature and soil moisture logger for long-term microclimate measurement. Agricultural and Forest Meteorology 268, 40-47.
| Crossref | Google Scholar |
Footnotes
1 Total daily rainfall recorded at the closest weather station (Happy Valley Reservoir ~ 2 km east of the study site) was 2.4 mm on 18 January, and 4 mm on 24 January (BoM 2023).