

Phosphorus sorption on tropical soils with relevance to Earth system model needs
Julia Brenner A , Wesley Porter B , Jana R. Phillips A , Joanne Childs A , Xiaojuan Yang A and Melanie A. Mayes A C
A C
A Environmental Sciences Division and Climate Change Science Institute, PO Box 2008, Oak Ridge National Laboratory, Oak Ridge, TN 37831 USA.
B Department of Geosciences, Davis Science Building 241, Middle Tennessee State University, Murfreesboro TN 37132 USA.
C Corresponding author. Email: mayesma@ornl.gov
Soil Research 57(1) 17-27 https://doi.org/10.1071/SR18197
Submitted: 14 July 2018 Accepted: 4 November 2018 Published: 6 December 2018
Journal Compilation © CSIRO 2019 Open Access CC BY-NC-ND
Abstract
Phosphorus (P) availability critically limits the productivity of tropical forests growing on highly weathered, low-P soils. Although efforts to incorporate P into Earth system models (ESMs) provide an opportunity to better estimate tropical forest response to climate change, P sorption dynamics and controls on soil P availability are not well constrained. Here, we measured P and dissolved organic carbon (DOC) sorption isotherms on 23 soils from tropical Oxisol, Ultisol, Inceptisol, Andisol, and Aridisol soils using P concentrations from 10 to 500 mg P L−1, and DOC concentrations from 10 to 100 mg DOC L−1. Isotherms were fit to the Langmuir equation and parameters were related to soil characteristics. Maximum P sorption capacity (Qmax) was significantly correlated with clay content (ρ = 0.658) and aluminium (Al)- or iron (Fe)-oxide concentrations (ρ = 0.470 and 0.461 respectively), and the DOC Qmax was correlated with Fe oxides (ρ = 0.491). Readily available soil characteristics could eventually be used to estimate Qmax values. Analysis of literature values demonstrated that the maximum initial P concentration added to soils had a significant impact on the resultant Qmax, suggesting that an insufficiently low initial P range could underestimate Qmax. This study improves methods for measuring P Qmax and estimating Qmax in the absence of isotherm analyses and provides key data for use in ESMs.
Additional keywords: adsorption isotherm, clay, dissolved organic carbon, iron oxide, phosphorus adsorption.
Introduction
Tropical rainforests play a key role in the uptake of carbon dioxide (CO2) due to their substantial productivity (Pan et al. 2011; Yang et al. 2014). Many tropical soils are highly weathered, and tropical forests are generally considered P limited, such that the extent to which tropical forests can continue to take up CO2 in the future is critically influenced by P availability (Walker and Syers 1976; Elser et al. 2007; Pan et al. 2011; Yang et al. 2014; Wieder et al. 2015; Sun et al. 2017). However, the P cycle has only recently been incorporated into Earth system models (ESMs) (Wang et al. 2010b; Goll et al. 2012; Yang et al. 2014). Reed et al. (2015) identified critical P dynamic processes controlling soil P availability that could be better represented in ESMs, with particular emphasis on P interactions with mineral soils.
Strong adsorption of inorganic phosphate anions (PO43−) to mineral soils exerts a key control on the availability of P to plants and microbes (Lloyd et al. 2001). Phosphate anions initially attach to the highest energy binding sites and then fill lower energy sites (McGechan and Lewis 2002). As P anions accumulate at binding sites, the soil particle surfaces become increasingly negative, decreasing the affinity for P anions as P concentrations increase (Barrow 1978). The prioritisation of higher energy sites before lower energy sites, and a decreasing binding affinity with increasing concentrations results in a nonlinear isotherm where P removal is very strong at low concentrations (Barrow 1978; McGechan and Lewis 2002). Traditionally, the sorption properties of soils have been estimated through two parameters in the Langmuir equation, the maximum sorption capacity (Qmax) and the binding energy coefficient (k) (Barrow 1978; Anghinoni et al. 1996). At least three current ESMs include a P cycle, and all assume sorption capacity is higher in weathered and reactive soils common to the tropics, e.g. Oxisols and Andisols (Wang et al. 2007; Goll et al. 2012; Yang et al. 2014; Yang et al. 2016). However, there is a lack of P sorption studies related to tropical soils (Fontes and Weed 1996; Sato and Comerford 2005; Munhoz et al. 2011) compared with other environments (Anghinoni et al. 1996; Gichangi et al. 2008; Cannon 2010; Bastounopoulou et al. 2011).
A wide spectrum of Qmax and k values in P isotherm studies have been reported for both temperate and tropical soils. For temperate soils, reported Qmax values for North American Ultisols ranged from a mean value of 243 mg P kg−1 (Cannon 2010) to a mean value of 2222 mg P kg−1 (Anghinoni et al. 1996) (Table S1, available as Supplementary Material to this paper). The same variability among and within soil orders exists for tropical soils. Phosphorus Qmax values ranged from 305 to 4487 mg P kg−1 in Brazilian Oxisols (de Campos et al. 2016), and from 3237 mg P kg−1 in an Ultisol to 78616 mg P kg−1 in an Inceptisol (Poudel and West 1999). The specific causes of wide variability have yet to be pin-pointed, but there are three sparsely discussed but critical aspects of P sorption. First, Qmax can be underestimated due to low initial P concentrations added to the soils (Harter 1984). Tropical soils are particularly prone to this potential source of error due to their high P sorption capacities (Walker and Syers 1976; Fontes and Weed 1996; Poudel and West 1999; Elser et al. 2007; Auxtero et al. 2008; Yang et al. 2014; de Campos et al. 2016). Further, there is an absence of reported parameter uncertainties in the current literature, such as standard error or confidence intervals (Ryden et al. 1977; Fox 1982; Anghinoni et al. 1996; Fontes and Weed 1996; Gichangi et al. 2008; Bastounopoulou et al. 2011; Munhoz et al. 2011). Without these uncertainty values, it is difficult to compare sorption parameters from different studies in the same context. Finally, sorption isotherms are often fitted to the Hanes–Woolf linearised form of the Langmuir equation (Ryden et al. 1977; Fox 1982; Anghinoni et al. 1996; Fontes and Weed 1996; Gichangi et al. 2008; Bastounopoulou et al. 2011; Munhoz et al. 2011). The axes of a linearised isotherm are not truly independent of one another because the sorbed concentration (y-axis) is calculated from the equilibrium solute concentration (x-axis). A nonlinear fit is now recommended to avoid an overestimation of correlation between axes (Bolster and Hornberger 2007).
ESMs could readily exploit quantitative relationships between more widely measured soil physicochemical properties and phosphate sorption, if such relationships were available. Sorption of P in tropical soils has been shown to have a strong association with iron (Fe) and aluminium (Al) oxides (Fontes and Weed 1996), which is expected given that the content of Fe- and Al-oxide minerals and the buffering capacity of acidic soils are often directly proportional (McGechan and Lewis 2002). The small particle sizes and high specific surface areas of clays can enhance binding of P (McGechan and Lewis 2002). Soil pH may also impact soil P sorption parameters, as a lower pH results in a more positive charge on hydrous oxides, thus attracting P anions (Sparks 1995). The role of physical characteristics in P sorption is complex, but quantitative relationships between soil properties and sorption can be obtained (Kothawala et al. 2009; Mayes et al. 2012).
The goal of this work is to provide improved quantitative information on P sorption in tropical soils that can be used to improve parameterisation in ESMs. Our specific objectives were to generate P sorption isotherms and Langmuir parameters Qmax and k of A and B horizon soils from locations across the tropical climate zone, and to determine whether any soil characteristics significantly contributed to the variation of observed soil P sorption parameters.
Materials and methods
Soil selection
Twenty-three tropical soils and one sub-tropical soil from both A and B horizons were selected for analysis from an archive of air-dried and sieved (2 mm) soils at Oak Ridge National Laboratory (ORNL) to provide a broad representation of tropical regions (Table 1). Five soil orders (Ultisols, Aridisols, Oxisols, Andisols, and Inceptisols) were obtained from the following sources (Ryan et al. 2004; Bruno et al. 2006; Porder et al. 2006; Russell et al. 2007; Wang et al. 2010a; Vieira et al. 2011; Yavitt et al. 2011; Mage and Porder 2013; Jagadamma et al. 2014; Mayor et al. 2014). Further information on soil characteristics (e.g. soil origin, climate, and parent material) and reference publications can be found in Table S2 (Supplementary Material).

|
Soil characterisation
Samples were air-dried at room temperature for 48 h, ground with mortar and pestle, and passed through a 2-mm sieve to remove roots and small rocks. Soil pH was measured in a 0.005 M CaCl2 solution at a 2 : 1 solution to solid ratio. Total Fe and Al oxides were extracted and determined by the dithionate-citrate-bicarbonate (DCB) method (Loeppert and Inskeep 1996) and analysed by inductively coupled plasma mass spectrometry (ELAN-1600, Perkin-Elmer Corporation, Waltham, MA, USA). Particle size was ascertained using the Buoycous hydrometer method (Gee and Or 2002). For carbon (C), nitrogen (N), and total organic carbon (TOC) content, soil samples were oven-dried overnight at 70°C, ground to a fine powder, and analysed on a LECO TruSpec elemental analyser (LECO Corporation, St. Joseph, MI, USA). The TOC was determined by removing inorganic C by treating the soil with 3 M HCl for 1 h and rinsing 3 times. Total P was prepared using a Lachat digestion block and measured by a Lachat in-line sample preparation and determination instrument (Hach, Loveland, CO, USA) following the Kjeldahl method 13–115–01–1-B (Lachat Instruments, Milwaukee, WI, USA). All concentrations are expressed as a function of soil dry weight.
Phosphorus sorption isotherms
Soils (3 g) were added to 50 mL glass vials along with a 30 mL aliquot of different KH2PO4 concentrations, ranging from 10 to 500 mg P L−1, in duplicate and in a 0.01 M CaCl2 matrix (Graetz and Nair 2000). Blank soil samples, conducted in triplicate, were exposed only to 0.01 M CaCl2. Separate glass vials without soil received 30 mL of each concentration of KH2PO4 in 0.01 M CaCl2 to determine the concentration of added P. Two drops of toluene were added to each vial to inhibit microbial uptake (Gichangi et al. 2008). Vials were capped and placed on a shaker at room temperature for 24 h at 85 oscillations per minute, centrifuged at 453×g for 10 min, filtered using a Millex 0.45-µm filter, and acidified before storage and analysis (Gichangi et al. 2008; Bastounopoulou et al. 2011). Phosphorus remaining in the supernatant was measured by the molybdenum blue method (Murphy and Riley 1962; Drummond and Maher 1995), utilising the Lachat as described above. Supernatant P, and resulting P sorption maximum values, were reported as mg of orthophosphate as phosphorus, or mg PO4-P, per kg dry weight of soil. Dissolved P in the samples was confirmed to be in the form of PO4−3 via ion chromatography (Dionex ICS-2100, Sunnyvale, CA, USA).
Dissolved organic carbon isotherms
Dissolved organic carbon (DOC) isotherms were determined using a C stock acquired from a stream in Georgetown, SC (Gu et al. 1994; Chen et al. 2002). A 30-mL aliquot of DOC concentrations, ranging from 2.5 to 100 mg C L−1 in 0.01 M NaCl, was added to glass vials containing 0.5 g of the <2 mm fraction soil, in duplicate (Mayes et al. 2012). Blank soil samples, conducted in triplicate, were exposed only to 0.01 M NaCl. Vials without soil also received 30 mL of each DOC concentration to determine initial DOC added. Vials were shaken and centrifuged as described above. The supernatant was analysed using a Shimadzu TOC-L CSH/CSN analyser (Shimadzu Corp., Kyoto, Japan).
Fitting to the Langmuir equation
Phosphorus and DOC sorbed concentrations were calculated using the Fox and Kamprath (1970) procedure, where the amount sorbed was calculated as the difference between the concentration added and the concentration remaining in the supernatant. Sorption data were fitted to the non-linear form of the Langmuir equation (Eqn 1) from Mayes et al. (2012) to provide a curve and sorption parameters, utilising a method developed by Bolster and Hornberger (2007), which also calculated the standard error (s.e.) for each parameter, and the goodness-of-fit for the entire equation. In this case, goodness-of-fit measured model efficiency (E), where E = 1 (or 100%) indicated that the model perfectly fit the data. Equations used to calculate s.e. and E can be found in Bolster and Hornberger (2007).

where RE is the amount of P or DOC adsorbed or desorbed (mg kg−1 soil), Xf is the final measured equilibrium solution concentration (mg L−1 solution), Qmax is the maximum sorption capacity (mg kg−1 soil), and k is the binding affinity coefficient (L solution mg−1).
Statistical analysis
Data reported as percentage values were square-root transformed to account for constrained data and conformed to parametric data assumptions for analysis. Data were analysed in JMP 13.2.1 (SAS Institute Inc., Cary, NC, USA). For normally distributed data, analysis of variance (ANOVA) was applied to assess variance by soil order, where P < 0.05 indicated significant differences. A post-hoc Tukey’s test was used to determine where those differences occurred. Variance in non-normal data was determined by a Wilcoxon rank test, where P < 0.05 indicated significant difference. A post-hoc Dunn’s multiple comparison test for pairs was performed to determine where those differences occurred. A Spearman rank test was performed to assess the presence of any statistically significant correlations between Langmuir model sorption parameters (Qmax and k) and soil characteristics. Correlations were considered statistically significant for correlation coefficients that had a P < 0.05, and where significant, the strength of correlation was shown by the Spearman correlation coefficient (ρ).
Results
By fitting the isotherms to the Langmuir equation, the resultant Qmax values ranged from 733.8 mg PO4-P kg−1 (Kenya Aridisol, KA-A) to 3775 mg PO4-P kg−1 (Costa Rica Oxisol, CRO-A) (Table 2), and the mean Qmax value for all soils was 2060 mg PO4-P kg−1 (standard deviation (s.d.) = 767.7). Hawaii Andisols did not reach a sorption maximum over the range of initial P concentrations used in this study, so their isotherm was not represented using the Langmuir equation. To assess correlation and variance among sorptive and physical soil characteristics, soils were pooled together for correlation analysis, and by soil order for variance. Due to low sample size, only Inceptisol, Oxisol, and Ultisol soils were included in the variance analysis. Despite the broad range of values, P Qmax values did not display any significant difference among soil orders (ANOVA, P = 0.07) (Fig. 1).

|

|
KA-A and CRO-A also represented the lowest and highest Qmax values for DOC sorption, establishing a DOC Qmax range of 310.0–6212 mg C kg−1 and a mean of 1876 mg C kg−1 (Table 3). Although an initial Wilcoxon test indicated variance (Wilcoxon, P = 0.02), a post-hoc Dunn’s comparison test exhibited no significant differences among DOC Qmax values by soil order (Dunn’s, P > 0.05).
|
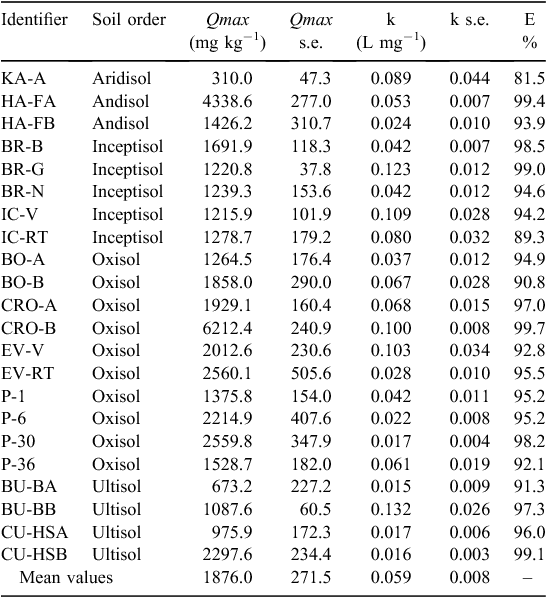
The sorption maxima for P and DOC were significantly positively correlated with each other (Fig. 2). There were no significant relationships among the binding coefficients (Table 4).
|

|
Clay content ranged from 2.25% (Hawaii Andisol, HA-FB) to 67.7% (Costa Rica Oxisol, CRO-B) (Table 5). An initial test of variance indicated that clay content varied by soil order (Wilcoxon, P = 0.02), though a post-hoc Dunn’s comparison did not illustrate significant difference (Dunn’s, P > 0.05). Andisols were primarily composed of sand-sized particles (mean = 65.1%, s.d. = 5.60%), and Oxisols had significantly less sand than both Inceptisols and Ultisols (Tukey, P < 0.05).

|
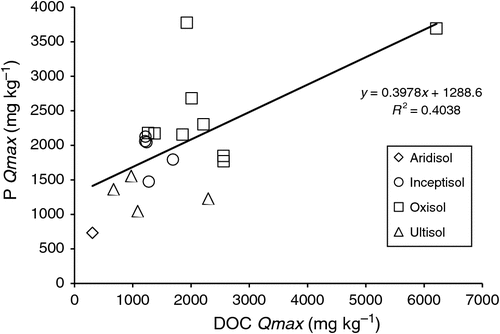
To determine correlative relationships between Qmax and reactive soil properties, the pooled soils were regressed against particle size, pH, Al- and Fe-oxide content, P, C, and TOC (Kothawala et al. 2009; Mayes et al. 2012). Phosphorus sorption maxima exhibited a significant positive correlation with clay content, and a negative correlation with sand content (Table 6, Fig. 3), but no correlations with particle size were found for DOC sorption maxima (Table 6).

|
|
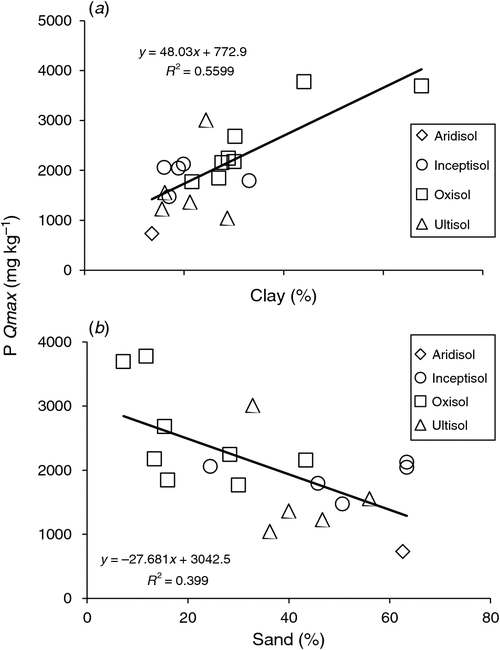
Although Al- and Fe-oxide concentrations did not exhibit significant differences by soil order (ANOVA, P = 0.19 and 0.33 respectively), both covered a wide range of values, with Andisols representing the highest observed Al- and Fe-oxide concentrations. The greatest Al-oxide concentration (9.93 mg g−1, Hawaii Andisol, HA-FA) was greater than the lowest observed concentration (0.35 mg g−1, Puerto Rico Ultisol, IC-V) by a factor of 28, and the greatest Fe-oxide concentration (90.5 mg g−1, Hawaii Andisol, HA-FB) was greater than the lowest observed concentration (1.55 mg g−1, Brazil Ultisol, BU-BA) by a factor of 58 (Table 5). Total P, Al- and Fe-oxides were all positively correlated with P Qmax values (Table 6, Fig. 4), whereas Fe-oxides were the only physical characteristic correlated with DOC Qmax values (Table 6).
|
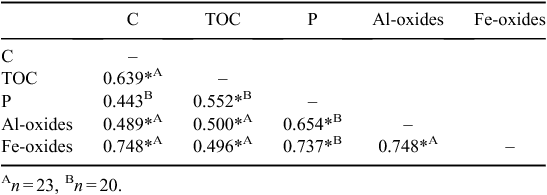
The C content ranged from 0.65% (Brazil Ultisol, BU-BB) to 10.5% (Hawaii Andisol, HA-FB) (Table 5). The TOC was lowest in the Kenya Aridisol (KA-A, 50.8 mg kg−1), and greatest in the Panama Oxisol P-23 (465 mg kg−1) (Table 5). Neither C content nor TOC displayed variance by soil order (ANOVA, P = 0.75; Wilcoxon, P = 0.45 respectively). Total P, however, was sensitive to soil order (Tukey, P = 0.02); Oxisols in our database (mean = 612 mg P kg−1, s.d. = 219, n = 10) had significantly more total P than Ultisols (mean = 295 mg P kg−1, s.d. = 193, n = 5) (Table 5). No correlations were observed between sorption maxima and C, TOC, or P in the pooled soils (Table 7).
|
The soils were acidic, with a mean pH of 4.70 (s.d. = 0.73) (Table 5), which was not sensitive to soil order, though Hawaii Andisols exhibited the highest observed pH values (5.90 and 5.84, HA-FA and HA-FB respectively), and Costa Rica and China Ultisols the lowest (3.58 and 3.66, CRU-V and CU-HSA respectively). No correlations were observed between sorption maxima and pH in the pooled soils (Table 6).
Some correlations between physical properties were observed. The C content was positively correlated with TOC, Al-oxides, and Fe-oxides, but not with total P, although total P was correlated with TOC (Table 7). Total P, Al- and Fe-oxides were also all positively correlated with one another (Table 7).
Discussion
Langmuir sorption parameters
The Langmuir isotherm fits provided adequate representations of the P and DOC isotherms, with acceptable s.e. and E values. Both DOC and P isotherms were also fit to the Freundlich equation because it has been shown to provide a better fit than Langmuir for P (Bolster and Hornberger 2007); however, our Langmuir fits were superior with lower s.e. and higher E values (Brenner et al. 2018). Consequently, only Langmuir fits are discussed here. Despite the wide range of P Qmax values in this study, there was no significant difference among soil orders. Studies have shown that highly weathered soils (i.e. Oxisols and Ultisols) have greater P sorption capacities than less weathered soils (i.e. Inceptisols) (Oades et al. 1989; Yang and Post 2011), and soils with higher amounts of variable charge minerals (i.e. Oxisols and Andisols) also typically have greater P sorption capacities (Oades et al. 1989). Although the absence of significantly different P sorption maxima observed here was unexpected based on the existing literature, it is likely due to the small sample size of the individual soil orders studied, and the relatively high variation in sorption values, particularly the Ultisols (Fig. 1c).
Correlation of Langmuir parameters with soil physiochemical properties
Phosphorus sorption maxima were significantly correlated with both Al- and Fe-oxides, which is in agreement with others that have assessed sorption parameter relationships (Lopez-Hernandez and Burnham 1974; Sakadevan and Bavor 1998; Börling et al. 2001; McGechan and Lewis 2002). However, when graphing the relationship between P sorption maxima and either Al- or Fe-oxides, only 12% and 7.6% of the variation in P sorption maxima could be explained by the resulting linear regression equation respectively (Fig. 4). Gichangi et al. (2008) described the relationship between P Qmax values and DCB-extracted Al- and Fe-oxides with a quadratic function, explaining 89% and 70% of variation in P Qmax values respectively, indicating that these parameters provide a reliable estimation for P sorption. A quadratic function minimally improved the R2 values for describing the relationship between P sorption maxima and either Al- or Fe-oxides (23% and 11% respectively), but since a quadratic fit is unsupported by a mechanistic rationale, the fits are not shown. The low R2 in our linear regressions are likely a result of the small overall sample size and global distribution of soil samples; a larger sample size could potentially provide a statistically reliable equation for estimating P Qmax from DCB-extracted Al- and Fe-oxide concentrations.
Although some studies have found that Al plays a more significant role than Fe in P sorption mechanics for both temperate soils (Lopez-Hernandez and Burnham 1974; Sakadevan and Bavor 1998; Börling et al. 2001) and tropical soils (Fontes and Weed 1996; Poudel and West 1999; Hartono et al. 2005; Gichangi et al. 2008; Alleoni et al. 2012; Chimdi et al. 2013; de Campos et al. 2016), our study found that DCB-extracted Al- and Fe-oxides were similarly correlated with the P Qmax values (ρ = 0.470 and 0.461 respectively). Considering the low R2 values for these parameters in describing P Qmax, this lack of discrepancy in parameter influence is not surprising. Nonetheless, our data did indicate that particle size had a stronger influence on P sorption maxima than Al- or Fe-oxides. Clay was strongly correlated with P Qmax values, where 56% of the variation could be explained by the corresponding linear regression equation (Fig. 3). The high weathering rate of tropical soils leads to an abundance of clay minerals, providing a high surface area and numerous binding sites (McGechan and Lewis 2002). For ESMs, this provides evidence that information about clay content could significantly aid in the estimation of P sorption parameters for tropical soils (Lopez-Hernandez and Burnham 1974; McGroddy et al. 2008; Bruland and DeMent 2009; Moazed et al. 2010; Alleoni et al. 2012). Although P sorption isotherms are not often performed in routine soil analyses, particle size is a frequently measured parameter. Therefore, ESMs could derive sorption parameters via measured clay content, or even estimated clay content based on soil weathering rates, if a solid correlative relationship was available. Other researchers who have assessed relationships with physicochemical parameters disagree about which parameter has the greatest influence. Lopez-Hernandez and Burnham (1974) found that Al- or Fe-oxides had significantly more influence on P sorption than clay content in tropical Oxisols and Ultisols. Hartono et al. (2005) found that Al- and Fe-oxides and clay content were similarly influential in tropical Ultisols, as did de Campos et al. (2016) in a study that analysed tropical Alfisols, Entisols, Inceptisols, Histosols, Mollisols, Oxisols, and Ultisols.
The varying influence of soil physical and chemical parameters on P Qmax values, as well as the variance of P Qmax values themselves, may be further influenced by the soil order or parent material. This was illustrated in particular by the Hawaii Andisols, which never reached a sorption maximum. The Andisols were primarily composed of sand (Table 5), even though sand was negatively correlated with P Qmax values throughout the dataset (Table 6, Fig. 3). The isotherm was approximately linear, indicating strong sorption, which is consistent with documented high sorption capacities of Andisols (Dahlgren et al. 2004; Oades et al. 1989; Fox and Searle 1978; Parfitt 1978). Therefore, it appears that the influence of Al- and Fe-oxides outweighed the influence of particle size among Andisols (Liptzin and Silver 2015; Dahlgren et al. 2004; McGechan and Lewis 2002; Anghinoni et al. 1996; Mehadi and Taylor 1988; Parfitt 1978).
The relationship between P and DOC sorption maxima, though positively correlated, does not tell a straightforward story. Dissolved organic matter and humic acids can compete with P for sorption sites, which can lead to the release of sorbed P, or P can be incorporated into the sorbed complex (Tiessen et al. 1994; Lloyd et al. 2001; Frizano et al. 2003; Guppy et al. 2005). The correlation between DOC and P Qmax values suggests that similar binding sites could be involved; however, the vast difference between DOC and P Qmax values for different soils (ranging from 41.1 mg kg−1 to 2519 mg kg−1) confirms a more complex relationship. This is further complicated by the different correlations between the Qmax parameters and other soil properties. Although P Qmax values were significantly correlated with sand content, clay content, and Al- and Fe-oxides, DOC Qmax values were only significantly correlated with Fe-oxides. However, because our DOC and P sorption maxima were measured separately, the extent of competitive interactions is not known.
Comparison of Qmax values with literature Qmax values
Our Langmuir-calculated P sorption maxima exceeded many of the Qmax values used by Yang et al. (2014) in their ESM (Anghinoni et al. 1996; Gichangi et al. 2008; Bastounopoulou et al. 2011; Munhoz et al. 2011; Wang and Liang 2014). These studies also used notably different maximum P concentrations to calculate the P sorption isotherm, which could lead to an underestimation of P Qmax values (Harter 1984). However temperate soils have been shown to have smaller P sorption maxima (Anghinoni et al. 1996; Cannon 2010; Bastounopoulou et al. 2011; Yang and Post 2011), so a smaller range of initial P concentrations might be appropriate for the soils in those studies. For example, an initial maximum P concentration of 50 mg P L−1 was used for temperate Appalachian soils (Anghinoni et al. 1996). However, because tropical soils are high in oxides and clay-sized particles and tend to have higher P sorption capacities (Walker and Syers 1976; Fontes and Weed 1996; Poudel and West 1999; Elser et al. 2007; Auxtero et al. 2008; Yang et al. 2014; de Campos et al. 2016), higher initial P concentrations may be required to reach the plateau of the isotherm and appropriately fit the Langmuir Qmax parameter. Despite the need for high initial P concentrations, many studies with tropical soils used maximum P concentrations as low as 100 mg P L−1 for soils in Indonesia (Hartono et al. 2005). In our study, the maximum initial P concentration, and resulting Qmax values, was five times as high as concentrations in Hartono et al. (2005). A study by Tiessen et al. (1994) that generated P sorption isotherms for volcanic Oxisols observed Qmax values ranging from 10 to 360 mg PO4-P kg−1, which were notably lower than those observed in our study (Table 2). This discrepancy is most likely due to the low maximum concentration of P added to create their isotherm: 50 mg P L−1, the same maximum concentration used for temperate soils in the study by Anghinoni et al. (1996). In some cases, we found no evidence of P remaining in the supernatant in our study, even with an initial concentration as high as 100 mg P L−1, indicating that the range of initial P concentrations for tropical soils should probably always exceed 100 mg P L−1. An example of our P sorption isotherms can be seen in Fig. 5, where the Qmax and standard error are illustrated for a Puerto Rico Oxisol (EV-V). For this soil, P in solution was below the limit of detection for initial P concentrations ranging from 5 to 50 mg P L−1. Once enough P had been added to the soils to allow P to be detectable in the supernatant, initial P concentrations of 100 and 150 mg P L−1 still only contributed to the linear portion of the isotherm; it was not until an initial P input of 200 mg P L−1 that the isotherm began to curve, therefore confidently establishing a plateau and enabling fitting of Qmax.

|
Studies that used a maximum P concentration comparable to or exceeding our own also found higher P Qmax values. Alleoni et al. (2012) used an initial maximum P concentration of 1200 mg P L−1 for P sorption isotherms in Brazilian Oxisols, and their resulting P Qmax ranged from 2400 to 2600 mg PO4-P kg−1. Poudel and West (1999) analysed tropical volcanic Oxisols, Ultisols, and Inceptisols from the Philippines using initial maximum P concentration of 1000 mg P L−1 and found a mean P Qmax of 12 856 mg PO4-P kg−1. A Spearman rank test on the surveyed literature (Table S1) further cemented the influence that initial P concentration has on final P sorption maxima (ρ = 0.687, P < 0.0001), indicating that Qmax values increase when a higher maximum initial P concentration is used. The need for a greater range of initial P concentrations was also illustrated by our inability to produce a P sorption maximum for the Hawaii Andisols. Their high sorption capacity supports the need to carefully estimate sorption maxima in soils of volcanic origin and in soils with notable concentrations of clays and Al- and Fe-oxides.
Relevance of P isotherms to Earth system models
As ESMs begin to incorporate the P cycle (Wang et al. 2010b; Goll et al. 2012; Yang et al. 2014; Reed et al. 2015), it is important to provide more thorough information on soils in tropical regions, where soil P is low and forest productivity is generally considered high. The studies used by Yang et al. (2014) to estimate P sorption maxima (Anghinoni et al. 1996; Gichangi et al. 2008; Bastounopoulou et al. 2011; Munhoz et al. 2011; Wang and Liang 2014) represent P sorption parameters of non-tropical soils based on isotherms with lower maximum P concentrations, and therefore lower Qmax values may have underrepresented P sorption maxima for tropical ecosystems. Better estimates of P sorption capacity can help to predict plant productivity in highly weathered soils of tropical regions, thus increasing model efficacy. Furthermore, a thorough analysis of the relationships among Qmax, k, particle size, and Al- and Fe-oxides across a wide range of tropical soils could offer stronger linear regressions for estimating sorption parameters, thereby reducing the need for niche P sorption isotherm studies. ESMs could instead obtain sufficient information from more readily available studies that include particle size and Al- and Fe-oxide concentrations.
Conclusions
The Langmuir equation provided a suitable description of P and DOC sorption properties of the tropical soils. Sorption isotherms are infrequently utilized in soil characterization analyses, but this study demonstrated that clay content could be a significant predictor of P Qmax values, offering a strong potential for ESMs to estimate P sorption parameters with more widely available data. To expand the efficacy of this proposed method, it would be useful to analyse these correlations among larger sample sizes from different soil orders, so that the differing influence of soil order and parent material could be better accounted for in ESMs. Our results also suggested that the initial maximum P concentration used in generating isotherms is critical for appropriately estimating P Qmax values. Previous studies may have underestimated P sorption maxima due to insufficient initial P input concentrations. The high sorption capacity of weathered, tropical soils necessitates a maximum concentration that properly approximates the sorption plateau of the isotherm.
Conflicts of interest
The authors declare no conflicts of interest.
Acknowledgements
This research was supported as part of the Next Generation Ecosystem Experiments-Tropics (NGEE Tropics), funded by the USA Department of Energy, Office of Science, Office of Biological and Environmental Research. We would like to acknowledge the support and helpful review comments by Dr Richard Norby of Oak Ridge National Laboratory (ORNL), and we thank the many researchers who contributed soils to ORNL’s tropical soils archive. ORNL is managed by the University of Tennessee-Battelle, LLC, under contract DE-AC05–00OR22725 with the US DOE.
References
Alleoni LRF, Fernandes AR, Jordão CB (2012) Phosphorus availability in an Oxisol amended with biosolids in a long-term field experiment. Soil Science Society of America Journal 76, 1678–1684.| Phosphorus availability in an Oxisol amended with biosolids in a long-term field experiment.Crossref | GoogleScholarGoogle Scholar |
Anghinoni I, Baligar VC, Wright RJ (1996) Phosphorus sorption isotherm characteristics and availability parameters of Appalachian acidic soils. Communications in Soil Science and Plant Analysis 27, 2033–2048.
| Phosphorus sorption isotherm characteristics and availability parameters of Appalachian acidic soils.Crossref | GoogleScholarGoogle Scholar |
Auxtero E, Madeira M, Sousa E (2008) Phosphorus sorption maxima and desorbability in selected soils with andic properties from Azores, Portugal. Geoderma 144, 535–544.
| Phosphorus sorption maxima and desorbability in selected soils with andic properties from Azores, Portugal.Crossref | GoogleScholarGoogle Scholar |
Barrow NJ (1978) The description of phosphate adsorption curves. European Journal of Soil Science 29, 447–462.
| The description of phosphate adsorption curves.Crossref | GoogleScholarGoogle Scholar |
Bastounopoulou M, Gasparatos D, Haidouti C, Massas I (2011) Chemical fractionation and sorption of phosphorus in Greek Inceptisols. Journal of Agricultural Science and Technology A 1, 33–38.
Bolster CH, Hornberger GM (2007) On the use of linearized Langmuir equations. Soil Science Society of America Journal 71, 1796–1806.
| On the use of linearized Langmuir equations.Crossref | GoogleScholarGoogle Scholar |
Börling K, Otabbong E, Barberis E (2001) Phosphorus sorption in relation to soil properties in some cultivated Swedish soils. Nutrient Cycling in Agroecosystems 59, 39–46.
| Phosphorus sorption in relation to soil properties in some cultivated Swedish soils.Crossref | GoogleScholarGoogle Scholar |
Brenner JM, Porter WS, Phillips JR, Mayes MA (2018) Phosphorus sorption to tropical soils with relevance to Earth system model needs. Dataset has been submitted and will be made public upon publication of the current manuscript.
Bruland GL, DeMent G (2009) Phosphorus sorption dynamics of Hawaii’s coastal wetlands. Estuaries and Coasts 32, 844–854.
| Phosphorus sorption dynamics of Hawaii’s coastal wetlands.Crossref | GoogleScholarGoogle Scholar |
Bruno RD, da Rocha HR, de Freitas HC, Goulden ML, Miller SD (2006) Soil moisture dynamics in an eastern Amazonian tropical forest. Hydrological Processes 20, 2477–2489.
| Soil moisture dynamics in an eastern Amazonian tropical forest.Crossref | GoogleScholarGoogle Scholar |
Cannon J (2010) Modeling phosphate adsorption for South Carolina soils. MSc(Hons) thesis. Department of Environmental Engineering and Science, Clemson University. Available at: https://tigerprints.clemson.edu/all_theses/829/ [verified 13 November 2018].
Chen J, Gu B, LeBoeuf EJ, Pan H, Dai S (2002) Spectroscopic characterization of the structural and functional properties of natural organic matter fractions. Chemosphere 48, 59–68.
| Spectroscopic characterization of the structural and functional properties of natural organic matter fractions.Crossref | GoogleScholarGoogle Scholar |
Chimdi A, Gebrekidan H, Tadesse A, Kibret K (2013) Phosphorus sorption patterns of soils from different land use systems of East Wollega, Ethiopia. American-Eurasian Journal of Scientific Research 8, 109–116.
| Phosphorus sorption patterns of soils from different land use systems of East Wollega, Ethiopia.Crossref | GoogleScholarGoogle Scholar |
Dahlgren RA, Saigusa M, Ugolini FC (2004) The nature, properties and management of volcanic soils. Advances in Agronomy 82, 113–182.
| The nature, properties and management of volcanic soils.Crossref | GoogleScholarGoogle Scholar |
de Campos M, Antonangelo A, Alleoni LRF (2016) Phosphorus sorption index in humid tropical soils. Soil & Tillage Research 156, 110–118.
| Phosphorus sorption index in humid tropical soils.Crossref | GoogleScholarGoogle Scholar |
Drummond L, Maher W (1995) Determination of phosphorus in aqueous solution via formation of the phosphoantimonylmolybdenum blue complex. Re-examination of optimum conditions for the analysis of phosphate. Analytica Chimica Acta 302, 69–74.
| Determination of phosphorus in aqueous solution via formation of the phosphoantimonylmolybdenum blue complex. Re-examination of optimum conditions for the analysis of phosphate.Crossref | GoogleScholarGoogle Scholar |
Elser JJ, Bracken MES, Cleland EE, Gruner DS, Harpole WS, Hillebrand H, Ngai TJ, Seabloom EW, Shurin JB, Smith JE (2007) Global analysis of nitrogen and phosphorus limitation of primary producers in freshwater, marine and terrestrial ecosystems. Ecology Letters 10, 1135–1142.
| Global analysis of nitrogen and phosphorus limitation of primary producers in freshwater, marine and terrestrial ecosystems.Crossref | GoogleScholarGoogle Scholar |
Fontes MPF, Weed SB (1996) Phosphate adsorption by clays from Brazilian Oxisols: relationships with specific surface area and mineralogy. Geoderma 72, 37–51.
| Phosphate adsorption by clays from Brazilian Oxisols: relationships with specific surface area and mineralogy.Crossref | GoogleScholarGoogle Scholar |
Fox RL (1982) Some highly weathered soils of Puerto Rico, 3. Chemical properties. Geoderma 27, 139–176.
| Some highly weathered soils of Puerto Rico, 3. Chemical properties.Crossref | GoogleScholarGoogle Scholar |
Fox RL, Kamprath EJ (1970) Phosphate sorption isotherms for evaluation phosphate requirements of soils. Soil Science Society of America Journal 34, 902–907.
| Phosphate sorption isotherms for evaluation phosphate requirements of soils.Crossref | GoogleScholarGoogle Scholar |
Fox RL, Searle PGE (1978) Phosphate adsorption by soils of the tropics. In ‘Diversity of Soils of the Tropics’. (Ed. M Drosdof) pp. 97–119. (ASA and SSSA: Madison, WI)
Frizano J, Vann DR, Johnson AH, Johnson CM, Vieira ICG, Zarin DJ (2003) Labile phosphorus in soils of forest fallows and primary forest in the Bragantina region, Brazil. Biotropica 35, 2–11.
Gee GW, Or D (2002) Particle-size analysis. In ‘Methods of soil analysis: Part 4 physical methods’. (Eds JH Dane, CG Topp) pp. 255–293. (SSSA: Madison, WI)
Gichangi EM, Mnkeni PNS, Muchaonyerwa P (2008) Phosphate sorption characteristics of external P requirements of selected South African soils. Journal of Agriculture and Rural Development in the Tropics and Subtropics 109, 139–149.
Goll DS, Brovkin V, Parida BR, Reick CH, Kattge J, Reich PB, van Bodegom PM, Niinemets Ü (2012) Nutrient limitation reduces land carbon uptake in simulations with a model of combined carbon, nitrogen, and phosphorus cycling. Biogeosciences 9, 3547–3569.
| Nutrient limitation reduces land carbon uptake in simulations with a model of combined carbon, nitrogen, and phosphorus cycling.Crossref | GoogleScholarGoogle Scholar |
Graetz DA, Nair VD (2000) Phosphorus sorption isotherm determination. In ‘Methods of P analysis for soils, sediments residuals and waters’. (Ed. GM Pierzynski) pp. 35–38. (North Carolina State University: Raleigh, NC)
Gu B, Schmitt J, Chen Z, Liang L, McCarthy JF (1994) Adsorption and desorption of natural organic matter on iron oxide: mechanisms and models. Environmental Science & Technology 28, 38–46.
| Adsorption and desorption of natural organic matter on iron oxide: mechanisms and models.Crossref | GoogleScholarGoogle Scholar |
Guppy CN, Menzies NW, Blamey FPC, Moody PW (2005) Do decomposing organic matter residues reduce phosphorus sorption in highly weathered soils? Soil Science Society of America Journal 69, 1405–1411.
| Do decomposing organic matter residues reduce phosphorus sorption in highly weathered soils?Crossref | GoogleScholarGoogle Scholar |
Harter RD (1984) Curve-fit errors in Langmuir adsorption maxima. Soil Science Society of America Journal 48, 749–752.
| Curve-fit errors in Langmuir adsorption maxima.Crossref | GoogleScholarGoogle Scholar |
Hartono A, Funakawa S, Kosaki T (2005) Phosphorus sorption-desorption characteristics of selected acid upland soils in Indonesia. Soil Science and Plant Nutrition 51, 787–799.
| Phosphorus sorption-desorption characteristics of selected acid upland soils in Indonesia.Crossref | GoogleScholarGoogle Scholar |
Jagadamma S, Steinweg JM, Mayes MA, Wang G, Post WM (2014) Mineral control on decomposition of added and native organic carbon in soils from diverse eco-regions. Biology and Fertility of Soils 50, 613–621.
| Mineral control on decomposition of added and native organic carbon in soils from diverse eco-regions.Crossref | GoogleScholarGoogle Scholar |
Kothawala DM, Moore TR, Hendershot WH (2009) Soil properties controlling the adsorption of dissolved organic carbon to mineral soils. Soil Science Society of America Journal 73, 1831–1842.
| Soil properties controlling the adsorption of dissolved organic carbon to mineral soils.Crossref | GoogleScholarGoogle Scholar |
Liptzin D, Silver WL (2015) Spatial patterns in oxygen and redox sensitive biogeochemistry in tropical forest soils. Ecosphere 6, 211
| Spatial patterns in oxygen and redox sensitive biogeochemistry in tropical forest soils.Crossref | GoogleScholarGoogle Scholar |
Lloyd J, Bird MI, Veenendaal EM, Krujit B (2001) Should phosphorus availability be constraining moist tropical forest responses to increasing CO2 concentrations? In ‘Global biogeochemical cycles in the climate system’. (Eds ED Shulze, M Heimann, S Harrison, E Holland, J Lloyd, IC Prentic, D Schimel) pp. 95–114. (Academic Press: San Diego, CA)
Loeppert RH, Inskeep WP (1996) Iron. In ‘Methods of soil analysis: Part 3 chemical methods’. (Eds DL Sparks, AL Page, PA Helmke, RH Loeppert) pp. 639–664. (SSSA: Madison, WI)
Lopez-Hernandez ID, Burnham CP (1974) The covariance of phosphate sorption with other soil properties in some British and tropical soils. European Journal of Soil Science 25, 196–206.
| The covariance of phosphate sorption with other soil properties in some British and tropical soils.Crossref | GoogleScholarGoogle Scholar |
Mage SM, Porder S (2013) Parent material and topography determine soil phosphorus status in the Luquillo Mountains of Puerto Rico. Ecosystems 16, 284–294.
| Parent material and topography determine soil phosphorus status in the Luquillo Mountains of Puerto Rico.Crossref | GoogleScholarGoogle Scholar |
Mayes MA, Heal KR, Brandt CC, Phillips JR, Jardine PM (2012) Relation between soil order and sorption of dissolved organic carbon in temperate subsoils. Soil Science Society of America Journal 76, 1027–1037.
| Relation between soil order and sorption of dissolved organic carbon in temperate subsoils.Crossref | GoogleScholarGoogle Scholar |
Mayor JR, Wright SJ, Turner BL (2014) Species-specific responses of foliar nutrients to long-term nitrogen and phosphorus additions in a lowland tropical forest. Journal of Ecology 102, 36–44.
| Species-specific responses of foliar nutrients to long-term nitrogen and phosphorus additions in a lowland tropical forest.Crossref | GoogleScholarGoogle Scholar |
McGechan MB, Lewis DR (2002) Sorption of phosphorus by soil, part 1: principles, equations and models. Biosystems Engineering 82, 1–24.
| Sorption of phosphorus by soil, part 1: principles, equations and models.Crossref | GoogleScholarGoogle Scholar |
McGroddy ME, Silver WL, de Oliveira RC, de Mello WZ, Keller M (2008) Retention of phosphorus in highly weathered soils under a lowland Amazonian forest ecosystem. Journal of Geophysical Research 113, 1–11.
| Retention of phosphorus in highly weathered soils under a lowland Amazonian forest ecosystem.Crossref | GoogleScholarGoogle Scholar |
Mehadi AA, Taylor RW (1988) Phosphate adsorption by two highly-weathered soils. Soil Science Society of America Journal 52, 627–632.
| Phosphate adsorption by two highly-weathered soils.Crossref | GoogleScholarGoogle Scholar |
Moazed H, Hoseini Y, Naseri AA, Abbasi F (2010) Determining phosphorus adsorption isotherm in soil and its relation to soil characteristics. Journal of Food Agriculture and Environment 8, 1153–1157.
Munhoz RO, Berton RS, de Camargo OA (2011) Phosphorus sorption and redistribution on soil solid phase in Brazilian Haplorthox amended with biosolids. Applied and Environmental Soil Science 2011, 1–7.
| Phosphorus sorption and redistribution on soil solid phase in Brazilian Haplorthox amended with biosolids.Crossref | GoogleScholarGoogle Scholar |
Murphy J, Riley JP (1962) A modified single solution method for the determination of phosphate in natural waters. Analytica Chimica Acta 27, 31–36.
| A modified single solution method for the determination of phosphate in natural waters.Crossref | GoogleScholarGoogle Scholar |
Oades JM, Gillman GP, Uehara G, Hue NV, van Noordwijk M, Robertson GP, Wada K (1989) Interactions of soil organic matter and variable-charge clays. In ‘Dynamics of soil organic matter in tropical ecosystems’. (Eds DC Coleman, JM Oades, G Uehara) pp. 69–95. (University of Hawaii Press: Honolulu, HI)
Pan Y, Birdsey RA, Fang J, Houghton R, Kauppi PE, Kurz WA, Phillips OL, Shvidenko A, Lewis SL, Canadell JG, Ciais P, Jackson RB, Pacala SW, McGuire AD, Piao S, Rautiainen A, Sitch S, Hayes D (2011) A large and persistent carbon sink in the world’s forests. Science 333, 988–993.
| A large and persistent carbon sink in the world’s forests.Crossref | GoogleScholarGoogle Scholar |
Parfitt RL (1978) Anion adsorption by soils and soil materials. Advances in Agronomy 30, 1–50.
Porder S, Clark DA, Vitousek PM (2006) Persistence of rock-derived nutrients in the wet tropical forests of La Selva, Costa Rica. Ecology 87, 594–602.
| Persistence of rock-derived nutrients in the wet tropical forests of La Selva, Costa Rica.Crossref | GoogleScholarGoogle Scholar |
Poudel DD, West LT (1999) Soil development and fertility characteristics of a volcanic slope in Mindanao, the Philippines. Soil Science Society of America Journal 63, 1258–1273.
| Soil development and fertility characteristics of a volcanic slope in Mindanao, the Philippines.Crossref | GoogleScholarGoogle Scholar |
Reed SC, Yang X, Thornton PE (2015) Incorporating phosphorus cycling into global modeling efforts: a worthwhile, tractable endeavor. New Phytologist 208, 324–329.
| Incorporating phosphorus cycling into global modeling efforts: a worthwhile, tractable endeavor.Crossref | GoogleScholarGoogle Scholar |
Russell AE, Raich JW, Valverde-Barrantes OJ, Fisher RF (2007) Tree species effects on soil properties in experimental plantations in tropical moist forest. Soil Science Society of America Journal 71, 1389–1397.
| Tree species effects on soil properties in experimental plantations in tropical moist forest.Crossref | GoogleScholarGoogle Scholar |
Ryan MG, Binkley D, Fownes JH, Giardina CP, Senock R (2004) An experimental test of the causes of forest growth decline with stand age. Ecological Monographs 74, 393–414.
| An experimental test of the causes of forest growth decline with stand age.Crossref | GoogleScholarGoogle Scholar |
Ryden JC, McLaughlin JR, Syers JK (1977) Time-dependent sorption of phosphate by soils and hydrous ferric oxides. European Journal of Soil Science 28, 585–595.
| Time-dependent sorption of phosphate by soils and hydrous ferric oxides.Crossref | GoogleScholarGoogle Scholar |
Sakadevan K, Bavor HJ (1998) Phosphate adsorption characteristics of soils, slags and zeolite to be used as substrates in constructed wetland systems. Water Research 32, 393–399.
| Phosphate adsorption characteristics of soils, slags and zeolite to be used as substrates in constructed wetland systems.Crossref | GoogleScholarGoogle Scholar |
Sato S, Comerford NB (2005) Influence of soil pH on inorganic phosphorus sorption and desorption in a humid Brazilian Ultisol. Revista Brasileira de Ciência do Solo 29, 685–694.
| Influence of soil pH on inorganic phosphorus sorption and desorption in a humid Brazilian Ultisol.Crossref | GoogleScholarGoogle Scholar |
Sparks DL (1995) ‘Environmental soil chemistry.’ (Academic Press: San Diego, CA)
Sun Y, Peng S, Goll DS, Ciais P, Guenet B, Guimberteau M, Hinsinger P, Janssens IA, Peñuelas J, Piao S, Poulter B, Violette A, Yang X, Yin Y, Zeng H (2017) Diagnosing phosphorus limitations in natural terrestrial ecosystems in carbon cycle models. Earth’s Future 5, 730–749.
| Diagnosing phosphorus limitations in natural terrestrial ecosystems in carbon cycle models.Crossref | GoogleScholarGoogle Scholar |
Tiessen H, Chacon P, Cuevas E (1994) Phosphorus and nitrogen status in soils and vegetation along a toposequence of dystrophic rainforests on the upper Rio Negro. Oecologia 99, 145–150.
| Phosphorus and nitrogen status in soils and vegetation along a toposequence of dystrophic rainforests on the upper Rio Negro.Crossref | GoogleScholarGoogle Scholar |
Vieira SA, Alves LF, Duarte-Neto PJ, Martins SC, Veiga LG, Scaranello MA, Picollo MC, Camargo PB, do Carmo JB, Neto ES, Santos FAM, Joly CA, Martinelli LA (2011) Stocks of carbon and nitrogen and partitioning between above- and belowground pools in the Brazilian coastal Atlantic Forest elevation range. Ecology and Evolution 1, 421–434.
| Stocks of carbon and nitrogen and partitioning between above- and belowground pools in the Brazilian coastal Atlantic Forest elevation range.Crossref | GoogleScholarGoogle Scholar |
Walker TW, Syers JK (1976) The fate of phosphorus during pedogenesis. Geoderma 15, 1–19.
| The fate of phosphorus during pedogenesis.Crossref | GoogleScholarGoogle Scholar |
Wang L, Liang T (2014) Effects of exogenous rare earth elements on phosphorus adsorption and desorption in different types of soils. Chemosphere 103, 148–155.
| Effects of exogenous rare earth elements on phosphorus adsorption and desorption in different types of soils.Crossref | GoogleScholarGoogle Scholar |
Wang YP, Houlton BX, Field CB (2007) A model of biogeochemical cycles of carbon, nitrogen, and phosphorus including symbiotic nitrogen fixation and phosphatase production. Global Biogeochemical Cycles 21, 1–15.
| A model of biogeochemical cycles of carbon, nitrogen, and phosphorus including symbiotic nitrogen fixation and phosphatase production.Crossref | GoogleScholarGoogle Scholar |
Wang F, Li Z, Xia H, Zou B, Li N, Liu J, Zhu W (2010a) Effects of nitrogen-fixing and non-nitrogen-fixing tree species on soil properties and nitrogen transformation during forest restoration in southern China. Journal of Soil Science and Plant Nutrition 56, 297–306.
| Effects of nitrogen-fixing and non-nitrogen-fixing tree species on soil properties and nitrogen transformation during forest restoration in southern China.Crossref | GoogleScholarGoogle Scholar |
Wang YP, Law RM, Pak B (2010b) A global model of carbon, nitrogen and phosphorus cycles for the terrestrial biosphere. Biogeosciences 7, 2261–2282.
| A global model of carbon, nitrogen and phosphorus cycles for the terrestrial biosphere.Crossref | GoogleScholarGoogle Scholar |
Wieder WR, Cleveland CC, Smith WK, Todd-Brown K (2015) Future productivity and carbon storage limited by terrestrial nutrient availability. Nature Geoscience 8, 441–444.
| Future productivity and carbon storage limited by terrestrial nutrient availability.Crossref | GoogleScholarGoogle Scholar |
Yang X, Post WM (2011) Phosphorus transformations as a function of pedogenesis: a synthesis of soil phosphorus data using Hedley fractionation method. Biogeosciences 8, 2907–2916.
| Phosphorus transformations as a function of pedogenesis: a synthesis of soil phosphorus data using Hedley fractionation method.Crossref | GoogleScholarGoogle Scholar |
Yang X, Thornton PE, Ricciuto DM, Post WM (2014) The role of phosphorus dynamics in tropical forests – a modeling study using CLM-CNP. Biogeosciences 11, 1667–1681.
| The role of phosphorus dynamics in tropical forests – a modeling study using CLM-CNP.Crossref | GoogleScholarGoogle Scholar |
Yang X, Thornton PE, Ricciuto DM, Hoffman F (2016) Phosphorus feedbacks constraining tropical ecosystem responses to changes in atmospheric CO2 and climate. Geophysical Research Letters 43, 7205–7214.
| Phosphorus feedbacks constraining tropical ecosystem responses to changes in atmospheric CO2 and climate.Crossref | GoogleScholarGoogle Scholar |
Yavitt JB, Harms KE, Garcia MN, Mirabello MJ, Wright SJ (2011) Soil fertility and fine root dynamics in response to 4 years of nutrient (N, P, K) fertilization in a lowland tropical moist forest, Panama. Austral Ecology 36, 433–445.
| Soil fertility and fine root dynamics in response to 4 years of nutrient (N, P, K) fertilization in a lowland tropical moist forest, Panama.Crossref | GoogleScholarGoogle Scholar |