

Influence of hydroperiod on aquatic food-web structure and energy production in a floodplain wetland: implications for environmental flow management
Lindsey K. Frost A * , Sarah J. Mika A , Ross M. Thompson B and Ivor Growns A
A
B
Abstract
Environmental water is often used to manage floodplain wetlands that support many taxa, both terrestrial and aquatic. It is important to optimise the managed hydroperiod to maximise the provision of aquatically derived resources from wetlands.
To test the hypothesis that increasing hydroperiod affects food-web structure and energy production in floodplain wetlands.
Fatty acids and stable isotopes of δ13C and δ15N were used to define food-web structure, and estimate total energy production throughout a managed inundation event in a wetland in the northern Murray–Darling Basin.
Food-web complexity increased with an increasing hydroperiod in line with predictable patterns of community assemblage development, before reducing sharply immediately prior to drying. Energy availability increased with an increasing hydroperiod and there was a strong correlation (ρ = 0.669, P = 0.0001) between energy availability and fatty acid concentration, which was in turn related to patterns of taxon occurrence.
Hydroperiod exerts a strong influence on aquatic invertebrate community trophic dynamics and energy provision. Planned flows should support maturation and stabilisation of the invertebrate community to optimise energy provision to consumers.
Keywords: ecosystem processes, energy, environmental flows, flow regulation, food web, hydrological regime, hydroperiod, wetlands.
Introduction
Wetlands are a vitally important element of riverine landscapes. Temporary floodplain wetlands are particularly important in arid-zone river systems where they contribute to landscape-scale habitat heterogeneity by providing hotspots of ‘booming’ productivity (Junk et al. 1989). These wetlands act variously as rich nursery habitat for channel species in times of connection; breeding grounds for waterbirds, reptiles and amphibians; stepping stones in the landscape for highly mobile migratory and nomadic taxa; and as refuges in drier times (Sheldon et al. 2002; Robson et al. 2013).
Drying is a natural part of the cycle in these wetlands and contributes to the habitat heterogeneity that drives the high productivity and biodiversity seen there. However, alterations to the hydrological regime as a result of human manipulation of water resources and climatic change threaten the delicate and dynamic equilibrium that underpins these systems (Nielsen et al. 2013; Peipoch et al. 2015). Delivery of water as ‘environmental flows’ is now commonly used to mitigate the negative effects of altered flow regimes on floodplain wetlands (Yang et al. 2016).
Environmental flows aim to support overall ecosystem health by maintaining or restoring elements of the natural hydrological regime that encompasses the magnitude, frequency, duration, timing and rate of change of flows (Poff et al. 1997; Tickner et al. 2020). Each of these elements individually and together influences overall ecosystem integrity through effects on biotic and abiotic processes and structure in aquatic ecosystems (Poff et al. 1997; Bunn and Arthington 2002). Much is known about the general ‘flow-ecology’ relationships for many species (Davies et al. 2014) and this informs the design of the environmental flow program. However, although the patterns of response are generally well understood, the mechanisms of response are less so, particularly how hydrology influences trophic dynamics, and there are increasing calls to integrate trophic dynamics into design, monitoring and delivery of environmental flow programs (Robson et al. 2017; Rolls et al. 2017).
Although each element of the hydrological regime is theoretically open to manipulation via environmental flows, the degree of influence managers can exert on systems is limited. In practical terms, there are constraints on water availability; timing and extent of flows must be negotiated with other stakeholders; and flows must be delivered in ways that do not negatively affect surrounding infrastructure and land use. Thus, understanding how various elements of the regime influence target systems is important in maximising benefits from managed flows. In temporary wetlands, duration of inundation, or hydroperiod, has been shown to be a dominant factor in structuring communities (Batzer and Sharitz 2014), and the suite of aquatic taxa able to exploit these environments are defined by their ability to tolerate the effects of periodic drying (Wiggins et al. 1980; Batzer and Wissinger 1996).
In their seminal review of aquatic animals’ adaptations to habitat drying, Wiggins et al. (1980) used desiccation tolerance and avoidance strategies of aquatic invertebrates to classify them into four groups. Group 1 taxa are permanent residents with limited dispersal capacity that tolerate drought through desiccation-resistant life stages or taking refuge in sediments; example taxa include primary consumers such as gastropods, copepods, ostracods. Group 2 taxa are active dispersers that require water for reproduction but may persist through dry periods as desiccation-resistant eggs and larvae; example taxa include coleopterans, ephemeropterans, dipterans and mites. Group 3 taxa are active dispersers that recruit on the recession of water, laying eggs in damp or dry sediment, which then persist as desiccation-resistant eggs and larvae; example taxa include dipterans, odonates and trichopterans. Group 4 taxa are active dispersers that rely on water for reproduction, but lack a desiccation-resistant life stage. Instead, adults inhabit permanent water bodies and migrate to newly established temporary water bodies to exploit resources for breeding; example taxa include odonates, hemipterans, coleopterans and dipterans (Wiggins et al. 1980).
The nature of these drought-tolerance and avoidance strategies results in a predictable succession in temporary wetland invertebrate communities over time, whereby early colonisers of newly wetted habitats are generally small-bodied primary consumers such as members of the zooplankton emerging from desiccation-resistant propagules; followed by larger-bodied insect taxa developing from diapaused eggs or larvae, or from early inundation reproduction; and finally, migrant predatory insects arriving in later stages of inundation. This pattern has been observed to be true in many studies (e.g. Schneider and Frost 1996; Boix et al. 2006; Gleason and Rooney 2018), with strong evidence for increasing invertebrate richness with an increasing hydroperiod.
Patterns of community succession, including in situ development and colonisation, are important in structuring food webs (Post 2002). Food-web structure describes the pathways by which energy can be transferred from primary producers to top-order consumers (Thompson et al. 2012). Food webs are essentially species networks, the simplest element of which is a binary consumer–resource interaction depicted by two linked nodes. The distribution of these nodes and links lends food webs a shape that can be used to characterise food-web structure on the basis of network geometry (Dalu et al. 2017).
It is generally accepted that ecosystems with a greater species richness exhibit a more complex food-web structure (Urban 2004; O’Neill and Thorp 2014) and it follows that if species richness increases with hydroperiod in temporary water bodies, then food-web complexity should also increase with an increasing hydroperiod. However, the existence of an aquatic community relies on the presence of water, so it also stands to reason that as complete desiccation approaches, the food web will begin to collapse as grazing and predation pressure increases on increasingly space-limited resources (Dalu et al. 2017; Mdidimba et al. 2021) and mobile taxa depart the wetland.
Much of the research into aquatic food-web structure has taken place in permanent systems and the processes in temporary systems remain less well understood (O’Neill and Thorp 2014). Equally, there is a strong body of literature investigating effects of habitat size on food-web structure, largely in lake and stream environments (Post et al. 2000; McHugh et al. 2015; McIntosh et al. 2018; Greig et al. 2022). However, recent studies in temporary systems have indicated that in ephemeral water bodies, hydroperiod is a stronger, although possibly correlated, driver of food-web structure than is the ecosystem size per se (Schriever and Williams 2013; Dalu et al. 2017; Mdidimba et al. 2021).
The aquatic food web in a wetland system represents only the lower orders of a much larger, cross-ecosystem food web. Wetlands are renowned for their ability to support high biodiversity. However, in reality biodiversity in the aquatic portion of the community, particularly in fishless systems, is generally quite low in comparison to permanent environments (Mendelssohn et al. 2014). The bulk of the diversity arises from the large and diverse communities of aquatic-dependent taxa such as amphibians, reptiles and waterbirds that reside outside the aquatic environment but are, nevertheless, strongly dependent on aquatic resources (Batzer and Sharitz 2014). In that respect, hydrology-driven changes in the aquatic food-web structure will have a flow-on effect to these higher-order consumers. Given that these higher-order consumers are frequently the conservation target for management with environmental watering (Rolls et al. 2017), it is important to understand both how hydrology influences the aquatic food web and what that means in terms of resource provision to aquatic-dependent taxa.
The value of quantifying energy transfer through food webs is well accepted; however, actual measurement via bomb calorimetry is time consuming and requires substantial biomass. As a result, data on energy content of freshwater invertebrate taxa are limited, and encompass few taxa (although see Bertoli et al. (2018) and Bertoli et al. (2021)). Nonetheless, there is a recognised relationship between organic carbon content and energy density (Salonen et al. 1976) that can be used to calculate energy density where certain parameters are known. There is also a direct relationship between lipid content and organic carbon content, which allows us to predict possible energy-density patterns on the basis of occurrence of particular taxa.
Zooplankton, including the Microcrustacea, are generally considered to have total lipid contents between 60 and 65% of dry weight (Arts 1999), whereas those of aquatic insects range largely between 10 and 30% of dry weight (Hanson et al. 1985). Given that zooplankton are likely to be more lipid-dense (and therefore more energy-dense) but have much lower biomass than insects on an individual basis, we might expect that energy density will increase with time as more insect taxa establish in the community.
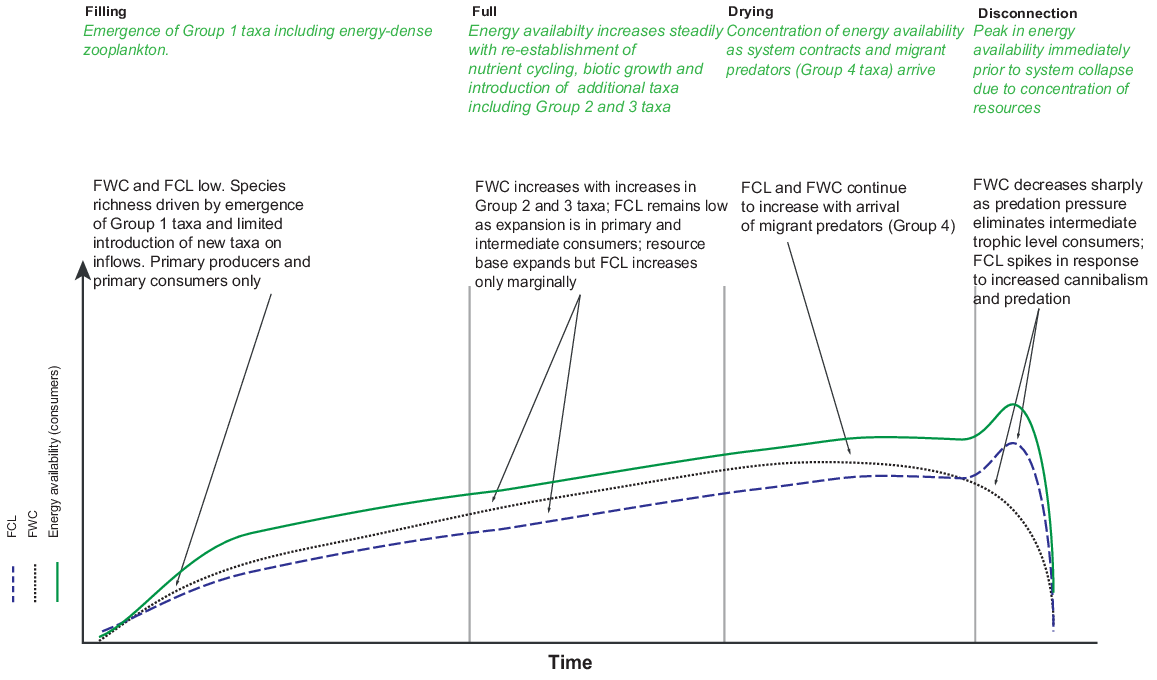
Given our understanding of influence of hydroperiod on community assemblage-mediated changes in trophic structure, we expected to find changes in food-web structure through time. We predicted that we would see a simple food web dominated by Group 1 taxa on early inundation, which would expand laterally with the introduction of Group 2 and Group 3 taxa as hydroperiod increased, and culminate in a food web of maximum height and energy density near to drying, dominated by Group 4 taxa (Fig. 1).
Conceptual model of changes in energy availability, food-web complexity (FWC) and food-chain length (FCL) over time in a temporary waterbody (adapted from O’Neill and Thorp 2014 and L. Frost, unpubl. data).
To investigate the relationship between hydroperiod, the aquatic food web and cross-ecosystem resource provision, we quantified the biomass and energy available from invertebrate prey in the aquatic food web and investigated their distribution in both space and time. Specifically, we tested the following hypotheses:
That community richness would increase with an increasing hydroperiod;
That food-web structure would increase in complexity with an increasing hydroperiod before reducing in response to drying pressures; and
That collectors (including zooplankton) would have the highest per individual energy density but that large-bodied insect predators would contribute most to overall energy availability, resulting in highest energy density in the final drying stage.
Materials and methods
Study site
Our study was undertaken in the Old Dromana Wetland Complex, a Ramsar-listed wetland within the Gwydir State Conservation Area in the northern Murray–Darling Basin in north-western New South Wales, Australia (Fig. 2). These wetlands form an inland delta on the Gwydir River (catchment area of 25 900 km2), a semi-arid lowland river system that flows from the New England Plateau in the east to the Barwon River at Collarenebri in the west (Department of Environment, Climate Change and Water NSW 2011). The lower Gwydir River feeds the Old Dromana Wetland Complex, an area of reclaimed grazing land. The principal land use on the floodplains is private grazing and cropping. Under natural conditions, the area experiences highly irregular flooding regimes.
Location of study area (hashed) within the Old Dromana Wetlands Complex and broader Murray–Darling Basin.
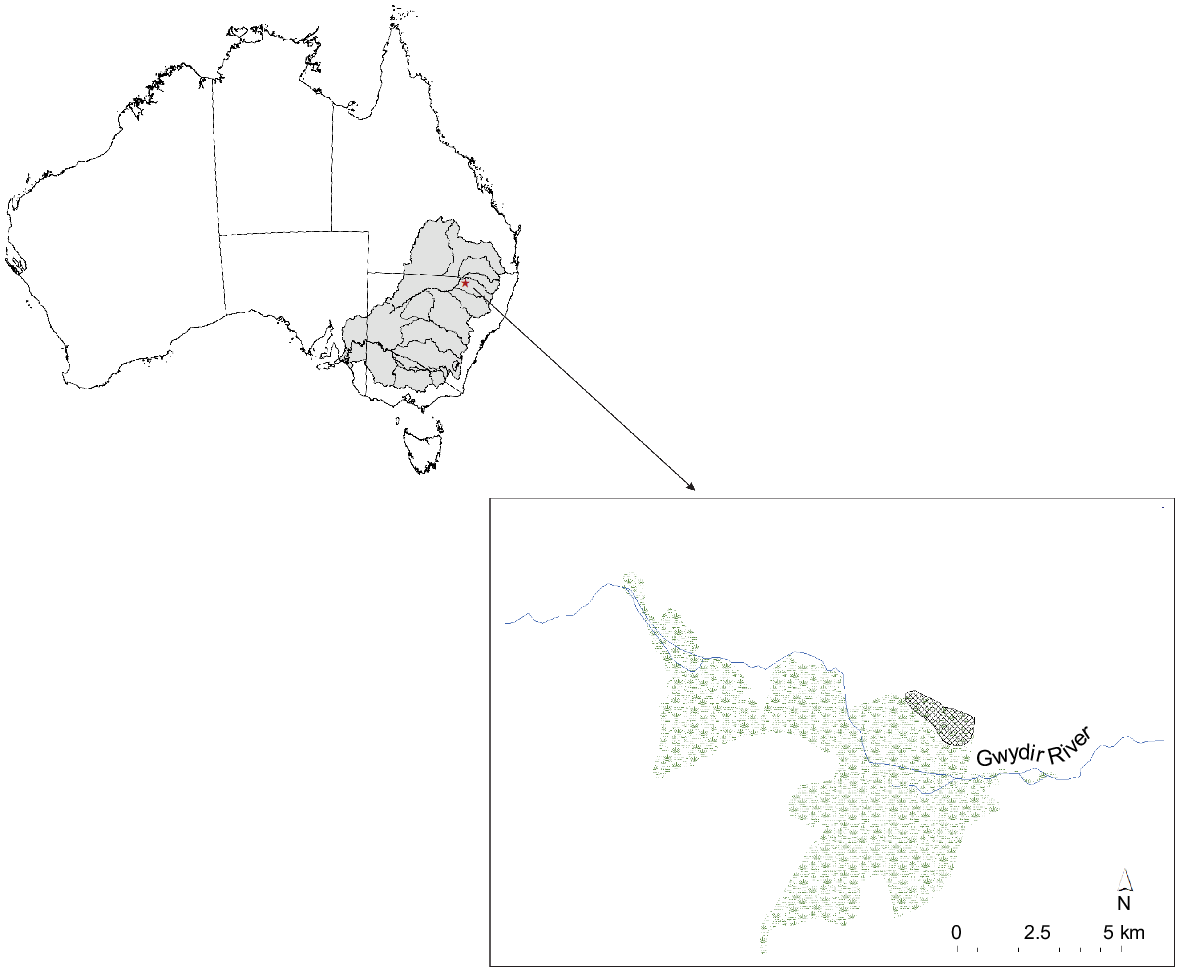
The Gwydir River system is highly regulated by an extensive series of dams, weirs and diversion channels, and flows into the wetland are largely regulated by the largest of these, Copeton Dam upstream of Moree, which supplies ~55% of river flows (Wilson et al. 2010). Wetlands within the Gwydir catchment are a target for management with environmental water under the Murray–Darling Basin Plan and the volume and timing of artificial flows is determined by the New South Wales and Commonwealth governments. In all but the largest floods, flows are retained in the wetlands and floodplain.
The study area is characterised by expanses of water couch marsh grassland, a low, open vegetation community that is intermittently flooded; dense stands of vegetation dominated by Typha spp. and Phragmites spp.; and fringing stands of coolibah woodland (Bowen et al. 2019). Sites were selected in areas with low, open vegetation (site type LOV) that floods intermittently, and tall dense vegetation (site type TDV) in areas where water is retained almost permanently. In total, five sites per habitat type of ~5 × 5 m were sampled haphazardly at three separate times (filling, full and drying stages) over a 135-day period between August and December. This was a wholly managed inundation event with prior knowledge of intended watering volumes and delivery. The periods ‘filling’, ‘full’ and ‘drying’ corresponded to very early inundation, likely maximum extent, and contraction following cessation of deliveries. Maximum extent was later confirmed through satellite-imagery analysis.
Sampling methods
At each site, percentage cover of open water, tall (>1 m) and short (<1 m) emergent and floating aquatic vegetation, inundated terrestrial vegetation and dry ground were estimated, and wetted habitats were sampled proportionately for invertebrates. A minimum of 50 L of water was collected evenly throughout the water column, representing a composite benthic and pelagic sample. A known quantity of this water was then sieved through 2-mm, 1-mm, 63-μm and 16-μm sieves until a sufficient seston sample was collected on the 16-μm sieve. Invertebrates from the 2-mm, 1-mm and 63-μm sieves were retained for separate analysis.
Macroinvertebrate sampling was conducted using a long-handled sweep net with dimensions of 350 mm wide × 250 mm high. The net was swept vigorously through the water column and where emergent macrophytes occurred up emergent stems, for a total of 10 linear metres. All sites bar one (LOV14, 25.94 cm) had an average water depth less than the height of the net opening, meaning that the entire water column was effectively sampled with each sweep. Volume of water sampled was corrected for at each site by using average water depth in place of net opening height, except at LOV14, where net opening height was used. All invertebrate samples were rinsed into sterile polyethylene terephthalate jars by using reverse osmosis (RO)-treated water and stored on ice until they could be frozen at −20°C no later than 6 h after collection.
Laboratory methods
Micro- and macroinvertebrate samples were thawed and rinsed through 2-mm, 1-mm, 425-μm, 250-μm and 63-μm sieves using RO water. All individuals >425 μm of fully aquatic taxa from all samples were picked, counted, identified and separated to family level, except for ostracods, copepods and conchostracans, which were identified and separated to class, subclass and order respectively. Cladocerans were separated into Daphniidae and ‘Others’. Samples were picked and cleaned to be free of sediment and other organic material then freeze-dried to a constant weight. Several samples of microinvertebrates were counted and identified to 63 μm and community composition was not found to differ when all size classes were examined (L. Frost, pers. obs.). As the primary focus of the study required biomass for tissue analyses, effort was put into picking larger individuals rather than counting all individuals sampled. Density (individuals L−1) and biomass (dried weight, mg L−1) were recorded for all taxa.
Tissue fatty acid composition was determined by a direct methylation method as per Parrish et al. (2015). A subsample of tissue (~50 mg) was placed in a glass test tube and then directly transmethylated in a mixture of methanol:dichloromethane:concentrated hydrochloric acid at a ratio of 10:1:1 (v/v) at 80°C for 2 h. Subsequently, 1.5 mL of MilliQ water and a known concentration of an internal standard (C23:0 fatty acid methyl ester, FAME) was added and the mixture was vortex-mixed and then centrifuged (5 min, 1209g, 21 ± 0.5°C) to achieve phase separation. The lower organic layer was removed and reduced under a stream of N2.
The resulting FAMEs were analysed using an Agilent 7890B gas chromatograph equipped with an Agilent Technologies 7683B Autosampler, an Equity-1 fused silica capillary column (15-m × 0.1-mm internal diameter, 0.1-μm phase thickness), a split-splitless injector and a flame ionisation detector with helium as the carrier gas (2 mL min−1). Samples (0.2 mL) were injected splitless at an oven temperature of 50°C, held for 1 min and then the temperature was increased at 10°C per min to 270°C and then at 5°C per min to 310°C, where it was held for 5 min. Peaks were quantified using ChemStation software (Agilent Technologies).
For stable isotope tissue analyses, freeze-dried samples were homogenised in glass jars with stainless steel rods on a bench-top roller table (design modified from Smith and Um 1990 and Arnold and Schepers 2004) or with mortar and pestle. Dry samples were weighed into tin cups (Sercon UK) and analysed for carbon and nitrogen stable isotopes by using a Thermo Scientific Delta V Plus coupled to a Carlo Erba NA1500 elemental analyser by a Conflo V interface. Combustion and reduction were achieved at 1020 and 650°C respectively. Measured stable isotope values were corrected by a three-point calibration against international primary reference standards (NBS-22, NBS-19 and LSVEC for carbon and USGS-34, USGS-35 and IAEA-N3 for nitrogen). In addition, a secondary reference was included every 12 samples to monitor any instrument drift. Carbon and nitrogen content were quantified by comparison of peak area against a response calibration curve. Carbon and nitrogen isotope results are expressed in standard delta (δ) notation against Vienna Pee Dee Belemnite (VPDB) and Air respectively.
Samples containing carbonate (Ostracoda, Helicorbis and Glypotophysa shells + bodies) were weighed into aluminium cups and acidified in the cup by using 5% (m/v) sulfurous acid in small aliquots until effervescence ceased (modified method from Verardo et al. 1990). The samples were dried in a 40°C oven before analysis for organic carbon content. Nitrogen isotope values were measured from unacidified samples. Percentage organic carbon (C) and percentage nitrogen (N) were also recorded.
Energy-density (kJ L−1) values were derived for all taxa by using the general conversion of 46 kJ g−1 of organic carbon (Salonen et al. 1976). Mass of organic C was determined from biomass (mg L−1) and percentage contribution (%C). Mollusc biomass and %C values were corrected to represent body tissue only. Mean percentage contribution of shell and body to overall sample weight was determined from a subset of samples with a known shell weight and bodyweight. Revised weights were applied in all datasets, including energy density, biomass (mg L−1) and fatty acid (FA) concentration (mg g−1).
Because of limited biomass for some samples, not all samples for which biomass values were recorded were able to be analysed for stable isotopes, and thus %C. To obtain an estimate of %C for missing taxa, measured values for the same or similar taxa in different site types and stages were used (Table 1). Where no measured value existed, mean %C values for each model group in each site type were imputed.
| Model group | Taxa included | |
|---|---|---|
| Insecta | BelastomatidaeA , ChironomidaeA , Coenogrionidae, CorixidaeA , CulicidaeA , Dystiscidae (adult)A , Dytiscidae (larvae)A , Gerridae, Haliplidae, Hydraenidae, Hydrophilidae (adult)A , Hydrophilidae (larvae)A , Hygrobiidae, LeptoceridaeA , Mesoveliidae, Microveliidae, NotonectidaeA , Scirtidae, StratiomyidaeA , Syrphidae, TabanidaeA , Veliidae | |
| Microcrustacea | ConchostracaA , OstracodaA , Daphniidae, Other Cladocera | |
| Mollusca | Glyptophysa A , Helicorbis A | |
| Parastacidae | ParastacidaeA |
Data analysis
Taxa were assigned to groups after Wiggins et al. (1980) and functional feeding groups (FFG) after Hawking et al. (2013) (Tables S1 and S2 in the Supplementary material) to compare patterns in space and time. All measured and modelled data points were used in density, biomass and energy-density analyses (n = 332). Only measured values for δ13C and δ15N were used in calculations of food-web metrics and two outliers were removed (n = 130), except for calculation of predator:consumer biomass ratios, which used measured biomass for all taxa (n = 332).
All FA concentration (mg g−1), biomass (mg L−1) and energy-density (kJ L−1) data were fourth-root transformed to reduce the weighting of outliers in the data when calculating the similarities among samples. Fatty acids were considered as overall profiles, and essential polyunsaturated fatty acids (EPUFA) 18:3w3 (ALA); 18:2w6 (LIN); 20:4w6 (ARA); 20:5w3 (EPA); 22:6w3 (DHA).
Statistical models took the form of either a two-factor, fully crossed design with fixed factors of site type and stage, in which site type had two levels (TDV and LOV), and stage had three levels (filling, full and drying); or a three-factor fully crossed design with fixed factors of site type, stage and FFG, in which FFG had four levels (scraper, collector, shredder and predator). Life-history strategy groups (Wiggins et al. 1980) were applied as vectors in ordinations, but were not a factor in ANOVAs.
All univariate and multivariate analyses were conducted using PRIMER (ver. 7, see https://www.primer-e.com/) with PERMANOVA+ add on (Anderson et al. 2008). Resemblance matrices were calculated using Euclidean distance. We used permutational ANOVA (PERMANOVA) (Anderson 2001) to test for differences in all univariate and multivariate response variables. The significance of multivariate analyses was determined using permutation of residuals under a reduced model with Type III sums of squares with 9999 permutations. For univariate analyses, unrestricted permutations of raw data were used. We used the SIMPER routine to identify sources of dissimilarity among factor groups and the RELATE test with Spearman rank correlation to investigate the relationships among multivariate datasets.
The δ13C values for consumers with a C:N ratio greater than three and a half were corrected for lipid content by using the equation provided in Post et al. (2007). Preliminary analyses indicated that site type had no influence on the distribution of stable isotope values; so, samples from both site types were pooled and assessed only with respect to stage. Snails in the family Planorbidae (scrapers) were ubiquitous and abundant in all stages of inundation and were used as the baseline to normalise consumer δ15N values for estimates of trophic position. Actual δ15N values were used in calculation of all other food-web metrics. Food-web metrics excluding total area (TA) were calculated using the SIBER package (ver. 2.1.6, see https://cran.r-project.org/package=SIBER; Jackson et al. 2011) implemented in R (ver. 4.1.2, R Foundation for Statistical Computing, Vienna, Austria, see https://www.r-project.org/). SIBER provides summary Layman metrics (Layman et al. 2007) from sample data and also fits a Bayesian model to the data to support statistical comparison of these metrics among communities. Models were run using default parameters. Grouping of samples into functional feeding groups resulted in only two groups in the filling stage; so, calculation of TA within SIBER by using central group values was not possible. As an alternative, we derived convex hulls encompassing all data points by using ggplot2 (ver. 3.3.4, see https://cran.r-project.org/src/contrib/Archive/ggplot2/ggplot2_3.3.4; Wickham 2009) and calculated TA for each stage by using the shoelace method (Lee and Lim 2017).
Results
Community structure
We picked and identified 29 004 aquatic invertebrates representing 32 distinctive taxonomic groups. Four and five taxa were unique to TDV and LOV site types respectively. Taxon richness, density and biomass did not differ significantly between site types but did across stages, all increasing with the length of inundation (P < 0.05, Table 2). Invertebrate densities significantly increased from filling to drying in both LOV and TDV sites (P < 0.01; Fig. 3a). However, differences in densities between site types were inconsistent through hydrological stages (P = 0.0359), driven by the greater increase in density at LOV sites during the drying stage (P < 0.05, Table 2, Fig. 3a). Biomass significantly increased through each stage of inundation (P < 0.001, Table 2, Fig. 3b) and was similar across site types (Table 2). Note that for all metrics, variability was particularly high in the LOV sites in the drying stage.
| Between site types | Between stages | Site × stage | Pairwise tests (Term – Pair) | |||||
|---|---|---|---|---|---|---|---|---|
| Pseudo-F | P | Pseudo-F | P | Pseudo-F | P | |||
| Richness | 0.0045 | 0.9488 | 33.14 | 0.0001 | 1.0315 | 0.3708 | Stage – Stage All stages differ (P < 0.005) | |
| Density (individuals L−1) | 1.1477 | 0.3165 | 8.0715 | 0.0001 | 1.8767 | 0.0359 | Site × Stage – Site type LOV differs from TDV in drying (P < 0.05) Site × Stage – Stage All stages differ in TDV and LOV (P < 0.01) | |
| Biomass (mg L−1) | 1.4643 | 0.1249 | 14.383 | 0.0001 | 1.468 | 0.0614 | Stage – Stage All stages differ (P < 0.001) | |
Bold formatting indicates P < 0.05. Outcomes for pairwise tests are given for all terms and pairs where significant differences were observed.
Contribution of each functional feeding group to (a) density (individuals L−1) and (b) biomass (mg L−1) in each site type and stage.
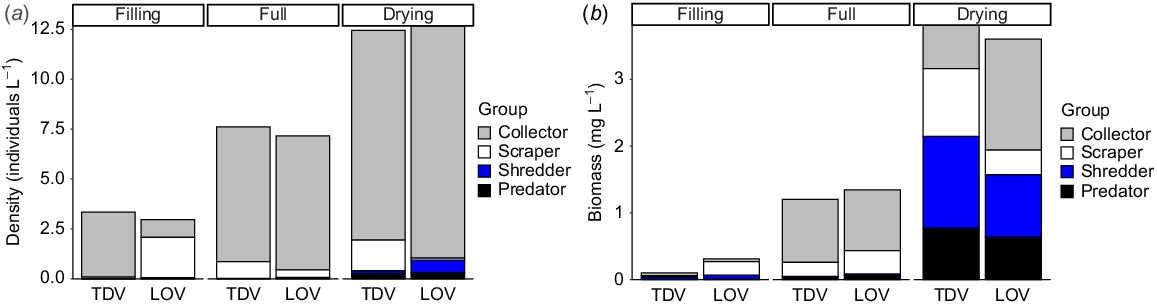
For all metrics considered above, observed differences were driven by invertebrate assemblage, although the taxa exerting the most influence varied for different metrics. Differences in invertebrate density over time were driven by abundant, small-bodied taxa, including ostracods and chironomids (collectors) and Helicorbis sp. snails (scrapers) (Fig. 3a). However, when considering biomass, larger-bodied and more carbon-rich taxa such as Glyptophysa sp. snails, notonectids and adult hydrophilids contributed more to observed differences, and the influence of predators and shredders, particularly in later stages, became clear (Fig. 3b, Table 3).
| Metric | Taxon (FFG) | Mean value | Percentage contribution | Mean value | Percentage contribution | Mean value | Percentage contribution | ||||
|---|---|---|---|---|---|---|---|---|---|---|---|
| Fill | Full | Fill | Dry | Full | Dry | ||||||
| Density (individuals L−1) | Ostracoda (C) | 0.709 | 1.310 | 25.95 | 0.709 | 1.200 | 19.94 | 1.310 | 1.20 | 12.76 | |
| Chironomidae (C) | 0 | 0.871 | 22.20 | 0 | 0.181 | (<10) | 0.871 | 0.181 | 11.44 | ||
| Helicorbis (S) | 0.422 | 0.795 | 12.97 | 0.422 | 0.430 | 11.54 | 0.795 | 0.430 | (<10) | ||
| Copepoda (C) | 0.512 | 0.45 | (<10) | 0.512 | 1.120 | 16.84 | 0.450 | 1.120 | 19.36 | ||
| Biomass (mg L−1) | Ostracoda (C) | 0.263 | 0.781 | 18.58 | 0.263 | 0.722 | 11.62 | 0.781 | 0.722 | (<10) | |
| Chironomidae (C) | 0 | 0.575 | 17.01 | 0 | 0.101 | (<10) | 0.575 | 0.101 | (<10) | ||
| Glyptophysa (S) | 0.253 | 0.648 | 12.87 | 0.253 | 0.779 | 12.46 | 0.648 | 0.779 | (<10) | ||
| Notonectidae (P) | 0 | 0 | 0 | 0 | 0.681 | 14.19 | 0 | 0.681 | 15.33 | ||
| Hydrophilidae adult (Sh) | 0.362 | 0.338 | (<10) | 0.362 | 0.941 | 13.16 | 0.338 | 0.941 | 13.97 | ||
Mean values are transformed values. Italic formatting indicates taxa contributing <10% to dissimilarity for that stage pair.
Hydrophilid adults (Group 2) comprised 97.36% of the total average shredder density (individuals L−1) across all sites and times. For predators, notonectids (Group 4) comprised 33.07%, followed by dytiscid adults (Group 4, 19.38%), hydrophilid larvae (Group 2, 14.13%) and corixids (Group 4, 13.89%). The only predators present in the full stage were hydrophilid larvae (Group 2) and no Group 4 taxa appeared until the drying stage. Collector density was dominated by ostracods (Group 1, 68.58%) and copepods (Group 1, 21.74%), and scrapers were dominated by Helicorbis snails (Group 1, 92.73%).
Food-web structure
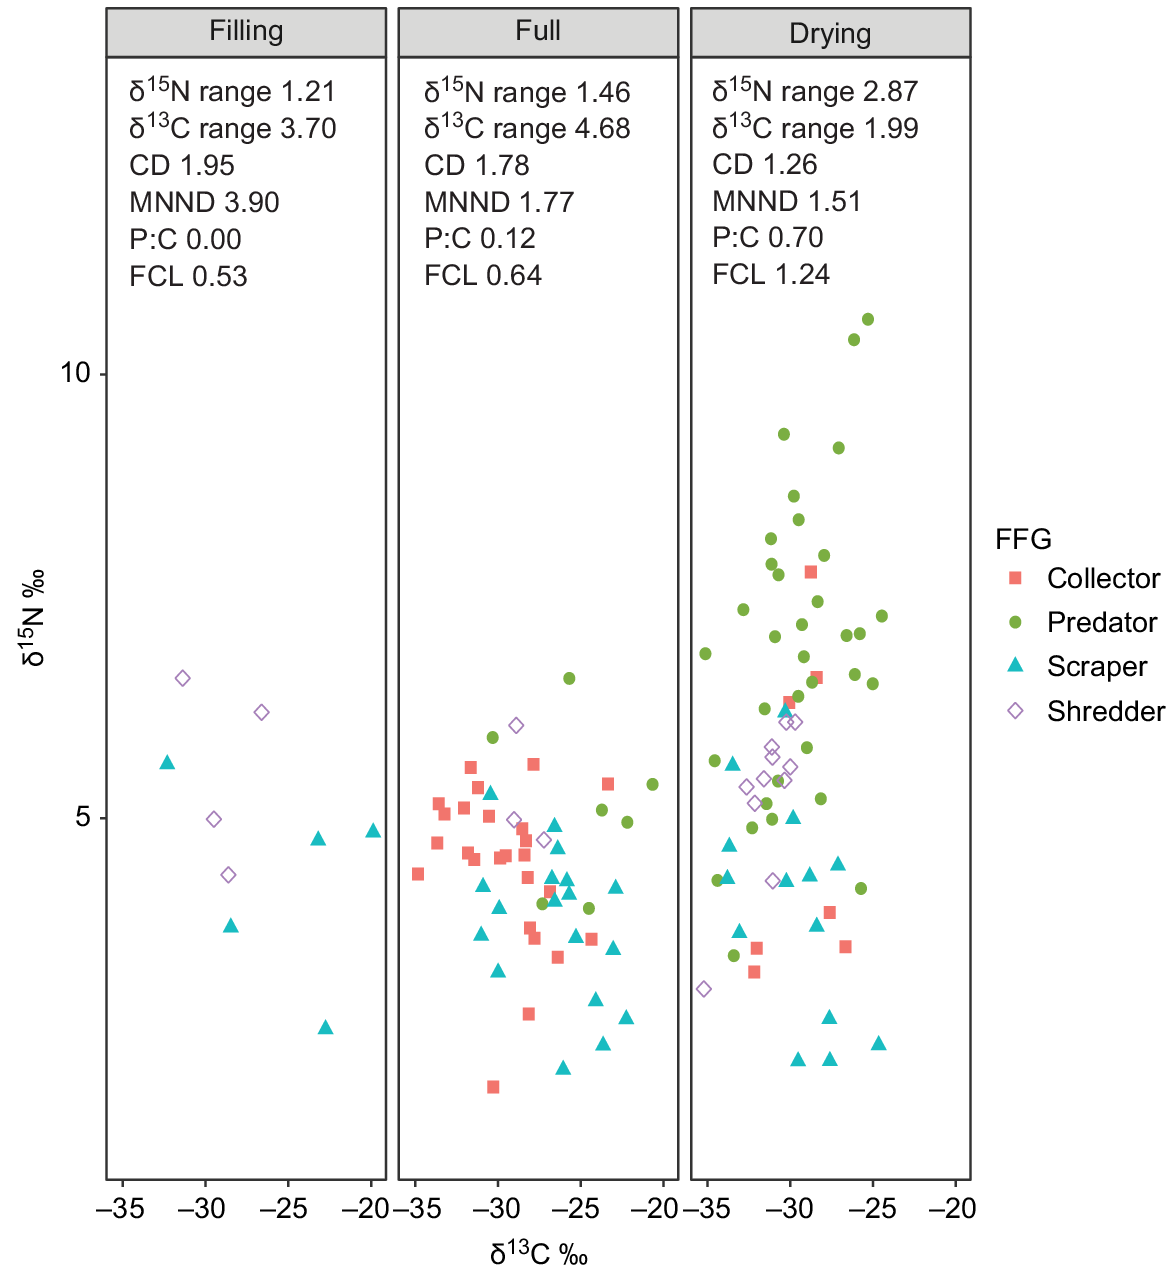
The δ15N range, food-chain length (FCL) and predator:consumer biomass ratios all increased over time (Fig. 4, Table 4). The increase in these metrics was markedly greater between the full and drying stages and appeared to be in direct response to the immigration of Group 4 predators in the drying stage. The δ13C range increased from the filling to full stages, indicating a broadening of basal resource integration between these two stages, but then contracted sharply in the drying stage to the lowest range of the entire inundation period (Fig. 4). In addition to changes in range, δ13C values appeared to shift from the filling to full and drying stages, showing a general decrease in δ13C enrichment over time.
Biplot of all sample points by functional feeding group and stage and associated food-web metrics. Values displayed are means of actual sample data. Food-chain length (FCL) calculated from baseline-corrected δ15N values; predator:consumer biomass ratio (P:C) calculated from biomass data (mg L−1).
| Item | Filling | Full | Drying | |
|---|---|---|---|---|
| δ15N range | 1.19 (−0.10–2.59) | 1.66 (0.52–3.21) | 2.88 (2.20–3.56) | |
| Food-chain length | 0.25 (−0.12–2.04) | 0.93 (0.08–2.36) | 1.32 (0.71–1.97) | |
| δ13C range | 3.75 (1.92–5.52) | 4.70 (3.65–5.80) | 1.99 (1.25–3.04) | |
| Distance to centroid | 1.97 (1.07–2.91) | 1.82 (1.35–2.36) | 1.29 (1.01–1.59) | |
| Mean nearest-neighbour difference | 3.94 (2.14–5.83) | 1.77 (1.15–2.57) | 1.50 (1.01–1.94) |
Food-chain length calculated from baseline-corrected δ15N values.
Distance to centroid (CD), which describes the average degree of trophic diversity in a food web, decreased over time, indicating a reduction in trophic diversity with an increasing hydroperiod. Mean nearest-neighbour distance (MNNND), which describes the density of species packing, also reduced over time, indicating increased trophic redundancy with an increasing hydroperiod.
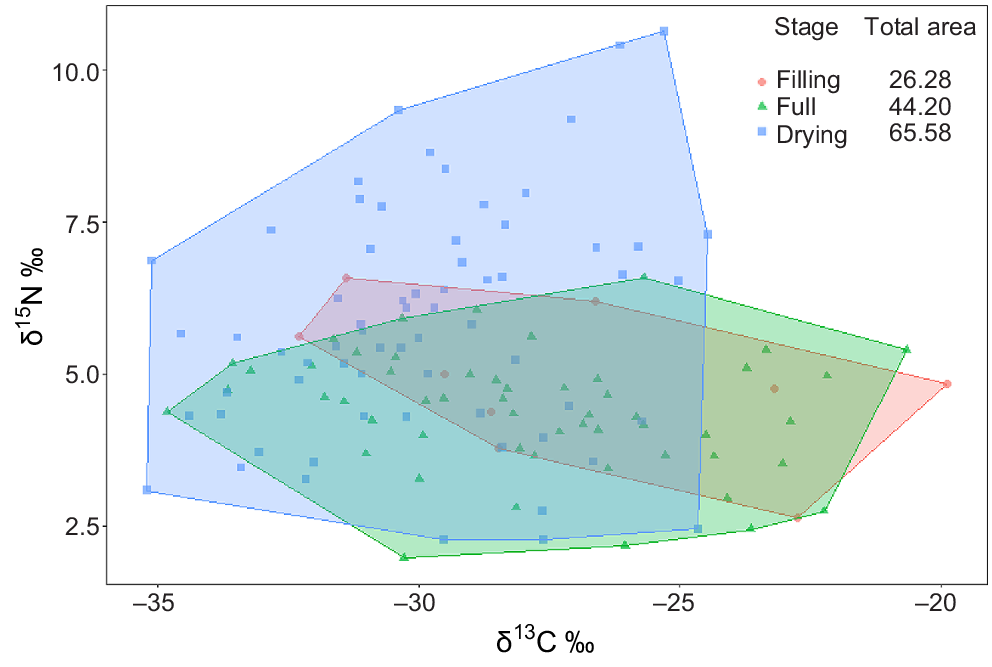
Total area (TA) of convex hulls increased with an increasing hydroperiod (Fig. 5). As expected from changes observed in δ15N and δ13C values, the increase in TA from filling to full stage was a result of broadening of hull width, with very little vertical expansion. However, the increase from full to drying stage reflects a sharp increase in vertical dimension, alongside a contraction on the horizontal axis (Fig. 5).
Energy density
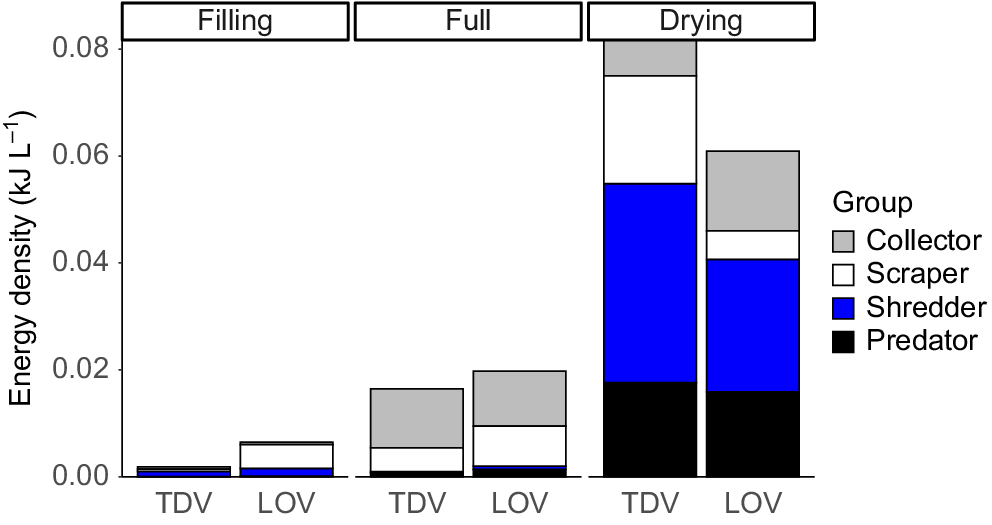
Energy density increased significantly (P = 0.0001) in both site types through each stage of inundation (Fig. 6, Table 5). However, although LOV sites contained more energy in the filling and full stages, there was a significant interaction between site and stage (P = 0.032, Table 5), driven by greater increases in energy density in the TDV sites during the drying stage (P < 0.05, Fig. 6). Energy density was strongly correlated with invertebrate total FA concentration (mg g−1) (ρ = 0.669, P = 0.0001), and similarly to other metrics was clearly influenced by community composition. (Table 6).
Contribution of each functional feeding group to energy density (kJ L−1) in each site type and stage.
| Item | Between site types | Between stages | Site × stage | Pairwise tests (Term – Pair) | ||||
|---|---|---|---|---|---|---|---|---|
| Pseudo-F | P | Pseudo-F | P | Pseudo-F | P | |||
| Energy density (kJ L−1) | 1.7088 | 0.0484 | 15.444 | 0.0001 | 1.5453 | 0.032 | Site × Stage – Site type LOV differs from TDV in drying (P < 0.05) Site × Stage – Stage All stages differ in TDV and LOV (P < 0.01) | |
Bold formatting indicates P-values significant at P < 0.05. Outcomes for pairwise tests are given for terms and pairs where significant differences were observed.
| Metric | Taxon (FFG) | Mean value | Percentage contribution | Mean value | Percentage contribution | Mean value | Percentage contribution | ||||
|---|---|---|---|---|---|---|---|---|---|---|---|
| Fill | Full | Fill | Dry | Full | Dry | ||||||
| Energy density (kJ L−1) | Chironomidae (C) | 0 | 0.219 | 18.76 | 0 | 0.039 | (<10) | 0.219 | 0.039 | (<10) | |
| Glyptophysa (S) | 0.097 | 0.248 | 14.35 | 0.097 | 0.282 | 11.45 | 0.248 | 0.282 | (<10) | ||
| Ostracoda (C) | 0.083 | 0.230 | 11.81 | 0.083 | 0.226 | (<10) | 0.230 | 0.226 | (<10) | ||
| Notonectidae (P) | 0 | 0 | (<10) | 0 | 0.269 | 15.75 | 0 | 0.269 | 16.60 | ||
| Hydrophilidae adult (Sh) | 0.141 | 0.131 | (<10) | 0.141 | 0.375 | 15.57 | 0.131 | 0.375 | 16.24 | ||
Mean values are transformed values. Italic formatting indicates taxa contributing <10% to dissimilarity for that stage pair.
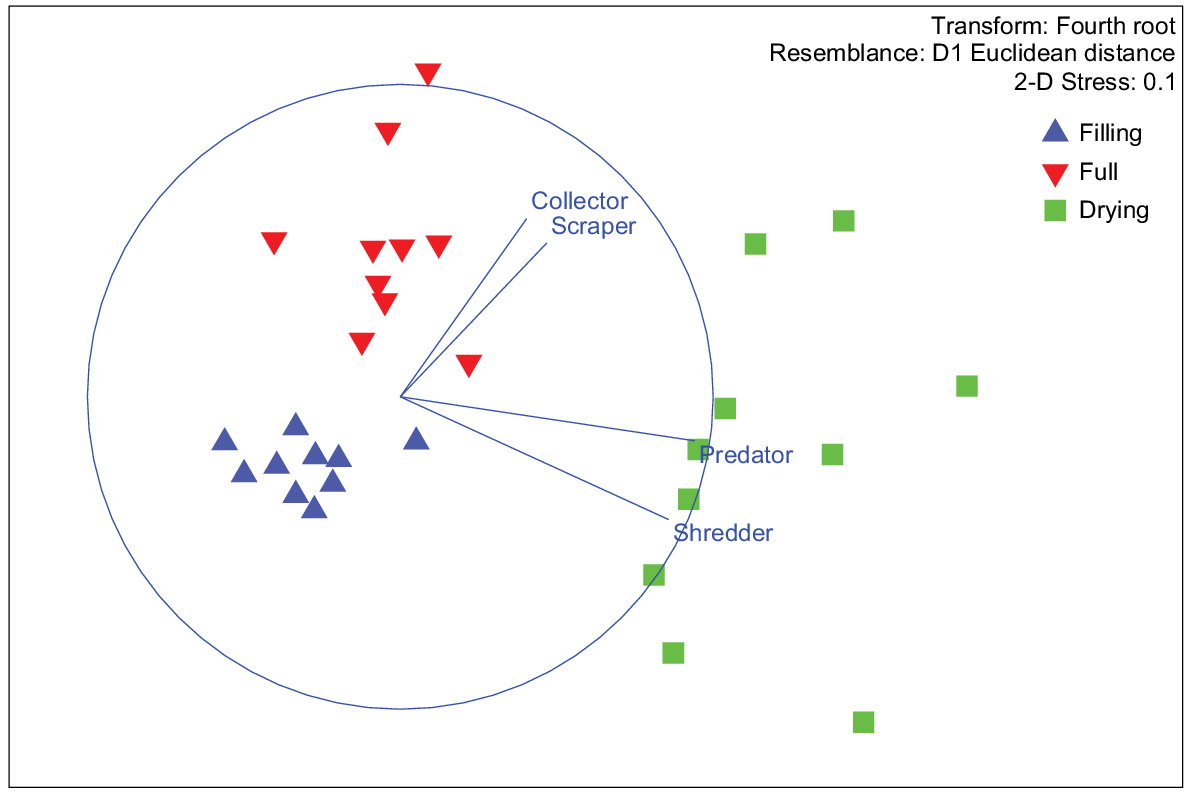
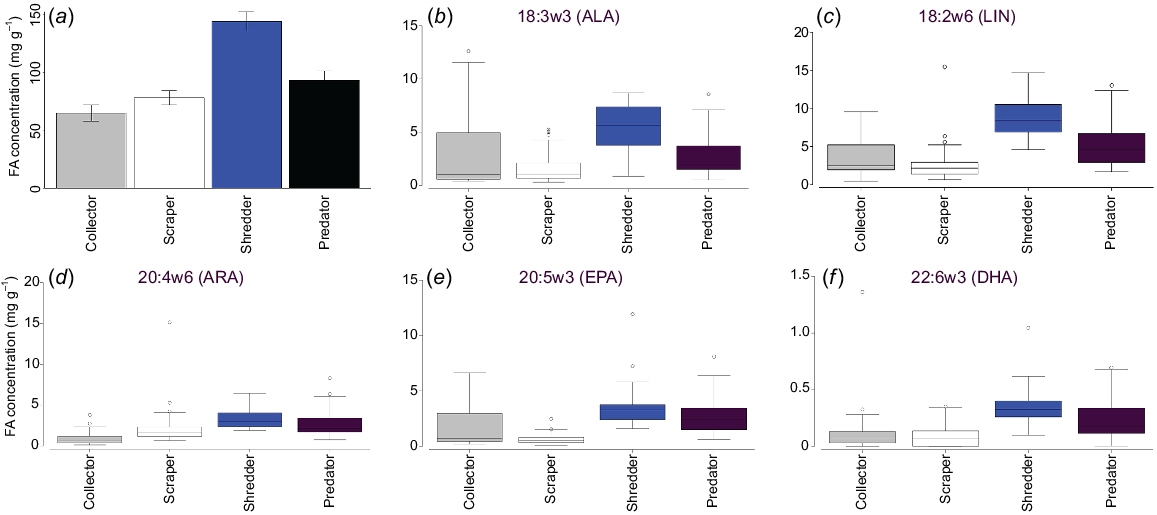
Higher energy density in the drying stage was strongly correlated with predator (r = 0.94981) and shredder (0.9204) occurrence on MDS1. Collectors (r = 0.64101) and scrapers (r = 0.57856) were more strongly correlated with MDS2, which drove the separation of full-stage sites from filling and drying stages (Fig. 7). Overall, the FA concentration was highest in shredders, then predators, collectors and scrapers, a pattern that was also observed for EPUFA (Fig. 8).
Discussion
Community structure
Our results support our Hypothesis 1, namely that community richness would increase with an increasing hydroperiod. Richness increased with hydroperiod as anticipated, through the progressive addition of taxa, in line with that predicted by drought-resistance strategies. The community in the filling stage comprised mostly Group 1 taxa, including ostracods, snails and copepods, which are all capable of surviving desiccation in situ, but are limited to passive dispersal (Wiggins et al. 1980). The ability of these taxa to emerge from these stages, sometimes as adults, make them a vital early successional resource for aquatic-dependent taxa coming into newly inundated wetland areas. A few adult hydrophilids (Group 2) were observed in this stage and were likely to be successful survivors of the previous dry period.
SIMPER analyses on biomass and individual density indicated that changes in the community in the full stage were driven largely by the appearance of chironomid larvae (Group 2). Although genera in the subfamily Chironominae, the dominant chironomid group seen in this study, are known to survive drying as larvae until reflooding occurs (Wiggins et al. 1980; Frouz et al. 2003; Cañedo-Argüelles et al. 2016), adults are also capable of aerial dispersal, and early instar larvae may be brought into wetland environments on incoming floodwaters (McInerney et al. 2017). In this study, chironomid larvae were absent in the filling stage, abundant in the full stage and greatly reduced in numbers in the drying stage. We consider it likely that this represents a successful dispersal into the wetland either by sexually mature adults or early instar larvae not detected in samples, and subsequent successful emergence of adults prior to drying.
Shredders were also an important driver of change in the full stage, on the basis of biomass estimates. In this study, shredders were almost exclusively represented by hydrophilid adults. Hydrophilid adults are Group 2 taxa (Wiggins et al. 1980), which may reside in damp areas between inundation events (Wiggins et al. 1980; Strachan et al. 2014), but require water for reproduction. Adults are long-lived and may also immigrate to newly wetted habitats from permanent waterbodies. Hydrophilid adults are considered moderately good dispersers (Phillips and Smith 2018).
Few adults and no larvae were observed in the filling stage in this study, both adults and larvae were seen in the full stage, and adults were abundant in the drying stage. This follows expected patterns for Australian hydrophilids, which are generally abundant as adults in spring and summer, with larvae being abundant in late spring–early summer, and declining rapidly thereafter (Hawking et al. 2013). The occurrence of adults in the early inundation stage supports the idea that adults may have persisted in refugial areas within the wetland complex and initiated a successful breeding cycle on rewetting. However, the immigration of adults from other habitats was not ruled out. Note that the majority of predators present in the filling stage were hydrophilid larvae.
The full stage was characterised by the arrival of Group 4 insect predators, including adult dytiscids, notonectids and corixids. Dependent on water for oviposition and largely lacking adaptations to survive drying, these taxa are characterised by long-lived adults with a high dispersal capacity (Phillips and Smith 2018), which tend to reside in permanent waterbodies, dispersing to resource-rich temporary waterbodies at the approach of sexual maturity (Wiggins et al. 1980). Adults will usually colonise temporary waterbodies, breed and complete maturation before leaving again for permanent water (Wiggins et al. 1980). Taxa represented here were predators of Microcrustacea, insect larvae and snails, all of which were abundant in the study wetland. Interestingly, Group 4 predators were the most diverse of the FFGs in this study, whereas other groups were dominated by one or two taxonomic groups.
Food-web structure
Our results also support Hypothesis 2, namely that food-web structure would increase in complexity with an increasing hydroperiod, before reducing in response to drying pressures. The food web in the filling stage was quite simple as expected, with the shortest food-chain length and only two FFGs present (collectors and shredders). δ13C range was quite broad, being the second-highest of the three stages sampled. A broad δ13C range indicates a diversity of basal resources supporting primary consumers and, in this case, may indicate feeding specialisation by the two consumer groups present in an environment where competition for basal resources was low. This is supported by the large distance to centroid and mean nearest-neighbour distance metrics, which suggest high trophic diversity and low trophic redundancy respectively.
In the full stage, the overall niche space occupied increased, along with δ15N range, δ13C range, food-chain length and predator:consumer biomass ratio. Overall trophic diversity decreased in this stage, as indicated by a decrease in distance to centroid, and increased trophic redundancy. Expansion of the food web in this stage appeared to be a result of increased diversity in the lower levels of the food web with the appearance of collectors (predominantly chironomids – Group 2). Although some predators appeared in this stage (hydrophilid larvae), their inclusion in the food web did not greatly increase the height of the food web. Instead, food-chain length and δ15N range appeared more related to a downward expansion from collector and shredder species. This pattern concurs with that observed by Dalu et al. (2017) where changes in food-web structure in the middle period of inundation suggested that trophic complexity in this period was more a function of diversification at lower and intermediate levels than predator diversification, which came later.
The δ13C range expanded to its greatest extent in this stage, and showed a slight shift to more depleted values. The general shift towards overall more δ13C-depleted resources and expansion of δ13C range may indicate the incorporation of more phytoplankton resources over time. The transitional nature of temporary floodplain wetlands from a terrestrial to aquatic environment (Junk et al. 1989) means that consumers persisting in moist refuges during dry times, or those emerging very early in the inundation cycle, may be exposed to predominantly detrital resources from allochthonous sources before phytoplankton resources establish.
Phytoplankton resources generally have a lower δ13C profile (typically ~−25 to −35‰) than does allochthonous terrestrial plant detritus (−27‰ for C3 plants) (Jones and Grey 2011). In a separate study (L. Frost, unpubl. data), we found that there was a boom in phytoplankton productivity in the filling stage. Given that invertebrate samples were taken concurrently and incorporation of resource elements into consumer body tissue is not instantaneous, it is likely that the influence of that boom was best observed in invertebrates collected in the full stage.
In the drying stage, food-chain length and δ15N range increased dramatically in response to the addition of multiple insect predators into the food web. However, this expansion in FCL was matched by an equally sharp contraction in δ13C range, indicating a reduction in the diversity of resources incorporated into the food web. Although the overall trophic niche space occupied increased in response to the large vertical expansion on the δ15N axis, the system became top heavy, with the highest predator:consumer biomass ratio being recorded in this stage, and lowest trophic diversity (CD) and high trophic redundancy (MNND). This agrees with the conceptual model proposed by O’Neill and Thorp (2014) and the findings of Dalu et al. (2017) who also observed a narrowing and elongation of the food chain in the contraction phase.
This change was likely to be due to predation pressures from immigrant predators eliminating or severely depleting taxa in the intermediate food-web levels (Wasserman et al. 2018), and a resultant increase in cannibalism causing an increase in FCL (O’Neill and Thorp 2014; Dalu et al. 2017). We saw an almost complete extirpation of chironomid larvae from the full to drying stages of this study. As discussed above, the shift from many larvae in the full stage to few in the drying stage may indicate successful emergence. However, it is also possible that this reflects predation pressure (or likely a combination of both) because dipteran larvae are a preferred prey item for many predatory insects (Hawking et al. 2013; Gooderham and Tsyrlin 2019).
Energy density
Hypothesis 3 was only partially supported by our results. Energy density was highest in the drying stage and was related to large-bodied insect taxa, but was actually largely due to the influence of shredders. Shredders had the highest fatty acid concentration of all FFGs, including of nutritionally valuable EPUFA, whereas collectors had the lowest. In part, this may be confounded by the fact that the collector group comprised not only zooplankton, which were expected to have high energy density, but also included some insect taxa such as chironomid larvae. However, individual measures for samples of ostracods (data not shown) did not show concentrations even approaching that suggested in Arts (1999).
Interestingly, the shredders in this study consisted almost entirely of adult hydrophilids, which we think underwent a successful breeding cycle in the wetland from persistent adults present in the filling stage, through many larvae in the full stage and finally many adults in the drying stage. If this assumption is true, it highlights the importance of maintaining a hydroperiod of sufficient length for taxa to complete their life cycle to maximise energy production.
Little is known of adult hydrophilid diets (Fikacek 2019) and less so about the incorporation, conversion and biosynthesis of FAs into consumer tissue (Jardine et al. 2020) and it is not possible to know from the current study where they are obtaining EPUFA. Although these taxa are considered shredders, which commonly feed on terrestrial plant detritus, it is not unknown for them to feed on decaying animal material (Fikacek 2019). The high concentrations of ALA and LIN, which are common in terrestrial plants, suggests this as a source for the EPUFA observed in shredder FA profiles in this study. The longer carbon-chain EPUFA (ARA, EPA and DHA) do not occur in particularly high concentrations, which are similar to those in predators. This may be a result of endogenous production, or reflect consumption of detrital animal sources. Investigating diets and the sources of FAs, both endogenous and dietary, in aquatic insects is an area of future research.
Management implications
The influence of hydroperiod on aquatic insect community development, and subsequent effects on food-web structure and energy availability were a clear driver in this study. The length of time required for these communities to reach maturity will differ, and will be influenced by other factors such as the proximity of regional species pools for colonisation (Urban 2004; Gleason and Rooney 2018), seasonality of flows, which may influence phenology and physicochemical aspects of the waterbody etc. (Urban 2004). Batzer and Wissinger (1996) suggested a period of between 1 and 6 months for the invertebrate community to mature and stabilise in temporary pools, although changes may continue for a period of years. When considered in the context of providing resources for conservation or management of non-aquatic consumers such as waterbirds, it will likely be necessary to extend the hydroperiod far beyond the point at which the aquatic community matures.
O’Brien and McGinness (2019) estimated that single royal spoonbill and Australian white ibis chicks require 50 days to reach independence, and at that point in time each chick requires, on average, 1800 and 1884 kJ day−1 respectively. On the basis of estimates of inundation volume of different vegetation types, at peak inundation in late September 2018 (full stage), invertebrate energy production across our study wetland totalled 56 745 582.7 kJ, enough to support ~30 000 independent chicks for 1 day. Colonial-nesting species such as these may breed in the tens to hundreds of thousands and resource failure before completion of a breeding cycle can be catastrophic for populations in the short and long term (O’Brien and McGinness 2019).
This highlights the importance of improving our understanding of how hydroperiod influences food-web structure and energy production in temporary wetland environments. An avenue for future research would be to incorporate aspects of energy density and nutritional quality into measures of food-web response to management.
Conclusions
This study demonstrated that patterns of community succession and changes in aquatic food-web structure across a temporal gradient followed largely predictable patterns driven by adaptations to disturbance in the form of drying, and highlighted the importance of inundation duration. The relationship between community structure and energy production was less predictable, although the influence of inundation duration was still clearly strong. In a management context, these results support the use of environmental water to create or extend the duration of inundation events to promote maximal productivity, but also serve to caution against the delivery of flows where inundation cannot be maintained for a sufficient length to support community development beyond the initial stage. We acknowledge that although these results align with theory and other findings in the literature, this is a novel study that has been undertaken only in one place during one inundation event. We hope to see similar studies investigating these mechanisms of trophic response to environmental watering in wetland environments.
Finally, we note that it is a common approach in ecological management to use population metrics such as abundance as markers of functional success; however, this study has highlighted that although the numbers (density) tell us that Microcrustacea and freshwater snails are important in assemblage structure, other taxa not appearing until later stages of inundation are driving bulk energy availability in the wetland, and contribute most to changes in food-web structure. To effectively incorporate trophic dynamics into monitoring and adaptive management of environmental-flow programs, it is necessary to consider alternative metrics such as biomass and energy content in addition to standard metrics.
Data availability
Data used to generate the results in this paper are stored in the UNE research repository RUNE and are available on request from the corresponding author.
Declaration of funding
Lindsey Frost received an Australian Government Research Training Program Scholarship in support of this work undertaken as part of a PhD project. The authors received funding from the Commonwealth Environmental Water Holder’s Science program, Flow Monitoring, Evaluation and Research (Flow-MER), in support of this work.
Acknowledgements
The authors acknowledge the Kamilaroi people on whose traditional lands this study took place. Thanks go to Mr Samuel and Mr Zachary Lewis for assistance in the field.
References
Anderson MJ (2001) Permutation tests for univariate or multivariate analysis of variance and regression. Canadian Journal of Fisheries and Aquatic Sciences 58(3), 626-639.
| Crossref | Google Scholar |
Arnold SL, Schepers JS (2004) A simple roller-mill grinding procedure for plant and soil samples. Communications in Soil Science and Plant Analysis 35(3–4), 537-545.
| Crossref | Google Scholar |
Batzer DP, Wissinger SA (1996) Ecology of insect communities in nontidal wetlands. Annual Review of Entomology 41, 75-100.
| Crossref | Google Scholar | PubMed |
Bertoli M, Brichese G, Pastorino P, Prearo M, Vignes F, Basset A, Pizzul E (2018) Seasonal multi-annual trends in energy densities of the midges (genus Chironomus) in a mediterranean temporary wetland (Natural Regional Reserve of the Isonzo River Mouth, northeast Italy). Hydrobiologia 823(1), 153-167.
| Crossref | Google Scholar |
Bertoli M, Piazza G, Pastorino P, Prearo M, Cozzoli F, Vignes F, Basset A, Pizzul E (2021) Macrobenthic invertebrate energy densities and ecological status in freshwater watercourses (Friuli Venezia–Giulia, northeast Italy). Aquatic Ecology 55(2), 501-518.
| Crossref | Google Scholar |
Boix D, Sala J, Gascón S, Brucet S (2006) Predation in a temporary pond with special attention to the trophic role of Triops cancriformis (Crustacea: Branchiopoda: Notostraca). Hydrobiologia 571(1), 341-353.
| Crossref | Google Scholar |
Bunn SE, Arthington AH (2002) Basic principles and ecological consequences of altered flow regimes for aquatic biodiversity. Environmental Management 30(4), 492-507.
| Crossref | Google Scholar | PubMed |
Cañedo-Argüelles M, Bogan MT, Lytle DA, Prat N (2016) Are Chironomidae (Diptera) good indicators of water scarcity? Dryland streams as a case study. Ecological Indicators 71, 155-162.
| Crossref | Google Scholar |
Dalu T, Wasserman RJ, Froneman PW, Weyl OLF (2017) Trophic isotopic carbon variation increases with pond’s hydroperiod: evidence from an Austral ephemeral ecosystem. Scientific Reports 7(1), 7572.
| Crossref | Google Scholar | PubMed |
Davies PM, Naiman RJ, Warfe DM, Pettit NE, Arthington AH, Bunn SE (2014) Flow–ecology relationships: closing the loop on effective environmental flows. Marine and Freshwater Research 65(2), 133-141.
| Crossref | Google Scholar |
Department of Environment, Climate Change and Water NSW (2011) Gwydir wetlands adaptive environmental management plan: synthesis of information projects and actions. (NSW Government: Sydney, NSW, Australia) Available at https://www.environment.nsw.gov.au/-/media/OEH/Corporate-Site/Documents/Water/Water-for-the-environment/gwydir-wetlands-adaptive-environmental-management-plan-110027.pdf
Frouz J, Matěna J, Ali A (2003) Survival strategies of chironomids (Diptera: Chironomidae) living in temporary habitats: a review. European Journal of Entomology 100(4), 459-465.
| Crossref | Google Scholar |
Gleason JE, Rooney RC (2018) Pond permanence is a key determinant of aquatic macroinvertebrate community structure in wetlands. Freshwater Biology 63(3), 264-277.
| Crossref | Google Scholar |
Greig HS, McHugh PA, Thompson RM, Warburton HJ, McIntosh AR (2022) Habitat size influences community stability. Ecology 103(1), e03545.
| Crossref | Google Scholar | PubMed |
Hanson BJ, Cummins KW, Cargill AS, Lowry RR (1985) Lipid content, fatty acid composition, and the effect of diet on fats of aquatic insects. Comparative Biochemistry and Physiology – B. Comparative Biochemistry 80(2), 257-276.
| Crossref | Google Scholar |
Hawking JH, Smith LM, LeBusque K, Davey C (Eds) (2013) Identification and ecology of Australian freshwater invertebrates. Available at http://www.mdfrc.org.au/bugguide [Verified 15 December 2022]
Jackson AL, Inger R, Parnell AC, Bearhop S (2011) Comparing isotopic niche widths among and within communities: SIBER – Stable Isotope Bayesian Ellipses in R. Journal of Animal Ecology 80(3), 595-602.
| Crossref | Google Scholar | PubMed |
Jardine TD, Galloway AWE, Kainz MJ (2020) Unlocking the power of fatty acids as dietary tracers and metabolic signals in fishes and aquatic invertebrates. Philosophical Transactions of the Royal Society of London – B. Biological Sciences 375(1804), 20190639.
| Crossref | Google Scholar | PubMed |
Jones RI, Grey J (2011) Biogenic methane in freshwater food webs. Freshwater Biology 56(2), 213-229.
| Crossref | Google Scholar |
Junk WJ, Bayley PB, Sparks RE (1989) The flood pulse concept in river-floodplain systems. Canadian Special Publication of Fisheries and Aquatic Sciences 106(1), 110-127.
| Google Scholar |
Layman CA, Arrington DA, Montaña CG, Post DM (2007) Can stable isotope ratios provide for community-wide measures of trophic structure? Ecology 88(1), 42-48.
| Crossref | Google Scholar | PubMed |
Lee Y, Lim W (2017) Shoelace formula: connecting the area of a polygon and the vector cross product. The Mathematics Teacher 110(8), 631-636.
| Crossref | Google Scholar |
McHugh PA, Thompson RM, Greig HS, Warburton HJ, McIntosh AR (2015) Habitat size influences food web structure in drying streams. Ecography 38(7), 700-712.
| Crossref | Google Scholar |
McInerney PJ, Stoffels RJ, Shackleton ME, Davey CD (2017) Flooding drives a macroinvertebrate biomass boom in ephemeral floodplain wetlands. Freshwater Science 36(4), 726-738.
| Crossref | Google Scholar |
McIntosh AR, McHugh PA, Plank MJ, Jellyman PG, Warburton HJ, Greig HS (2018) Capacity to support predators scales with habitat size. Science Advances 4(7), eaap7523.
| Crossref | Google Scholar |
Mdidimba ND, Mlambo MC, Motitsoe SN (2021) Trophic interactions and food web structure of aquatic macroinvertebrate communities in afromontane wetlands: the influence of hydroperiod. Aquatic Sciences 83(2), 36.
| Crossref | Google Scholar |
Nielsen DL, Podnar K, Watts RJ, Wilson AL (2013) Empirical evidence linking increased hydrologic stability with decreased biotic diversity within wetlands. Hydrobiologia 708(1), 81-96.
| Crossref | Google Scholar |
O’Brien L, McGinness HM (2019) Ibis and spoonbill chick growth and energy requirements: implications for wetland and water management. Wetlands Ecology and Management 27(5-6), 725-742.
| Crossref | Google Scholar |
O’Neill BJ, Thorp JH (2014) Untangling food-web structure in an ephemeral ecosystem. Freshwater Biology 59(7), 1462-1473.
| Crossref | Google Scholar |
Parrish CC, Nichols PD, Pethybridge H, Young JW (2015) Direct determination of fatty acids in fish tissues: quantifying top predator trophic connections. Oecologia 177(1), 85-95.
| Crossref | Google Scholar | PubMed |
Peipoch M, Brauns M, Hauer FR, Weitere M, Valett HM (2015) Ecological simplification: human influences on riverscape complexity. BioScience 65(11), 1057-1065.
| Crossref | Google Scholar |
Poff NL, Allan JD, Bain MB, Karr JR, Prestegaard KL, Richter BD, Sparks RE, Stromberg JC (1997) The natural flow regime. BioScience 47(11), 769-784.
| Crossref | Google Scholar |
Post DM (2002) Using stable isotopes to estimate trophic position: models, methods, and assumptions. Ecology 83(3), 703-718.
| Crossref | Google Scholar |
Post DM, Pace ML, Hairston NG, Jr (2000) Ecosystem size determines food-chain length in lakes. Nature 405(6790), 1047-1049.
| Crossref | Google Scholar | PubMed |
Post DM, Layman CA, Arrington DA, Takimoto G, Quattrochi J, Montaña CG (2007) Getting to the fat of the matter: models, methods and assumptions for dealing with lipids in stable isotope analyses. Oecologia 152(1), 179-189.
| Crossref | Google Scholar | PubMed |
Robson BJ, Chester ET, Mitchell BD, Matthews TG (2013) Disturbance and the role of refuges in mediterranean climate streams. Hydrobiologia 719(1), 77-91.
| Crossref | Google Scholar |
Robson BJ, Lester RE, Baldwin DS, Bond NR, Drouart R, Rolls RJ, Ryder DS, Thompson RM (2017) Modelling food-web mediated effects of hydrological variability and environmental flows. Water Research 124, 108-128.
| Crossref | Google Scholar | PubMed |
Rolls RJ, Baldwin DS, Bond NR, Lester RE, Robson BJ, Ryder DS, Thompson RM, Watson GA (2017) A framework for evaluating food-web responses to hydrological manipulations in riverine systems. Journal of Environmental Management 203(Part 1), 136-150.
| Crossref | Google Scholar | PubMed |
Salonen K, Sarvala J, Hakala I, Viljanen M-L (1976) The relation of energy and organic carbon in aquatic invertebrates. Limnology and Oceanography 21(5), 724-730.
| Crossref | Google Scholar |
Schneider DW, Frost TM (1996) Habitat duration and community structure in temporary ponds. Journal of the North American Benthological Society 15(1), 64-86.
| Crossref | Google Scholar |
Schriever TA, Williams DD (2013) Influence of pond hydroperiod, size, and community richness on food-chain length. Freshwater Science 32(3), 964-975.
| Crossref | Google Scholar |
Sheldon F, Boulton AJ, Puckridge JT (2002) Conservation value of variable connectivity: aquatic invertebrate assemblages of channel and floodplain habitats of a central Australian arid-zone river, Cooper Creek. Biological Conservation 103(1), 13-31.
| Crossref | Google Scholar |
Smith JL, Um MH (1990) Rapid procedures for preparing soil and KCL extracts for 15N analysis. Communications in Soil Science and Plant Analysis 21(17-18), 2173-2179.
| Crossref | Google Scholar |
Strachan SR, Chester ET, Robson BJ (2014) Microrefuges from drying for invertebrates in a seasonal wetland. Freshwater Biology 59(12), 2528-2538.
| Crossref | Google Scholar |
Thompson RM, Brose U, Dunne JA, Hall RO, Jr, Hladyz S, Kitching RL, Martinez ND, Rantala H, Romanuk TN, Stouffer DB, Tylianakis JM (2012) Food webs: reconciling the structure and function of biodiversity. Trends in Ecology & Evolution 27(12), 689-697.
| Crossref | Google Scholar | PubMed |
Tickner D, Opperman JJ, Abell R, Acreman M, Arthington AH, Bunn SE, Cooke SJ, Dalton J, Darwall W, Edwards G, Harrison I, Hughes K, Jones T, Leclère D, Lynch AJ, Leonard P, McClain ME, Muruven D, Olden JD, Ormerod SJ, Robinson J, Tharme RE, Thieme M, Tockner K, Wright M, Young L (2020) Bending the curve of global freshwater biodiversity loss: an emergency recovery plan. BioScience 70(4), 330-342.
| Crossref | Google Scholar | PubMed |
Urban MC (2004) Disturbance heterogeneity determines freshwater metacommunity structure. Ecology 85(11), 2971-2978.
| Crossref | Google Scholar |
Verardo DJ, Froelich PN, McIntyre A (1990) Determination of organic carbon and nitrogen in marine sediments using the Carlo Erba NA-1500 analyzer. Deep-Sea Research – A. Oceanographic Research Papers 37(1), 157-165.
| Crossref | Google Scholar |
Wasserman RJ, Weston M, Weyl OLF, Froneman PW, Welch RJ, Vink TJF, Dalu T (2018) Sacrificial males: the potential role of copulation and predation in contributing to copepod sex-skewed ratios. Oikos 127(7), 970-980.
| Crossref | Google Scholar |
Yang W, Sun T, Yang Z (2016) Does the implementation of environmental flows improve wetland ecosystem services and biodiversity? A literature review. Restoration Ecology 24, 731-742.
| Crossref | Google Scholar |