

Variations in life-history traits in exploited and unexploited populations of Perth herring (Nematalosa vlaminghi): evidence for density-dependent growth?
Kimberley A. Smith A * , Sybrand Alexander Hesp A and Peter G. Coulson A B
A
B
Abstract
Fishing can reduce population biomass, allowing remaining individuals to grow faster and mature earlier because of greater resource availability, which potentially compensates for lost reproductive output over a shortened lifespan resulting from fishing mortality.
To compare life-history traits of Nematalosa vlaminghi, a long-lived (20 years), semi-anadromous fish endemic to south-western Australia, in exploited and unexploited populations living in similar environments.
Populations were sampled in 2016–2018. Total mortality (Z) was estimated using catch-curve analyses, allowing for annual recruitment variability. Maturation age and length was estimated by logistic regression analysis. Growth curves were fitted to length-at-age data.
Compared to the unexploited population, Z was 2.6 times greater, juvenile growth was more than twice as fast, and maturity was attained at least 3 years earlier in the unexploited population.
Results supported the hypothesis of faster growth in exploited populations because of density-dependent processes. Environmental factors may also have contributed to trait differences between populations.
Faster growth and earlier maturation may partly compensate for lost reproductive output in exploited populations, although severe age truncation owing to fishing is still likely to decrease population resilience in this species, irrespective of any compensatory density-dependent processes.
Keywords: ecology, estuarine, fish, fisheries, growth, life history, mortality, population dynamics.
Introduction
Fish can exhibit a high level of phenotypic growth plasticity in response to changes in environmental conditions, such as temperature and food availability (Lorenzen and Enberg 2002; Enberg et al. 2012; Lorenzen 2016). This plasticity allows individuals to quickly adjust their life-history tactics to mitigate against the effects of environmental change, and thus enables populations to persist under variable conditions (Stearns and Koella 1986; Roff 1992; Stearns 1992; Rochet 2000). Growth plasticity also facilitates density-dependent processes that act to stabilise populations (Post et al. 1999; Rose et al. 2001). In exploited populations, the removal of adults by fishing may increase the per capita availability of resources, allowing juveniles to grow faster and mature earlier, potentially compensating for a reduced reproductive lifespan resulting from fishing mortality (Healey 1980; Rochet 1998; Engelhard and Heino 2004; Lester et al. 2014). High growth plasticity may thus contribute to the resilience of populations that experience highly variable environmental conditions, and also help buffer them against effects of fishing.
Nematalosa vlaminghi (Munro 1956) is a long-lived (20 years), semi-anadromous, iteroparous gizzard shad (Clupeidae: subfamily Dorosomatinae), endemic to the southern (temperate) western coast of Australia (latitudinal range 26–34°S) (Chubb and Potter 1986; Smith et al. 2022). It is one of only five Australian fish species that are fully or semi-anadromous (Chubb and Potter 1986; Miles et al. 2014; Schmidt et al. 2014). Adult N. vlaminghi migrate to the brackish, upper reaches of estuaries to spawn in summer then return to the sea in the cooler months, while juveniles remain in their natal estuary for several years prior to maturity (Chubb and Potter 1984, 1986; Neira et al. 1992; Smith 2006; Malanczak 2015), making this species particularly dependent on estuarine habitats.
N. vlaminghi is threatened by a range of anthropogenic impacts in south-western Australian estuaries, including habitat loss and degradation, barriers to migration, climate change and exploitation (Brearley 2005; Hallett et al. 2018). These modified, poorly-flushed microtidal estuaries are prone to eutrophication and hypoxia, problems that have been exacerbated by large declines in rainfall and river flow since 1970 due to climate change (Riggert 1978; Bradby 1997; Brearley 2005; Hallett et al. 2018; Warwick et al. 2018). Many of these estuaries are closed to the ocean during low-flow periods, which have increased in duration and frequency as a result of climate change. Of the 14 estuaries in the range of N. vlaminghi, only four (the Swan–Canning, Peel–Harvey and Leschenault estuaries, and the smaller Murchison River estuary) are now permanently open to the sea. These four estuaries are likely to host the main breeding populations of N. vlaminghi and so play an important role in sustaining the small meta-population of this species.
Historically, pre-spawning migratory schools of N. vlaminghi were commercially exploited in the Swan–Canning, Peel–Harvey and Leschenault estuaries (Chubb et al. 1984; Lenanton 1984; Smith 2006). The Swan–Canning fishery for N. vlaminghi was the largest and accounted for the vast majority of historical landings. Catches varied with demand, including peaks during the 1960s and 1970s, when this species was targeted intensively to supply bait to the local western rock lobster (Panulirus cygnus) fishery (Lenanton 1984). Catches fell after 1990, partly owing to shrinking demand for N. vlaminghi as bait. Only minor catches were taken in the Swan–Canning Estuary after 1997 and none was taken after 2007. A small fishery for N. vlaminghi still operates in the Peel–Harvey Estuary. The Leschenault Estuary was permanently closed to commercial fishing in 2001.
The biology of N. vlaminghi has been studied in the Swan–Canning Estuary (SCE) under exploited (historical) and lightly exploited or unexploited (recent) conditions, and changes over time suggest considerable phenotypic growth plasticity in this species (Smith et al. 2022). In the late 1970s, at the peak of fishing, juveniles in this estuary attained maturity within 3 years, but more recently have been observed to grow more slowly and take approximately twice as long to mature at a similar length (Chubb and Potter 1986; Smith et al. 2022). The reason(s) for the slowing of growth in the SCE is unclear. Because juvenile and adult N. vlaminghi co-occur in the upper estuary during the warmer months, it is plausible that the cessation of fishing resulted in higher densities of adults, leading to more competition for resources and potentially slower growth of juveniles. However, various environmental changes in this estuary over the same period could also have negatively affected N. vlaminghi growth (Smith et al. 2022). Thus, a comparison with growth in the nearby Peel–Harvey Estuary (PHE), which has similar physical characteristics and history of environmental degradation, but where fishing still occurs, may provide an insight into the relative effect of fishing mortality on N. vlaminghi growth.
The biology and demography of N. vlaminghi in the PHE is yet to be described. The aim of this study was to describe the growth, maturation, age composition and mortality of N. vlaminghi in the PHE and compare these biological traits with those in the nearby SCE population, which has been unexploited since 2007. We hypothesised that, in comparison to the SCE population, the PHE population (1) experienced greater total mortality associated with ongoing commercial fishing, (2) had faster somatic growth associated with density-dependent processes triggered by the harvesting of adult fish, and (3) had a younger age-at-maturity associated with the faster growth.
Materials and methods
Description of estuaries
The Swan–Canning Estuary (SCE) (32.0°S, 115.8°E) has a catchment of ~126 000 km2. The estuary surface area is ~55 km2 (Brearley 2005), including a narrow entrance channel, a series of basins and the tidal parts of the Swan and Canning rivers (these riverine sections are collectively referred to as the ‘upper estuary’) (Fig. 1). The upper estuary is shallow (<3 m in both rivers). The Swan River contributes the majority (85%) of flow into the estuary. Under low-flow conditions, saline waters can extend 60 km upstream from the sea in the Swan River (Spencer 1956), but only ~25 km upstream in the Canning River, where a weir (built in 1926) is closed in low-flow months (typically October–May) to prevent intrusion of saline water.
Location of the Swan–Canning Estuary (SCE) and Peel–Harvey Estuary (PHE) on the south-western coast of Australia. Insets: estuary entrances, basins and main tributaries of SCE and PHE. Tidal reaches of the tributaries collectively comprise the ‘upper estuary’.
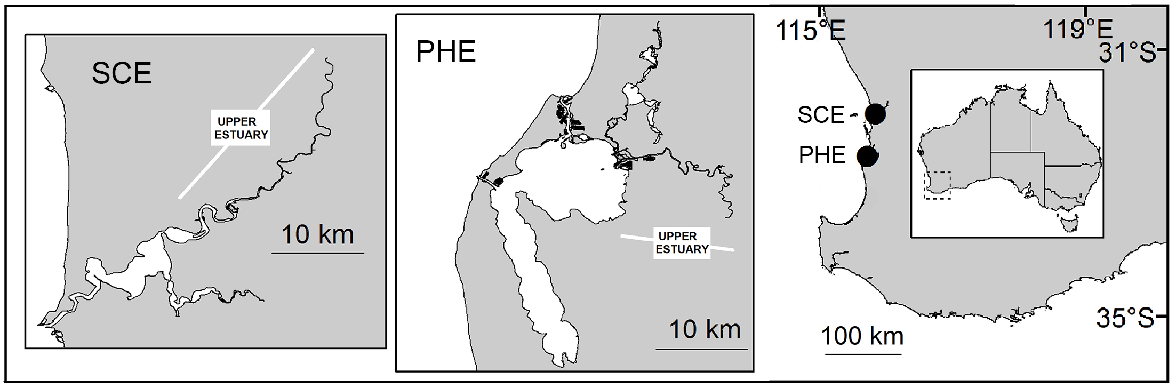
The Peel–Harvey Estuary (PHE) (32.6°S, 115.7°E) is ~50 km south of the SCE. The middle part of the PHE consists of two connected basins (‘Peel Inlet’ and ‘Harvey Estuary’), with a combined surface area of ~135 km2 (Fig. 1). The basins are connected to the sea at the northern end via a natural channel and, on the western side via an artificial entrance (the Dawesville Channel) built in 1994 to increase flushing and improve water quality in the basins. Three shallow (<5 m) rivers, the Serpentine, Murray and Harvey rivers (collectively the ‘upper estuary’), contribute ~95% of total flow into the estuary (Ruibal-Conti et al. 2013). On the Murray River, a permanent weir located ~35 km upstream from the ocean prevents saline-water intrusion in summer. Salinity in the upper estuary ranges from almost fresh to hypersaline during low-flow periods.
The region has a Mediterranean-type climate, with over 85% of the rainfall occurring in the cooler months (May–October). As rainfall and river flow decline, a salt wedge extends into the upper estuaries in spring and typically remains upstream until late autumn, or until winter in dry years. Under the stratified conditions of the salt wedge, the saline (bottom) layer often becomes deoxygenated (Kurup and Hamilton 2002).
The SCE and PHE catchments have been extensively cleared for agricultural, urban and industrial purposes (Riggert 1978; Bradby 1997; Brearley 2005). The upper reaches of both estuaries are now eutrophic or hypereutrophic because of runoff of anthropogenic nutrients from the naturally oligotrophic, sandy soils of the catchment (Bradby 1997; Chan et al. 2002; Brearley 2005; Cloern et al. 2014; Thomson 2019). These microtidal estuaries experience limited flushing and thus tend to accumulate pollutants and nutrients, especially during low-flow periods (Warwick et al. 2018). Superimposed on these processes are the effects of a drying climate, which has resulted in streamflow reductions of ~80% since the mid-1970s (Silberstein et al. 2012; Ruibal-Conti et al. 2013; Smith and Power 2014; see https://www.watercorporation.com.au/Our-water/Rainfall-and-dams/Streamflow). Reduced flow has allowed greater upstream penetration of the salt wedge, more extensive stratification, and increased hypoxia (DO < 2 mg L−1) and anoxia (0 mg L−1) in the upper estuaries (Cottingham et al. 2014, 2018). Reduced flushing and sediment nutrient releases under low-flow conditions have contributed to the increasingly eutrophic state of the upper estuaries (Douglas et al. 1997; Twomey and John 2001; Kurup and Hamilton 2002; Hamilton et al. 2006). In the PHE, construction of the artificial entrance increased saltwater intrusion, resulting in further upstream penetration of the salt wedge and stratification in the rivers.
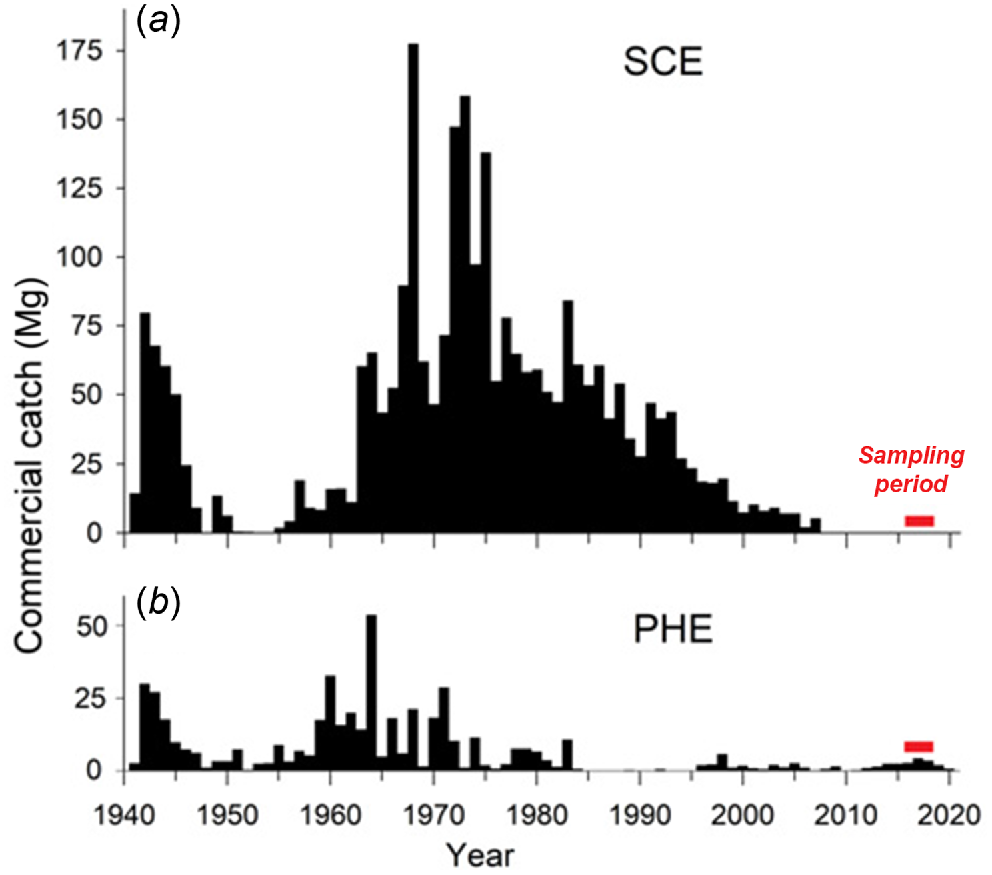
In the PHE, dense macroalgal blooms occurred in the estuary basins in the 1960s and 1970s, which were partly replaced by extensive cyanobacterial blooms in the warmer months in the 1980s and early 1990s (Lukatelich and McComb 1989; McComb and Lukatelich 1995). These blooms caused hypoxia and fish kills, and clogged fishing nets (Potter et al. 1983; Lenanton et al. 1985). Under these conditions, commercial fishing for N. vlaminghi effectively ceased in 1984 and did not resume until 1996 after the artificial entrance was opened (Fig. 2b).
Annual commercial catches of Nematalosa vlaminghi in the (a) Swan–Canning Estuary (SCE) and (b) Peel–Harvey Estuary (PHE), 1941–2020.
The upper parts of the SCE and PHE are characterised by high phytoplankton densities (Thompson and Hosja 1996; Thomson 2019). Since the 1990s, the upper estuaries have experienced an increasing frequency of blooms by potentially harmful phytoplankton species, including toxic dinoflagellates that, in concert with hypoxia, contribute to regular fish kills in summer–autumn (Twomey and John 2001; Chan et al. 2002; Adolf et al. 2015; Hallett et al. 2016; Thomson 2019). Significant fish kills occurred in 2003–2006, 2010 and 2012 in the SCE, and in 2003–2005 and 2017 in the PHE, with minor fish kills in most other years (Cosgrove et al. 2014; Thomson 2019).
Fish collection and measurement
Fish were sampled by fishery-independent methods during 2016–2018 in the SCE and 2017–2018 in the PHE. In addition, fish were sampled during 2016–2017 from commercial fishery landings in the PHE. Full details of fishery-independent sampling methods and locations are described by Valesini et al. (2017) and Hallett et al. (2019). Briefly, fish were collected at night in deep (>2 m) waters by a multi-panel gill net comprising 20 m long × 2 m high panels, each with a different mesh size (38, 51, 63, 76, 89, 102, 115 or 127 mm). In addition, small juveniles (Age 0+ years) were sampled in the day in shallow (<1.5 m) waters by a beach seine net with two 25-mm mesh wings (length 20 m) and a 9-mm mesh bunt. Together, these methods captured the full size range of N. vlaminghi (Smith et al. 2022). Commercial fishery catches were taken in deep waters by a haul net with a mesh size of 52 mm.
In the SCE, ~90% of fish were caught in the Swan River or estuary basin, with the remainder being caught in the Canning River. In the PHE, ~95% of fish were caught in the Murray River or estuary basin, with the remainder being caught in the Serpentine River.
Fish were frozen after capture. The effect of freezing on length was not investigated in this study. Shrinkage of 1–2% after freezing has been reported in other clupeids (e.g. Wessels et al. 2010). After defrosting, the total length (TL) and fork length (FL) of each fish were recorded to the nearest 1 mm. All lengths reported in the Results are TL. Any missing values of TL for individual fish were estimated using its relationship with FL determined from the other fish sampled in this study, as follows:
where r2 = 0.98, n = 144, P < 0.001.
Sagittal otoliths were extracted, dried and stored in paper envelopes. Fish were aged by counting validated annual growth increments in thin sections of their sagittal otoliths and assuming an average birth date of 1 January for all fish (Smith et al. 2022).
Gonads were extracted and assigned to one of the following eight macroscopic developmental stages adapted from Laevastu (1965): I, immature; II, resting; III, developing; IV, maturing; V, prespawning; VI, spawning; VII, spent; and VIII, recovering.
Fish were collected under permits W1006/03, R3000/17 and RW2706/14 issued by the Murdoch University Animal Ethics Committee and research exemptions 2671, 2783 and 3032 issued by the Department of Primary Industries and Regional Development.
Growth
Because the sex of most small fish (Age 0+) could not be determined macroscopically, their lengths-at-age were assigned randomly, but in equal proportions, to female and male datasets. The inclusion of these small fish was necessary to estimate reliably the growth of young juveniles in the populations. Growth was described by fitting Schnute growth curves (Schnute 1981) to length-at-age data for each sex and also to the combined data for both sexes. The Schnute growth model has been shown to provide statistically better fits to length-at-age data for N. vlaminghi than has the commonly used von Bertalanffy growth model (Smith et al. 2022). The Schnute growth equation is as follows:
where L1 and L2 are the estimated total lengths at selected reference ages τ1 and τ2 (i.e. 0 and 10 years respectively) and a and b are constants. Growth curves were fitted (using nlminb) in R (ver. 4.3.2, R Foundation for Statistical Computing, Vienna, Austria, see https://www.R-project.org/) by minimising the negative log-likelihood (λ) calculated as follows (Haddon 2011):
In this equation, n is the number of fish and is the standard deviation, calculated as follows:
where Lt, j and are the respective observed and expected lengths at age for the jth fish. Approximate 95% confidence limits for the estimated model parameters were calculated as 1.96 multiplied by their estimated standard error, derived from the variance–covariance matrix for estimated model parameters, calculated in R by using the optimHess function.
Within each estuary, a likelihood-ratio test (Cerrato 1990) was used to test for differences in growth between sexes and also between estuaries. The test statistic was calculated as twice the difference between the negative log-likelihoods calculated when fitting a common growth curve to the data for the two sexes (or estuaries) combined, compared with fitting separate growth curves to the data for each sex (or estuary). The hypothesis that growth could be appropriately described by a combined growth curve was rejected at the α = 0.05 level of significance if the test statistic exceeded , where q represents the degrees of freedom, determined as the difference between the numbers of parameters needed to fit separate curves v. a single curve (Cerrato 1990).
The average growth rate during the juvenile phase (Gjuv) was calculated in each estuary for each sex as follows:
where L50 is the total length (mm) and A50 is the age (years) at which 50% of fish attain maturity.
Maturation
Logistic regression analysis was used to estimate the lengths at which 50% (L50) and 95% (L95) of fish attained maturity. An individual was considered ‘mature’ if its gonads were at stages III–VIII during the reproductive period (October–March; Chubb and Potter 1984). The probability (P) that a fish was mature was calculated as:
Using nlminb in R (R Foundation for Statistical Computing), logistic curves were fitted employing non-linear optimisation to minimise the negative log-likelihood (λ) calculated as follows:
where the jth fish was represented by X = 0 if immature and X = 1 if mature (e.g. French et al. 2014). Approximate 95% confidence limits were calculated for estimated parameters from their estimated standard errors. This logistic regression analysis was also used to estimate the ages at which 50% (A50) and 95% (A95) of fish attain maturity. For each maturity curve, a parametric resampling approach (assuming the estimated maturity parameters conform to a multivariate normal distribution) was used to produce 95% confidence limits for probabilities of maturity estimated for a range of specified lengths (and ages). This resampling analysis employed the MASS package (ver. 7.3-60.0.1, see https://CRAN.R-project.org/package=MASS; Venables and Ripley 2002) in R, together with the estimated variance–covariance matrix and maturity parameters to produce 500 estimates for probability of maturity at each length (or age), with the 95% confidence limits calculated as the 2.5 and 97.5 percentiles of these length values at each length (or age). Within each estuary, likelihood-ratio tests (Cerrato 1990), as described above for growth modelling, were used to test for a significant difference between sexes, and between estuaries, in the length (and then age) at which maturity was attained.
Mortality estimation
To estimate annual mortality, an age-structured model allowing for inter-annual variability in relative recruitment (Deriso et al. 1985; see also Smith et al. 2022) was fitted to age-composition data collected, each year, using gill nets in 2016–2018 in the SCE and in 2017–2018 in the PHE. The analysis assumed ‘knife-edge’ at Age 4 years, on the basis of selectivity analyses conducted by Smith et al. (2022), which showed N. vlaminghi becoming fully vulnerable to the gillnet sampling gear at ~180 mm. The selectivity Sa of fish of age a was thus set to 1 for all fish aged 4 or more years. As with many other forms of catch-curve analysis, fish were assumed to experience constant mortality.
Time was measured in ‘biological years’, defined as the 12-month period following the assumed annual birth date for N. vlaminghi of 1 January (and thus, for this species, with biological years equating to calendar years).
The expected number of fish of Year class y that are of Age a years at the beginning of the first year of sampling, t1, was as follows:
where Z is the instantaneous rate of total mortality, j is an index of age (where 0 ≤ j ≤ A), is the number of 0-year-old fish recruiting to the population in Year t1, is the average recruitment level across all years, and A is a plus group containing all fish of Age A years or older. For subsequent years:
Ry, the number of recruits of Age 0 years in Year class y, was calculated as:
where εy is the estimated ‘recruitment deviation’ for Year class y, with , where is the variance of the natural logarithms of the recruitment deviations. Recruitment deviation parameters were estimated for successive year classes for which there were substantive samples.
The expected catch of fish of Age a in Year t was calculated as follows:
and the expected proportion of fish of Age a in the catch in Year t as follows:
Using na,t to denote the number of fish of Age a in the sample in Year t, the observed proportion at Age a for that year was as follows:
The overall log-likelihood for the catch curve model is as follows:
where λage, the log-likelihood of the age composition data, is as follows:
and λR, the log-likelihood associated with the recruitment deviations, is as follows:
This study followed several other assessments (e.g. Smith and Punt 1998; Maunder and Deriso 2003) that assume a prior probability distribution for the recruitment deviations, using the value 0.6 for the standard deviation of the natural logarithms of the recruitment deviations (Beddington and Cooke 1983; Mertz and Myers 1996). A penalty was also added to the objective function to prevent estimates of Z being confounded with trends in recruitment deviations (Fairclough et al. 2014).
Lifespan and reproductive lifespan
Typical lifespan (tmax) was the estimated age at which only 1% of individuals remain alive, assuming that total mortality (Z) is 0.32 year−1 in the SCE and 0.84 year−1 in the PHE (see Results). The reproductive lifespan (RL) was calculated as:
where A50 is the age at which 50% of individuals attain maturity.
Results
In total, 1112 fish (476 females, 315 males, 321 juveniles of indeterminate sex) were collected from the SCE, including 669 fish (237 females, 177 males, 255 juveniles) that were aged. In the PHE, 846 fish (424 females, 355 males, 67 juveniles) were collected in total, including 615 fish (318 females, 230 males, 67 juveniles) that were aged.
In the SCE, the maximum observed lengths and ages were 291 mm and 16.8 years for females, and 265 mm and 13.8 years for males. The corresponding values for the PHE were lower, with 262 mm and 8.3 years for females, and 260 mm and 12.1 years for males.
In each estuary, separate growth curves fitted to length-at-age data for females and males provided a significantly (P < 0.001) better fit than did a single curve fitted to the combined data from both sexes (Table 1). Similarly, for each sex, separate growth curves for each estuary provided a significantly (P < 0.001) better fit to the data than did a single curve fitted to the combined data from both estuaries.
| Estuary | Sex | Parameter | Estimate | Lower 95% CL | Upper 95% CL | n | |
|---|---|---|---|---|---|---|---|
| SCE | Female | L1 (0 years) | 0.0 | – | – | 366 | |
| L2 (10 years) | 235.9 | 233.9 | 237.9 | ||||
| a | 0.06 | 0.03 | 0.10 | ||||
| b | 3.50 | 3.19 | 3.85 | ||||
| Male | L1 (0 years) | 0.0 | – | – | 303 | ||
| L2 (10 years) | 218.0 | 215.3 | 220.6 | ||||
| a | 0.15 | 0.10 | 0.23 | ||||
| b | 3.4 | 2.99 | 3.86 | ||||
| PHE | Female | L1 (0 years) | 0.0 | – | – | 353 | |
| L2 (10 years) | 237.1 | 233.3 | 241.1 | ||||
| a | 0.6 | 0.49 | 0.75 | ||||
| b | 1.74 | 1.45 | 2.09 | ||||
| Male | L1 (0 years) | 0.0 | – | – | 262 | ||
| L2 (10 years) | 231.5 | 226.7 | 236.3 | ||||
| a | 0.62 | 0.46 | 0.84 | ||||
| b | 1.85 | 1.44 | 2.38 |
n, sample size.
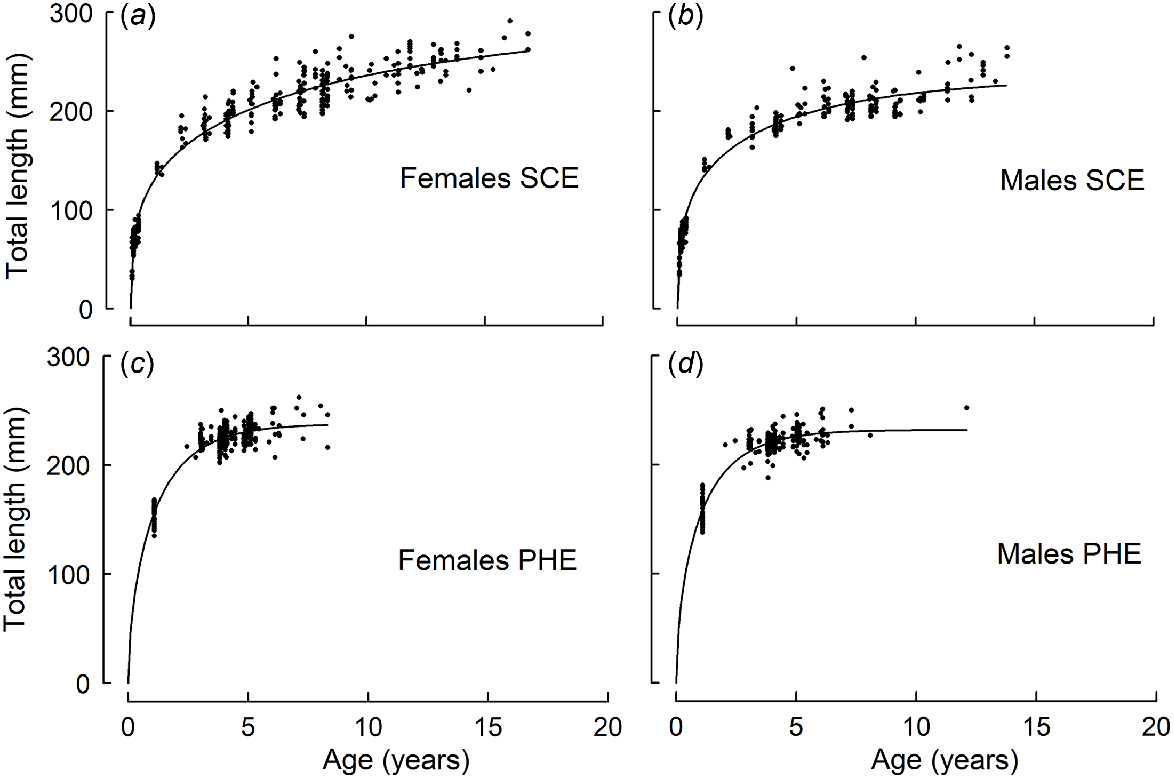
In the SCE, older females typically attained greater lengths at age than did males (Table 1, Fig. 3). For example, in the SCE, females at Ages 8 and 12 years were estimated from the corresponding growth curve to be 225 and 245 mm respectively, compared with 211 and 223 mm for males. In the PHE, females at Ages 4 and 8 years were slightly larger (225 and 237 mm respectively) than were males (221 and 231 mm respectively).
Schnute growth curves fitted to the length-at-age data for (a, c) female and (b, d) male Nematalosa vlaminghi collected from (a, b) the Swan–Canning Estuary (SCE) and (c, d) the Peel–Harvey Estuary (PHE) during 2016–2018.
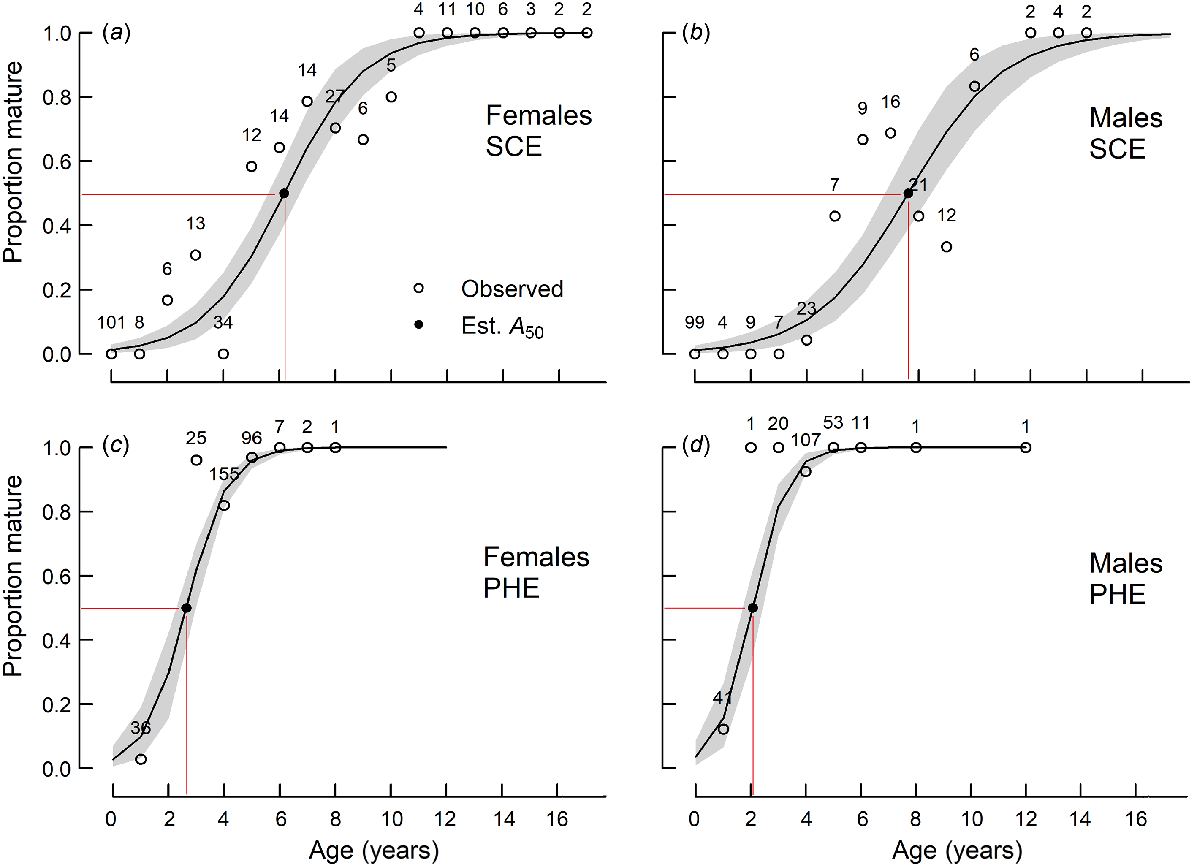
The smallest mature female and male in the SCE were 131 and 147 mm respectively, whereas the youngest mature female and male were 2+ and 4+ years old respectively. In the PHE, the smallest mature female and male were 151 and 174 mm respectively, and the youngest mature female and male were both 1+ years old.
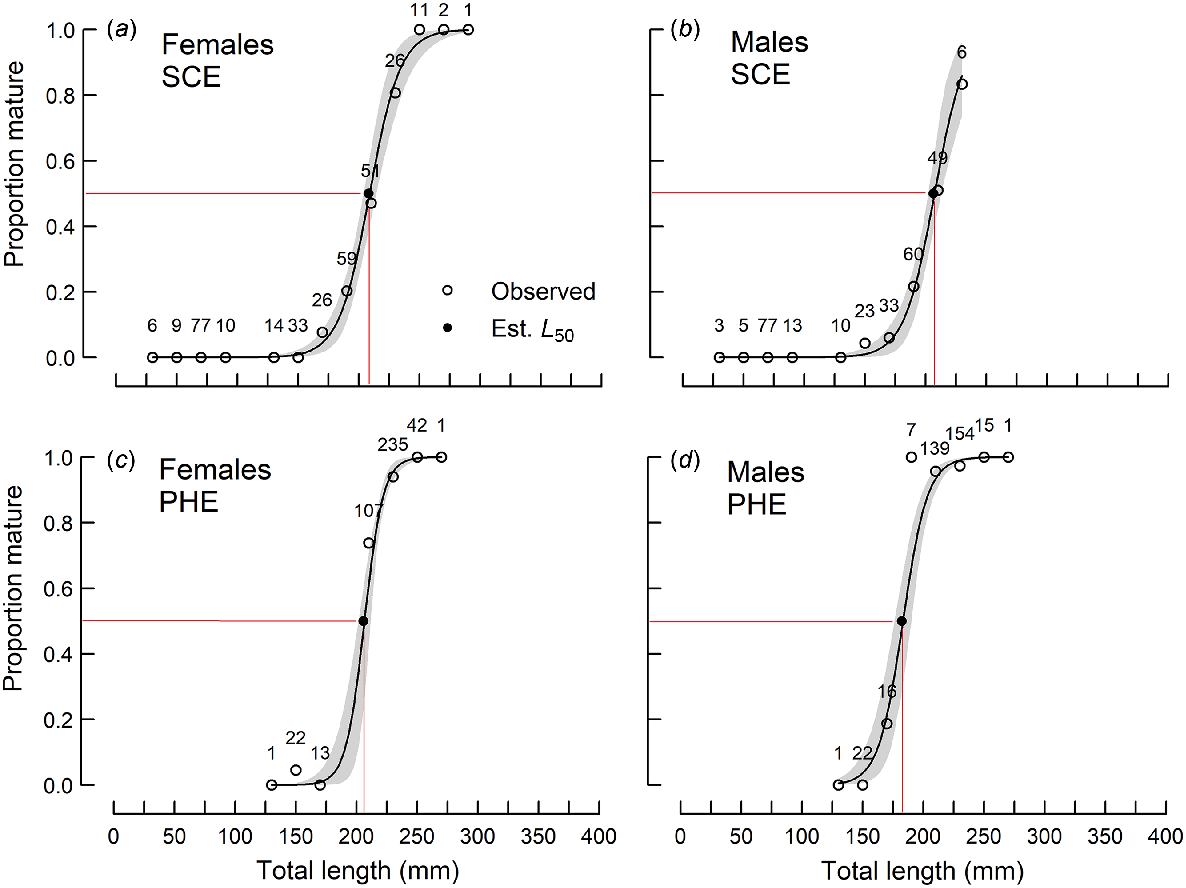
The mean lengths at maturity (L50) of females in the SCE and PHE and males in the SCE ranged from 205 to 208 mm and were not significantly (P > 0.05) different from each other (Table 2, Fig. 4). The L50 for males in the PHE (182 mm) was significantly smaller than the others.
| Estuary | Sex | Parameter | Estimate | Lower 95%CL | Upper 95%CL | n | |
|---|---|---|---|---|---|---|---|
| SCE | Female | L50 | 208 | 203 | 213 | 325 | |
| L95 | 245 | 232 | 258 | ||||
| Male | L50 | 206 | 200 | 212 | 279 | ||
| L95 | 243 | 226 | 261 | ||||
| Both | L50 | 207 | 203 | 211 | 604 | ||
| L95 | 245 | 234 | 255 | ||||
| Female | A50 | 6.2 | 5.6 | 6.8 | 322 | ||
| A95 | 10.4 | 9.1 | 11.6 | ||||
| Male | A50 | 7.6 | 6.8 | 8.4 | 235 | ||
| A95 | 12.6 | 10.3 | 14.5 | ||||
| Both | A50 | 6.9 | 6.3 | 7.3 | 557 | ||
| A95 | 11.5 | 10.4 | 12.5 | ||||
| PHE | Female | L50 | 205 | 200 | 211 | 421 | |
| L95 | 228 | 224 | 232 | ||||
| Male | L50 | 182 | 175 | 189 | 355 | ||
| L95 | 212 | 206 | 218 | ||||
| Both | L50 | 191 | 186 | 196 | 776 | ||
| L95 | 225 | 221 | 229 | ||||
| Female | A50 | 2.6 | 2.3 | 3.0 | 322 | ||
| A95 | 4.8 | 4.4 | 5.2 | ||||
| Male | A50 | 2.1 | 1.7 | 2.4 | 235 | ||
| A95 | 3.9 | 3.5 | 4.4 | ||||
| Both | A50 | 2.38 | 2.12 | 2.64 | 557 | ||
| A95 | 4.45 | 4.24 | 4.83 |
n, sample size.
Proportions of sexually mature (a, c) female and (b, d) male Nematalosa vlaminghi in each 20-mm length class, sampled from (a, b) the Swan–Canning Estuary (SCE) and (c, d) the Peel–Harvey Estuary (PHE) during the spawning period (October–March). Logistic curves (solid lines; shading indicates 95% confidence limit) were derived from the probability that a fish at a given length is mature. Sample sizes are shown for each length class. Observed proportions (open circles) and estimated L50 values (closed circles) are shown.
For each sex, mean age at maturity (A50) was significantly (P < 0.001) higher in the SCE than in the PHE (Table 2, Fig. 5). A50 also differed significantly (P < 0.05) between sexes in each estuary, although the trends were not consistent between estuaries. Females matured earlier than males in the SCE (ages 6.2 v. 7.6 years) but later than males in the PHE (ages 2.6 v. 2.1 years) (Table 2).
Proportions of sexually mature (a, c) female and (b, d) male Nematalosa vlaminghi in each age class, sampled from (a, b) the Swan–Canning Estuary (SCE) and (c, d) the Peel–Harvey Estuary (PHE) during the spawning period (October–March). Logistic curves (solid lines; shading indicates 95% confidence limit) were derived from the probability that a fish at a given age is mature. Sample sizes are shown for each age class. Observed proportions (open circles) and estimated A50 values (closed circles) are shown.
In the first few years of life, growth (in terms of length) was more rapid for each sex in the PHE than in the SCE. For example, females in the PHE attained 180 mm after ~1.5 years, but females in the SCE required ~3.3 years to reach the same length. In the SCE, the average growth rate (Gjuv) during the juvenile phase was 33 mm year−1 for females and 26 mm year−1 for males. In the PHE, Gjuv was 79 mm year−1 for females and 87 mm year−1 for males.
In the SCE, 16 consecutive year classes, from 2002 to 2017, were represented in fishery-independent samples collected in 2016–2018 (Fig. 6). In the PHE, only eight year classes were represented in fishery-independent samples collected in 2017–2018, and only five year classes in commercial-fishery samples in 2016–2017 (Fig. 6).
The age composition (bars) of annual samples of Nematalosa vlaminghi collected by fishery-independent gill nets in the Swan–Canning Estuary (SCE) during 2016–2018 and Peel–Harvey Estuary (PHE) during 2017–2018. Ages of <2 years are not shown. Catch curves (lines) are fitted to Ages 4 years, and older, which were fully vulnerable to the sampling gear. Age composition of N. vlaminghi caught by commercial fishing in the PHE during 2016 and 2017 is also shown for comparison.
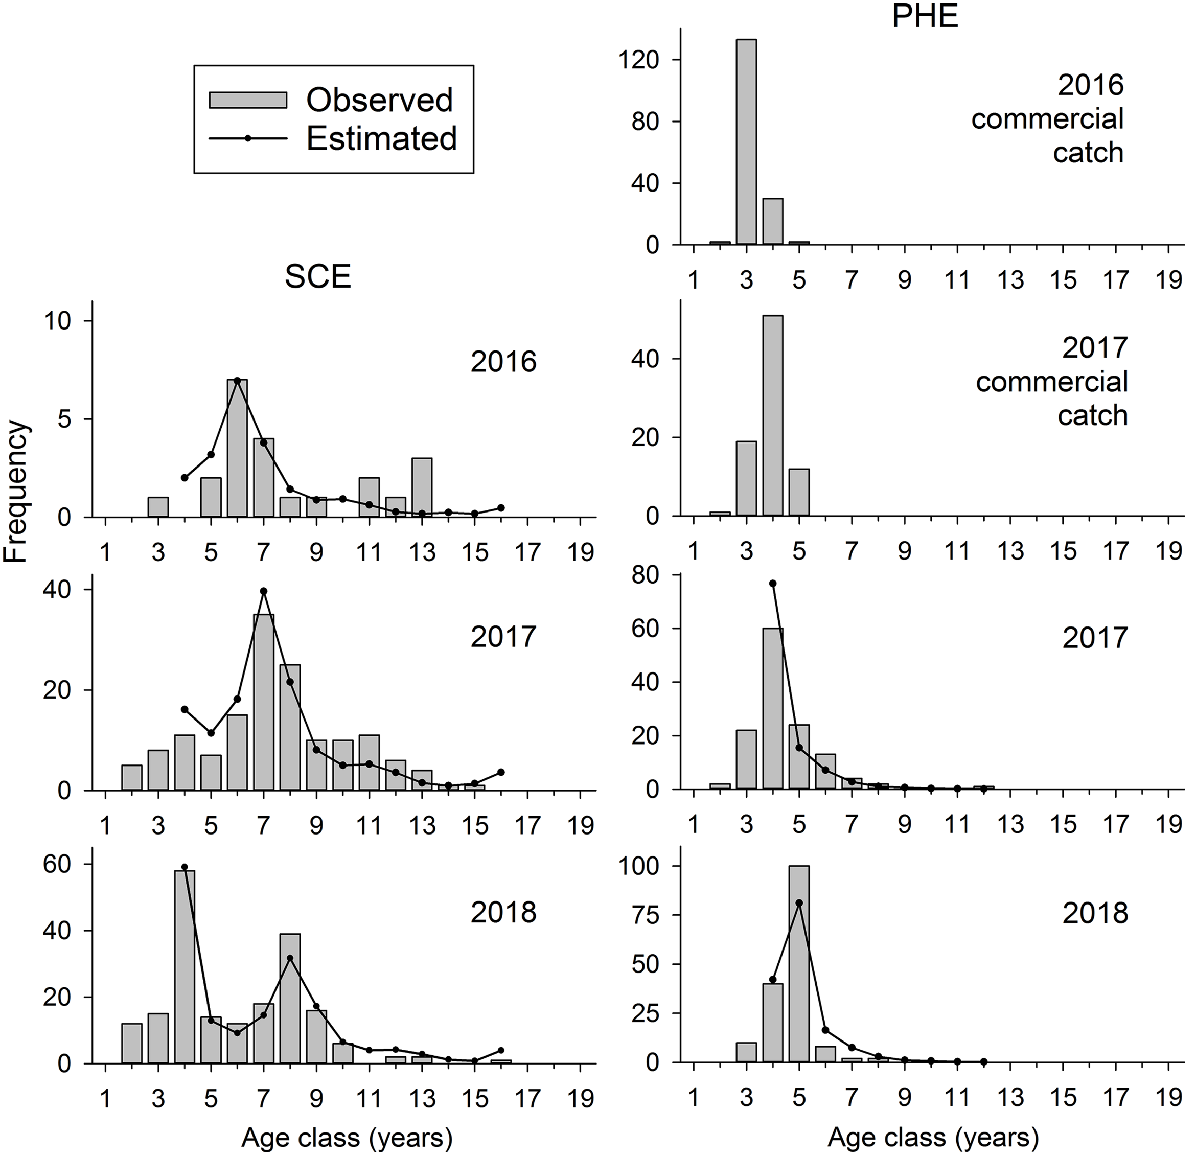
The age-composition data showed pronounced variations in year-class strength in both estuaries, but with different trends in each estuary. For example, the 2010 (Age 6 in 2016) and 2014 (Age 4 in 2018) year classes were relatively strong in the SCE, whereas 2013 (Age 5 in 2018) was the only relatively strong year class in the PHE (Fig. 6). The progression of each strong year class could be tracked between years.
The age composition in the PHE was highly truncated compared with that in the SCE. In the PHE, only 4% of fish collected by fishery-independent gill nets were older than 7 years, whereas 50% of all fish collected by this method in the SCE were older than this age.
On the basis of catch-curve analyses of age-composition data, the instantaneous rate of total mortality (Z) was estimated to be 0.32 year−1 (0.28–0.36, 95% CI) in the SCE and 0.84 year−1 (0.69–0.99) in the PHE. Annual survivorship (S), calculated as S = exp (−Z), was 73% in the SCE, compared with only 43% in the PHE.
Because of the substantially higher adult mortality in the PHE, the typical female lifespan (tmax) during 2016–2018 was estimated to be 7.1 years in the PHE, compared with 14.4 years in the SCE, including a reproductive lifespan (RL) of 4.5 years in the PHE, compared with 8.0 years in the SCE.
Discussion
Evidence for density-dependent somatic growth
The differences in life-history traits between populations of N. vlaminghi in this study were consistent with the hypothesis that commercial fishing has resulted in higher total mortality in the fished population than that in the unfished population, leading to faster somatic growth because of density-dependent processes triggered by the harvesting of adult fish, and a younger mean age at maturity associated with the faster growth. Thus, results showed that during 2016–2018, the total mortality (Z) of adult fish was ~2.6 times higher in the PHE than in the SCE (Z = 0.84 v. 0.32 year−1). At this time, the average juvenile growth rate (in terms of length) in the PHE was more than twice that in the SCE, which allowed females to attain maturity ~4 years earlier, but at a length similar to that of females in the SCE.
In the SCE, the mean age at maturity in 2016–2018 (6.2 years for females, 7.6 years for males) was substantially higher than that reported four decades earlier, when fishery catches of N. vlaminghi were at their peak in this estuary. In the late 1970s, most juveniles in the SCE were reported to mature at the age of 3 years, at an estimated total length of 176 mm (estimated from a growth curve for both sexes; Chubb and Potter 1984). Thus, the typical age at maturity was at least 3 years younger than that observed in 2016–2018. Whereas the historical mean length at maturity was smaller, the average juvenile growth rate (Gjuv) was faster than in 2016–2018 (59 v. 33 mm year−1). Adult growth was also greater in the late 1970s, as indicated by larger lengths at age (e.g. 293 v. 225 mm at age 8 years) and a substantially greater maximum observed length than in 2016–2018 (361 v. 291 mm; Chubb and Potter 1984; Smith et al. 2022).
Juvenile and adult N. vlaminghi co-occur in the upper parts of estuaries during the warmer months and so the removal of adults by fishing could potentially reduce competition for resources and result in faster growth of juveniles. Juvenile and adult gizzard shad are omnivorous filter-feeders that consume detritus, phytoplankton, benthic algae and zooplankton (Yako et al. 1996; Higgins et al. 2006; Pusey et al. 2021). Individuals that feed extensively on zooplankton have faster growth than do those that consume primarily detritus (Mundahl and Wissing 1987; Schaus et al. 2002). Detritus typically dominates the diet, but higher-quality food is preferentially consumed when available (Yako et al. 1996; Sternberg et al. 2008). At high densities, gizzard shad quickly deplete higher-quality zooplankton prey and shift to consuming abundant, but lower-quality, detritus. Hence, gizzard shad growth is dependent on food quality, which, in turn, can be influenced by its population density. Density-dependent regulation of growth has also been reported in Dorosoma cepedianum, a well-studied, anadromous gizzard shad in North America (DiCenzo et al. 1996; Kim and DeVries 2000; Schaus et al. 2002; Vanni et al. 2006).
An alternative hypothesis to explain the differences in life-history traits between N. vlaminghi populations is that environmental factors, such as temperature, salinity, productivity or dissolved oxygen, differed between estuaries and led to different rates of N. vlaminghi growth or mortality. However, there are no obvious large-scale environmental differences between the PHE and SCE that might explain the trait differences. These estuaries are closely located and thus share the same climate and have similar physical characteristics and histories of environmental degradation, including increasing hypoxia and eutrophication over the past four decades (see ‘Description of estuaries’ in Materials and methods). Previously, Smith et al. (2022) speculated that density-dependent processes associated with increases in primary production or the extent of hypoxia since the 1970s may have contributed to the slower growth of N. vlaminghi in the SCE. However, given the current observation of fast growth of N. vlaminghi in the PHE where there is currently high primary production and extensive hypoxia, this suggests that density-dependent processes associated with fishing, rather than changes in primary production or hypoxia, have had the greatest effect on the growth of this species in these two systems.
Environmental degradation may be contributing to total mortality of N. vlaminghi in each estuary. Over the past two decades, numerous ‘fish kills’ associated with low-oxygen events, often exacerbated by toxic dinoflagellate blooms, have occurred in summer–autumn in the upper parts of both estuaries (Smith 2006; Cosgrove et al. 2014; Thomson 2019). The largest recorded fish kills occurred in the SCE in 2003 (>200 000 fish) and in the PHE in 2017 (>30 000 fish) (Cosgrove et al. 2014; Thomson 2019). The majority of these recorded deaths are related to Acanthopagrus butcheri, a reasonably large-bodied demersal species that resides permanently in estuaries. However, major fish kill events are logistically difficult to survey because they cover large areas and last several days, and minor events are sometimes not recorded. Also, smaller fish decompose rapidly, and certain species tend to sink after death and are not observed. Thus, official records of fish kills in these estuaries probably underestimate the frequency of events, and the actual number of species and individuals affected. The limited available information for N. vlaminghi indicates that moderate numbers (>1000) of adults of this species have been killed in several low-oxygen events in each estuary (Smith et al. 2004; Smith 2006), but the extent to which N. vlaminghi total mortality has been altered by these events over the past two decades is unknown.
Environmental degradation, including declining freshwater flows and increasing extent of hypoxia, may also have reduced the carrying capacity for N. vlaminghi in each estuary. A reduced population size in the PHE would explain why recent fishery catches in this estuary, which are relatively small compared with those taken in the 1960s, are associated with high total mortality in this population.
Does faster growth really compensate for high mortality?
For N. vlaminghi, juvenile somatic growth (in terms of length) in the PHE population was 2.4 times faster for females and 3.3 times faster for males than that in the SCE population, which suggests high phenotypic growth plasticity in this species. Such plasticity is likely to be a useful adaptation for N. vlaminghi because it allows populations to quickly respond to the naturally variable conditions that occur in local estuaries. It also facilitates density-dependent processes that help buffer populations against the effects of high fishing mortality or environmental degradation. In recent years, the faster growth of juveniles in the PHE has allowed them to mature earlier and produce offspring more quickly than those in the SCE, potentially compensating for the reduced reproductive lifespan in the PHE.
Density-dependent recruitment may also be increasing productivity and compensating for high adult mortality in the PHE population (Rose et al. 2001). The larvae of gizzard shad are obligate zooplanktivores (Miranda and Gu 1998; Kanou et al. 2004; Medeiros and Arthington 2008; Uehara and Tachihara 2016), and lower adult densities may allow higher larval survival by reducing competition for zooplankton prey. Lower adult densities are also likely to reduce cannibalism of eggs and larvae. Density-dependent larval survival is reflected in the over-compensatory (Ricker-type) stock–recruitment relationship of the gizzard shad D. cepedianum (Miranda et al. 2020).
Density-dependent growth and recruitment can compensate for the effects of high mortality only if conditions are suitable for reproduction and recruitment. In the estuaries of south-western Australia, conditions for reproduction and recruitment can be unfavourable for extended periods because of environmental factors, including low flow and hypoxia (Smith et al. 2022). N. vlaminghi has a potential longevity of at least 20 years, which is one of the longest reported for any clupeid species (Smith et al. 2022). A long lifespan allows individuals to survive long enough to take advantage of favourable conditions when they occur (a ‘storage effect’) (Secor 2000). However, when lifespan is substantially reduced, the number of opportunities for successful reproduction decrease. As a result of the higher adult mortality in the PHE, the reproductive lifespan of females during 2016–2018 was estimated to be 44% lower in the PHE than in the SCE (4.5 v. 8.0 years). Thus, individual females in the PHE have almost half of the number of annual spawning opportunities that are available to females in the SCE throughout their life.
Age truncation may also be reducing the likelihood of reproductive success in the PHE population through various maternal effects. For example, age-related differences in spawning times and locations can increase the chance that offspring will encounter favourable conditions, and older females tend to produce a greater quantity and quality of eggs, which may also increase offspring survival (Wright and Trippel 2009; Hixon et al. 2014; Ohlberger et al. 2022; Yoneda et al. 2022). Furthermore, age truncation tends to destabilise fish populations, making them more variable and prone to collapse in the event of unfavourable conditions (Anderson et al. 2008; Hsieh et al. 2010; Rouyer et al. 2012; Hixon et al. 2014; Barnett et al. 2017; Ottersen and Holt 2023). Given these effects, it is likely that strong age truncation is decreasing the resilience of the PHE population to cope with exploitation and habitat degradation in the upper estuary, irrespective of any compensatory density-dependent responses that may be occurring as a consequence of high mortality.
Implications for the meta-population of N. vlaminghi
Consistent differences in the age composition and size at age of N. vlaminghi between the PHE and SCE across multiple years in this study indicate distinct patterns of recruitment, growth and mortality in each estuary, and imply low connectivity between populations despite their estuary entrances being located only ~50 km apart. These patterns suggest that most adults return to the same estuary to spawn (natal philopatry) and, therefore, the migratory behaviour of N. vlaminghi is similar to that of most other anadromous fish, which display a strong tendency to ‘home’ to their natal estuary (e.g. Grunwald et al. 2008; Jolly et al. 2012; Engstedt et al. 2014; Keefer and Caudill 2014; Palkovacs et al. 2014; Martin et al. 2015; Davies et al. 2020).
Most ‘homing’ anadromous fish species display some degree of straying, usually into nearby rivers (Keefer and Caudill 2014; Martin et al. 2015). Thus, the larger SCE population could still be an important source of recruitment to other estuaries, helping sustain small populations or replace extirpated populations. There are no estimates of N. vlaminghi absolute abundance in either estuary, but there is strong circumstantial evidence that the SCE has always had a greater carrying capacity for N. vlaminghi than has the PHE. Since 1940, commercial catches of N. vlaminghi have been consistently higher in the SCE than in the PHE, despite a larger fishing fleet and consistently higher effort levels in the PHE (and high market demand in both fisheries). During the peak periods of demand for this species, in the 1940s and the 1960s, the annual catch peaked at 80 and 178 tonnes (Mg) respectively, in the SCE but only 30 and 53 Mg respectively, in the PHE. During 1965–1995, N. vlaminghi comprised 40% by weight of total commercial landings (including all species of fish and invertebrates) in the SCE, but only 1% in the PHE (Smith and Lenanton 2021). Historical records also suggest that N. vlaminghi was relatively abundant in the SCE, compared with other estuaries. For example, the strong association of this species with the SCE, which flows through the city of Perth, gave rise to its common name of ‘Perth herring’ with this estuary historically being regarded by fishers as the ‘true home of Perth herring’ (Quain 1947).
Owing to the drying and warming climate in south-western Australia, the major breeding stocks of N. vlaminghi are likely to have been limited to just four estuaries that remain permanently open, including the SCE and PHE (Smith et al. 2022). With so few breeding stocks, the persistence of each one is important to the sustainability of the species. In anadromous species, the existence of a diverse ‘portfolio’ of spawning stocks is a strategy that spreads risk and buffers against local environmental fluctuations, promoting stability and resilience in the meta-population (Schindler et al. 2010; Waldman et al. 2016). Maximising resilience in each N. vlaminghi stock should therefore be a management priority. The current ‘low resilience’ status of N. vlaminghi in the PHE is of concern. Fishery and habitat management strategies that reduce mortality and preserve older age classes in this small population should be adopted to enhance its resilience.
Data availability
The data that support this study will be shared upon reasonable request to the corresponding author.
Acknowledgements
The authors thank Chris Dowling for assistance with laboratory and field work, Dr Chris Hallett and commercial fishers in the Peel–Harvey estuary for donation of samples, and Prof. Norm Hall for reviewing the manuscript.
References
Adolf JE, Bachvaroff TR, Deeds JR, Place AR (2015) Ichthyotoxic Karlodinium veneficum (Ballantine) J Larsen in the upper Swan River Estuary (Western Australia): ecological conditions leading to a fish kill. Harmful Algae 48, 83-93.
| Crossref | Google Scholar | PubMed |
Anderson CNK, Hsieh C-H, Sandin SA, Hewitt R, Hollowed A, Beddington J, May RM, Sugihara G (2008) Why fishing magnifies fluctuations in fish abundance. Nature 452, 835-839.
| Crossref | Google Scholar | PubMed |
Barnett LAK, Branch TA, Ranasinghe RA, Essington TE (2017) Old-growth fishes become scarce under fishing. Current Biology 27, 2843-2848.e2.
| Crossref | Google Scholar | PubMed |
Cerrato RM (1990) Interpretable statistical tests for growth comparisons using parameters in the von Bertalanffy equation. Canadian Journal of Fisheries and Aquatic Sciences 47, 1416-1426.
| Crossref | Google Scholar |
Chan TU, Hamilton DP, Robson BJ, Hodges BR, Dallimore C (2002) Impacts of hydrological changes on phytoplankton succession in the Swan River, Western Australia. Estuaries 25, 1406-1415.
| Crossref | Google Scholar |
Chubb CF, Potter IC (1984) The reproductive biology and estuarine movements of the gizzard shad, Nematalosa vlaminghi (Munro). Journal of Fish Biology 25, 527-543.
| Crossref | Google Scholar |
Chubb CF, Potter IC (1986) Age, growth and condition of the Perth herring, Nematolosa vlaminghi (Munro) (Dorosomatinae), in the Swan Estuary, south-western Australia. Marine and Freshwater Research 37, 105-112.
| Crossref | Google Scholar |
Cloern JE, Foster SQ, Kleckner AE (2014) Phytoplankton primary production in the world’s estuarine-coastal ecosystems. Biogeosciences 11, 2477-2501.
| Crossref | Google Scholar |
Cosgrove J, Hoeksema S, Place A (2014) Ichthyotoxic Karlodinium cf. veneficum in the Swan–Canning Estuarine system (Western Australia): towards management through understanding. In ‘Marine and Freshwater Harmful Algae. Proceedings of the 16th International Conference on Harmful Algae’, 27–31 October 2014, Wellington, New Zealand. (Ed. A Lincoln MacKenzie) pp. 258–261. (New Zealand and International Society for the Study of Harmful Algae, Cawthron Institute: Nelson, New Zealand)
Cottingham A, Hesp SA, Hall NG, Hipsey MR, Potter IC (2014) Marked deleterious changes in the condition, growth and maturity schedules of Acanthopagrus butcheri (Sparidae) in an estuary reflect environmental degradation. Estuarine, Coastal and Shelf Science 149, 109-119.
| Crossref | Google Scholar |
Cottingham A, Huang P, Hipsey MR, Hall NG, Ashworth E, Williams J, Potter IC (2018) Growth, condition, and maturity schedules of an estuarine fish species change in estuaries following increased hypoxia due to climate change. Ecology and Evolution 8, 7111-7130.
| Crossref | Google Scholar | PubMed |
Davies P, Britton RJ, Nunn AD, Dodd JR, Crundwell C, Velterop R, Ó’Maoiléidigh N, O’Neill R, Sheehan EV, Stamp T, Bolland JD (2020) Novel insights into the marine phase and river fidelity of anadromous twaite shad Alosa fallax in the UK and Ireland. Aquatic Conservation: Marine and Freshwater Ecosystems 30, 1291-1298.
| Crossref | Google Scholar |
Deriso RB, Quinn TJ, Neal PR (1985) Catch-age analysis with auxiliary information. Canadian Journal of Fisheries and Aquatic Sciences 42, 815-824.
| Crossref | Google Scholar |
DiCenzo VJ, Maceina MJ, Stimpert MR (1996) Relations between reservoir trophic state and gizzard shad population characteristics in Alabama reservoirs. North American Journal of Fisheries Management 16, 888-895.
| Crossref | Google Scholar |
Douglas GB, Hamilton DP, Gerritse RG, Adeney JA, Coad DN (1997) Sediment geochemistry, nutrient fluxes and water quality in the Swan River Estuary, WA. In ‘Managing algal blooms: outcomes from the CSIRO’s multi-divisional blue–green algal program’. (Ed. JR Davis) pp. 15–30. (CSIRO Land and Water: Canberra, ACT, Australia)
Enberg K, Jørgensen C, Dunlop ES, Varpe Ø, Boukal DS, Baulier L, Eliassen S, Heino M (2012) Fishing-induced evolution of growth: concepts, mechanisms and the empirical evidence. Marine Ecology 33, 1-25.
| Crossref | Google Scholar |
Engelhard GH, Heino M (2004) Maturity changes in Norwegian spring-spawning herring Clupea harengus: compensatory or evolutionary responses? Marine Ecology Progress Series 272, 245-256.
| Crossref | Google Scholar |
Engstedt O, Engkvist R, Larsson P (2014) Elemental fingerprinting in otoliths reveals natal homing of anadromous Baltic Sea pike (Esox lucius L.). Ecology of Freshwater Fish 23, 313-321.
| Crossref | Google Scholar |
French B, Potter IC, Hesp SA, Coulson PG, Hall NG (2014) Biology of the harlequin fish Othos dentex (Serranidae), with particular emphasis on sexual pattern and other reproductive characteristics. Journal of Fish Biology 84, 106-132.
| Crossref | Google Scholar | PubMed |
Grunwald C, Maceda L, Waldman J, Stabile J, Wirgin I (2008) Conservation of Atlantic sturgeon Acipenser oxyrinchus oxyrinchus: delineation of stock structure and distinct population segments. Conservation Genetics 9, 1111-1124.
| Crossref | Google Scholar |
Hallett CS, Valesini FJ, Clarke KR, Hoeksema SD (2016) Effects of a harmful algal bloom on the community ecology, movements and spatial distributions of fishes in a microtidal estuary. Hydrobiologia 763, 267-284.
| Crossref | Google Scholar |
Hallett CS, Hobday AJ, Tweedley JR, Thompson PA, McMahon K, Valesini FJ (2018) Observed and predicted impacts of climate change on the estuaries of south-western Australia, a Mediterranean climate region. Regional Environmental Change 18, 1357-1373.
| Crossref | Google Scholar |
Hamilton DP, Douglas GB, Adeney JA, Radke LC (2006) Seasonal changes in major ions, nutrients and chlorophyll a at two sites in the Swan River estuary, Western Australia. Marine and Freshwater Research 57, 803-815.
| Crossref | Google Scholar |
Healey MC (1980) Growth and recruitment in experimentally exploited lake whitefish (Coregonus clupeaformis) populations. Canadian Journal of Fisheries and Aquatic Sciences 37, 255-267.
| Crossref | Google Scholar |
Higgins KA, Vanni MJ, González MJ (2006) Detritivory and the stoichiometry of nutrient cycling by a dominant fish species in lakes of varying productivity. Oikos 114, 419-430.
| Crossref | Google Scholar |
Hixon MA, Johnson DW, Sogard SM (2014) BOFFFFs: on the importance of conserving old-growth age structure in fishery populations. ICES Journal of Marine Science 71, 2171-2185.
| Crossref | Google Scholar |
Hsieh C-H, Yamauchi A, Nakazawa T, Wang W-F (2010) Fishing effects on age and spatial structures undermine population stability of fishes. Aquatic Sciences 72, 165-178.
| Crossref | Google Scholar |
Jolly MT, Aprahamian MW, Hawkins SJ, Henderson PA, Hillman R, O’Maoiléidigh N, Maitland PS, Piper R, Genner MJ (2012) Population genetic structure of protected allis shad (Alosa alosa) and twaite shad (Alosa fallax). Marine Biology 159, 675-687.
| Crossref | Google Scholar |
Kanou K, Sano M, Kohno H (2004) Food habits of fishes on unvegetated tidal mudflats in Tokyo Bay, central Japan. Fisheries Science 70, 978-987.
| Crossref | Google Scholar |
Keefer ML, Caudill CC (2014) Homing and straying by anadromous salmonids: a review of mechanisms and rates. Reviews in Fish Biology and Fisheries 24, 333-368.
| Crossref | Google Scholar |
Kim GW, DeVries DR (2000) Effects of a selectively reduced gizzard shad population on trophic interactions and age-0 fishes in Walker County Lake, Alabama. North American Journal of Fisheries Management 20, 860-872.
| Crossref | Google Scholar |
Kurup RG, Hamilton DP (2002) Flushing of dense, hypoxic water from a cavity of the Swan River estuary, Western Australia. Estuaries 25, 908-915.
| Crossref | Google Scholar |
Lenanton RCJ, Loneragan NR, Potter IC (1985) Blue-green algal blooms and the commercial fishery of a large Australian estuary. Marine Pollution Bulletin 16, 477-482.
| Crossref | Google Scholar |
Lester NP, Shuter BJ, Venturelli P, Nadeau D (2014) Life-history plasticity and sustainable exploitation: a theory of growth compensation applied to walleye management. Ecological Applications 24, 38-54.
| Crossref | Google Scholar | PubMed |
Lorenzen K (2016) Toward a new paradigm for growth modeling in fisheries stock assessments: embracing plasticity and its consequences. Fisheries Research 180, 4-22.
| Crossref | Google Scholar |
Lorenzen K, Enberg K (2002) Density-dependent growth as a key mechanism in the regulation of fish populations: evidence from among-population comparisons. Proceedings of the Royal Society of London – B. Biological Sciences 269, 49-54.
| Crossref | Google Scholar |
Martin J, Rougemont Q, Drouineau H, Launey S, Jatteau P, Bareille G, Berail S, Pécheyran C, Feunteun E, Roques S, Clavé D, Nachón DJ, Antunes C, Mota M, Réveillac E, Daverat F (2015) Dispersal capacities of anadromous Allis shad population inferred from a coupled genetic and otolith approach. Canadian Journal of Fisheries and Aquatic Sciences 72, 991-1003.
| Crossref | Google Scholar |
Maunder MN, Deriso RB (2003) Estimation of recruitment in catch-at-age models. Canadian Journal of Fisheries and Aquatic Sciences 60, 1204-1216.
| Crossref | Google Scholar |
Medeiros ESF, Arthington AH (2008) The importance of zooplankton in the diets of three native fish species in floodplain waterholes of a dryland river, the Macintyre River, Australia. Hydrobiologia 614, 19-31.
| Crossref | Google Scholar |
Mertz G, Myers RA (1996) Influence of fecundity on recruitment variability of marine fish. Canadian Journal of Fisheries and Aquatic Sciences 53, 1618-1625.
| Crossref | Google Scholar |
Miles NG, Walsh CT, Butler G, Ueda H, West RJ (2014) Australian diadromous fishes – challenges and solutions for understanding migrations in the 21st century. Marine and Freshwater Research 65, 12-24.
| Crossref | Google Scholar |
Miranda LE, Gu H (1998) Dietary shifts of a dominant reservoir planktivore during early life stages. Hydrobiologia 377, 73-83.
| Crossref | Google Scholar |
Miranda LE, Norris DM, Starnes VR, Faucheux NM, Holman T (2020) Stock-recruitment dynamics of a freshwater clupeid. Fisheries Research 221, 105378.
| Crossref | Google Scholar |
Mundahl ND, Wissing TE (1987) Nutritional importance of detritivory in the growth and condition of gizzard shad in an Ohio reservoir. Environmental Biology of Fishes 20, 129-142.
| Crossref | Google Scholar |
Neira FJ, Potter IC, Bradley JS (1992) Seasonal and spatial changes in the larval fish fauna within a large temperate Australian estuary. Marine Biology 112, 1-16.
| Crossref | Google Scholar |
Ohlberger J, Langangen Ø, Stige LC (2022) Age structure affects population productivity in an exploited fish species. Ecological Applications 32, e2614.
| Crossref | Google Scholar | PubMed |
Ottersen G, Holt RE (2023) Long-term variability in spawning stock age structure influences climate–recruitment link for Barents Sea cod. Fisheries Oceanography 32, 91-105.
| Crossref | Google Scholar | PubMed |
Palkovacs EP, Hasselman DJ, Argo EE, Gephard SR, Limburg KE, Post DM, Schultz TF, Willis TV (2014) Combining genetic and demographic information to prioritize conservation efforts for anadromous alewife and blueback herring. Evolutionary Applications 7, 212-226.
| Crossref | Google Scholar | PubMed |
Post JR, Parkinson EA, Johnston NT (1999) Density-dependent processes in structured fish populations: interaction strengths in whole-lake experiments. Ecological Monographs 69, 155-175.
| Crossref | Google Scholar |
Potter IC, Loneragan NR, Lenanton RCJ, Chrystal PJ (1983) Blue-green algae and fish population changes in a eutrophic estuary. Marine Pollution Bulletin 14, 228-233.
| Crossref | Google Scholar |
Pusey BJ, Jardine TD, Beesley LS, Kennard MJ, Ho TW, Bunn SE, Douglas MM (2021) Carbon sources supporting Australia’s most widely distributed freshwater fish, Nematalosa erebi (Günther) (Clupeidae: Dorosomatinae). Marine and Freshwater Research 72, 288-298.
| Crossref | Google Scholar |
Quain T (1947) Fishing in river and estuary: no downward trend in production. In The West Australian, 27 October 1947, p. 14. Available at https://trove.nla.gov.au/newspaper/article/46809530/3813122
Rochet M-J (1998) Short-term effects of fishing on life history traits of fishes. ICES Journal of Marine Science 55, 371-391.
| Crossref | Google Scholar |
Rochet M-J (2000) A comparative approach to life-history strategies and tactics among four orders of teleost fish. ICES Journal of Marine Science 57, 228-239.
| Crossref | Google Scholar |
Rose KA, Cowan JH, Jr, Winemiller KO, Myers RA, Hilborn R (2001) Compensatory density dependence in fish populations: importance, controversy, understanding and prognosis. Fish and Fisheries 2, 293-327.
| Crossref | Google Scholar |
Rouyer T, Sadykov A, Ohlberger J, Stenseth NC (2012) Does increasing mortality change the response of fish populations to environmental fluctuations? Ecology Letters 15, 658-665.
| Crossref | Google Scholar | PubMed |
Ruibal-Conti AL, Summers R, Weaver D, Hipsey MR (2013) Hydro-climatological non-stationarity shifts patterns of nutrient delivery to an estuarine system. Hydrology and Earth System Sciences Discussions 10, 11035-11092.
| Crossref | Google Scholar |
Schaus MH, Vanni MJ, Wissing TE (2002) Biomass-dependent diet shifts in omnivorous gizzard shad: implications for growth, food web, and ecosystem effects. Transactions of the American Fisheries Society 131, 40-54.
| Crossref | Google Scholar |
Schindler DE, Hilborn R, Chasco B, Boatright CP, Quinn TP, Rogers LA, Webster MS (2010) Population diversity and the portfolio effect in an exploited species. Nature 465, 609-612.
| Crossref | Google Scholar | PubMed |
Schmidt DJ, Crook DA, Macdonald JI, Huey JA, Zampatti BP, Chilcott S, Raadik TA, Hughes JM (2014) Migration history and stock structure of two putatively diadromous teleost fishes, as determined by genetic and otolith chemistry analyses. Freshwater Science 33, 193-206.
| Crossref | Google Scholar |
Schnute J (1981) A versatile growth model with statistically stable parameters. Canadian Journal of Fisheries and Aquatic Sciences 38, 1128-1140.
| Crossref | Google Scholar |
Secor DH (2000) Longevity and resilience of Chesapeake Bay striped bass. ICES Journal of Marine Science 57, 808-815.
| Crossref | Google Scholar |
Silberstein RP, Aryal SK, Durrant J, Pearcey M, Braccia M, Charles SP, Boniecka L, Hodgson GA, Bari MA, Viney NR, McFarlane DJ (2012) Climate change and runoff in south-western Australia. Journal of Hydrology 475, 441-455.
| Crossref | Google Scholar |
Smith KA, Lenanton RCJ (2021) Almost forgotten: historical abundance of eel-tail catfish populations in south-western Australian estuaries and their decline due to habitat loss and historical overfishing. Regional Studies in Marine Science 41, 101605.
| Crossref | Google Scholar |
Smith I, Power S (2014) Past and future changes to inflows into Perth (Western Australia) dams. Journal of Hydrology: Regional Studies 2, 84-96.
| Crossref | Google Scholar |
Smith ADM, Punt AE (1998) Stock assessment of gemfish (Rexea solandri) in eastern Australia using maximum likelihood and Bayesian methods. In ‘Fisheries stock assessment models’. (Eds TJ Quinn II, F Funk, J Heifetz, JN Ianelli, JE Powers, JF Schweigert, PJ Sullivan, C-I Zhang) Alaska Sea Grant College Program, AK-SG-98-01, pp. 245–286. (University of Alaska: Fairbanks, AK, USA)
Smith KA, Coulson PG, Hesp SA (2022) Exceptional longevity in a lightly exploited, semi-anadromous clupeid (Perth herring Nematalosa vlaminghi) within a degraded estuarine environment. Journal of Fish Biology 100, 390-405.
| Crossref | Google Scholar | PubMed |
Spencer RS (1956) Studies in Australian estuarine hydrology. II. The Swan River. Australian Journal of Marine and Freshwater Research 7, 193-253.
| Crossref | Google Scholar |
Stearns SC, Koella JC (1986) The evolution of phenotypic plasticity in life-history traits: predictions of reaction norms for age and size at maturity. Evolution 40, 893-913.
| Crossref | Google Scholar | PubMed |
Sternberg D, Balcombe S, Marshall J, Lobegeiger J (2008) Food resource variability in an Australian dryland river: evidence from the diet of two generalist native fish species. Marine and Freshwater Research 59, 137-144.
| Crossref | Google Scholar |
Thompson PA, Hosja W (1996) Nutrient limitation of phytoplankton in the upper Swan River estuary, Western Australia. Marine and Freshwater Research 47, 659-667.
| Crossref | Google Scholar |
Twomey L, John J (2001) Effects of rainfall and salt-wedge movement on phytoplankton succession in the Swan–Canning Estuary, Western Australia. Hydrological Processes 15, 2655-2669.
| Crossref | Google Scholar |
Uehara M, Tachihara K (2016) Habitat shift with growth of larval and juvenile Nematalosa spp.: bay-dependent early life history. Bulletin of the Japanese Society of Fisheries Oceanography 80, 289-301.
| Google Scholar |
Valesini FJ, Cottingham A, Hallett CS, Clarke KR (2017) Interdecadal changes in the community, population and individual levels of the fish fauna of an extensively modified estuary. Journal of Fish Biology 90, 1734-1767.
| Crossref | Google Scholar | PubMed |
Vanni MJ, Bowling AM, Dickman EM, Hale RS, Higgins KA, Horgan MJ, Knoll LB, Renwick WH, Stein RA (2006) Nutrient cycling by fish supports relatively more primary production as lake productivity increases. Ecology 87, 1696-1709.
| Crossref | Google Scholar | PubMed |
Waldman J, Wilson KA, Mather M, Snyder NP (2016) A resilience approach can improve anadromous fish restoration. Fisheries 41, 116-126.
| Crossref | Google Scholar |
Warwick RM, Tweedley JR, Potter IC (2018) Microtidal estuaries warrant special management measures that recognise their critical vulnerability to pollution and climate change. Marine Pollution Bulletin 135, 41-46.
| Crossref | Google Scholar | PubMed |
Wessels G, Moloney CL, van der Lingen CD (2010) The effects of freezing on the morphometrics of sardine Sardinops sagax (Jenyns, 1842). Fisheries Research 106, 528-534.
| Crossref | Google Scholar |
Wright PJ, Trippel EA (2009) Fishery-induced demographic changes in the timing of spawning: consequences for reproductive success. Fish and Fisheries 10, 283-304.
| Crossref | Google Scholar |
Yako LA, Dettmers JM, Stein RA (1996) Feeding preferences of omnivorous gizzard shad as influenced by fish size and zooplankton density. Transactions of the American Fisheries Society 125, 753-759.
| Crossref | Google Scholar |
Yoneda M, Kitano H, Nyuji M, Nakamura M, Takahashi M, Kawabata A, Matsuyama M, Shimizu A, Tsuzaki T, Togashi H, Kamimura Y (2022) Maternal spawning experience and thermal effects on offspring viability of chub mackerel and their influence on reproductive success. Frontiers in Marine Science 9, 1063468.
| Crossref | Google Scholar |