

Growth and formation of annual zones in whole otoliths of Greenland halibut, a slow-growing deep-water fish
O. T. AlbertInstitute of Marine Research, PO Box 6404, NO-9294 Tromsø, Norway. Email: oleta@imr.no
Marine and Freshwater Research 67(7) 937-942 https://doi.org/10.1071/MF15089
Submitted: 2 March 2015 Accepted: 1 December 2015 Published: 18 March 2016
Journal Compilation © CSIRO Publishing 2016 Open Access CC BY-NC-ND
Abstract
There is currently no generally agreed and validated method for age estimation of Greenland halibut (Reinhardtius hippoglossoides) from otoliths, and ageing of intermediate sized individuals of this deep-water flatfish is considered particularly uncertain. To estimate otolith growth and annual zone formation in this size range, a large oxytetracycline tagging experiment was undertaken in 2005–08 in the nursery grounds north of the Svalbard Archipelago. By January 2015, 89 of the recaptured fish had both been at large for between 1 and 6 years and had reliable length measurements at release and recapture; 29 of the recaptures were returned with whole otoliths and with a chemical time stamp that allowed identification of otolith growth patterns during time at large. Four age readers interpreted the otoliths without knowing the position of the time stamps. The expected number of zones during time at large was between three and six for 79% of recaptures, and the mean reader bias was only 0.04–0.56 years. Juvenile growth was quantified and the data were analysed in relation to sex and recapture area. This study contributes to a fully validated ageing method for use in stock assessments of this commercially important species.
Additional keywords: age, chemical tag, oxytetracycline.
Introduction
The most common method to estimate the age of an individual fish is to count growth zones in calcified structures such as otoliths (Matta and Kimura 2012). However, the zonation patterns in otoliths reflect life history and ecological events (Campana 2001; Panfili et al. 2002). For slow-growing deep-water species, there are often frequent growth checks, and what constitutes an annual pair of zones is subjective (Talman et al. 2003; ICES 2013). It is therefore important to apply some sort of ageing protocols to guide interpretation. This protocol needs to be based on validation or corroboration studies that increase the likelihood that the resulting age estimates on average provide accurate age information for the population in question. Because zone formation is affected by many factors, validations need to be done for each species, population, age span and time period (Campana 2001).
Greenland halibut (Reinhardtius hippoglossoides) is a deep-living flatfish that supports commercially important fisheries in arctic and boreal regions on both sides of the North Atlantic and the North Pacific. However, it is difficult to age, and there is no commonly agreed ageing protocol. Historically, Greenland halibut was thought to be a relatively fast-growing fish and an internationally agreed protocol for age reading was established (ICES 1997). In the past decade, a variety of age validation and corroboration methods on Greenland halibut have emerged (Gregg et al. 2006; Cooper et al. 2007; Treble et al. 2008; Albert et al. 2009); they all indicate a much slower growth than previously anticipated. In addition, two recent workshops reached similar conclusions (Treble and Dwyer 2008; ICES 2011).
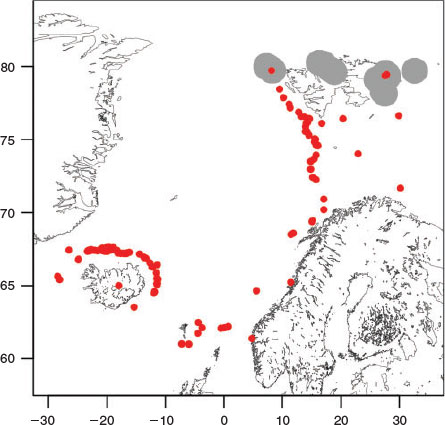
For Greenland halibut in the north-east Atlantic, Albert et al. (2009) identified a transition zone between the fast juvenile and slow adult growth phases, where the identification of putative annual zones was particularly difficult. To investigate growth (and migrations) of Greenland halibut in this phase, a major tagging experiment was performed in the known nursery area during 2005–08, and fish were largely recaptured after 1–6 years on major fishing grounds 150–2000 km further south (Fig. 1; Albert and Vollen 2015). At tagging, the fish were also injected with oxytetracycline (OTC), a chemical compound that is known to bind to growing calcified tissue, producing a chemical time stamp in, for example, otoliths (McFarlane and Beamish 1987). Based on the results from this experiment, Albert and Vollen (2015) analysed migrations and links between management units in the north-east Atlantic. In the present study, the growth and formation of zones in these larger juvenile Greenland halibut otoliths in relation to fish size, growth, sex and migration are investigated. In addition, the bias in age reading using the established IMR (Institute of Marine Research) protocol (IMR, unpubl. data) is estimated.
|
Materials and methods
Tagging procedures
In all, 25 149 juvenile Greenland halibut that were caught in the nursery areas north and east of Svalbard were tagged during four surveys: a pilot cruise in September 2005 and three dedicated cruises in September 2006, 2007 and 2008. The fish were caught with a commercial bottom trawl equipped with a cod-end aquarium; selected individuals were carefully taken out of the aquarium, their length measured and they were tagged with a green T-bar anchor tag. Details of the survey and tagging procedures have been published previously (Albert and Vollen 2015).
In addition to the T-bar tags, all fish above 25-cm total length were injected with OTC using 100 mg mL–1 injection solution Aquacycline Vet. (Midland Vet Services, Omaha, NB, USA) and two Socorex (Ecublens, Switzerland) vaccination syringes with injection volumes of 0.025–0.300 and 0.1–1.0 mL . The needles were 0.5 mm thick and 5 mm long (Unimed, Lausanne, Switzerland). The OTC was injected on the eye side of the fish, close to the base of the pectoral fin. The injection volume was ~50 mg OTC kg–1 fish weight, based on results from previous tagging experiments on Greenland halibut (Treble et al. 2005, 2008).
Recapture information
Information about the tagging experiments was publicised repeatedly in Norwegian, Russian, and Icelandic fisheries newspapers, and a reward was offered for the return of the tags, with a comparatively large reward for the return of the whole fish. Depending on where the recaptured halibut were caught, some were initially handled by colleagues from the Institute of Marine Research or from marine research institutes in Iceland, Faroe Islands or Russia, and then sent to the Institute of Marine Research in Norway. Measurements of length at recapture and other biological data were considered reliable if they were made by these research personnel.
As of January 2015, a total of 177 recaptures was recorded, 145 of which had been at large for more than 300 days. Of these, 89 had length recorded reliably at both release and recapture, and these fish are denoted as the ‘growth collection’ in this paper. Of the 145 recaptures that had been at large for more than 300 days, 42 were returned either whole or with otoliths stored in paper envelopes. However, six of these otolith pairs lacked fluorescence and seven were broken into too many pieces to be readable. The remaining 29 recaptures constitute the ‘OTC collection’.
Data analyses
Otoliths from the OTC collection were photographed under a dissection microscope using both translucent normal light and reflected ultraviolet (UV) light. Four age readers analysed the otolith images of the OTC collection individually, using the method described by Albert et al. (2009) and following recommendations from the ICES Workshop on Age Reading of Greenland Halibut (ICES 2011). For otolith nomenclature and definitions, the glossary by Matta and Kimura (2012) is followed. The age readers did not have access to the fluorescence images and they had no additional information other than month of recapture. All age readers were trained in age reading, but their experience with this particular species and method as applied at the IMR in recent years varied from several years to a few weeks. They annotated each otolith image with marks of each annual zone, assuming 1 January as the birthdate. By later comparisons of the annotated images and the fluorescence images, the number of identified annual zones that fell outside of the OTC band was identified. These numbers of annual zones outside the fluorescent bands were compared with the known time intervals between release and recapture. The author subsequently established the post hoc assumed age of each otolith based on the known time at large, the position of the fluorescent bands and the interpretations made by the different age readers, and taking into account previously established and partly validated reading rules (Albert et al. 2009). Therefore, these assumed ages are not realistic age estimates using standard protocols, but rather the best approximation of the true age at the time of capture for particular individuals in the OTC collection.
Mean annualized growth was estimated as the length increment during time at large multiplied by 365 and divided by the number of days at large. To describe the mean annualized growth as a function of length at release, a linear regression model including piece-wise cubic splines was fitted to the data as described in the ‘spline.des’ function in the statistical programming package R (https://www.r-project.org/, accessed 12 February 2015). t-Tests were used to evaluate the significance of parameters for sex and recapture locations.
For comparison of the age and length data with previous accounts for the north-east Arctic management unit, length data for the first few age groups were extracted from a stratified random bottom trawl survey covering the nursery grounds around Svalbard in September 2005. These data have been described previously by Albert et al. (2009), who also made a partial validation of the ageing for the first few length modes.
Results
Recapture composition and recapture localities
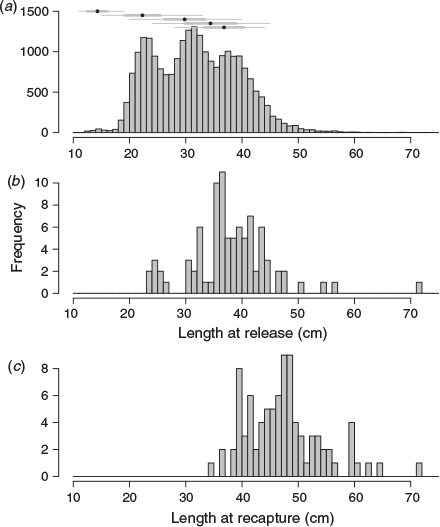
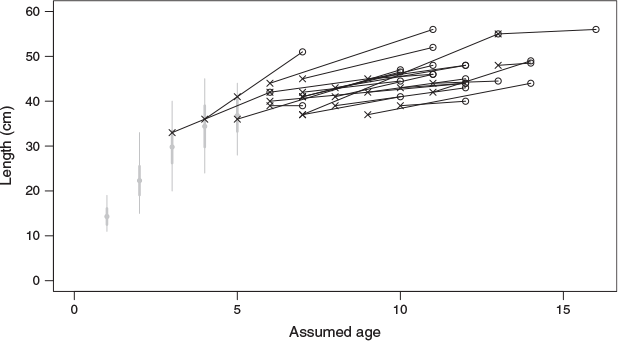
Although the tagging of individual Greenland halibut was made in a length-stratified manner, the length–frequency composition of all the 25 149 tagged and released fish showed three well-defined modal groups (Fig. 2a). Comparing with the length distributions of the youngest age groups from the juvenile survey (Albert et al. 2009), illustrated at the top of Fig. 2a, it appears that the modal group at ~23 cm represents 2-year-old fish. These smallest tagged individuals were under-represented among the recaptures (Fig. 2b). The length range at release for the 89 fish in the growth collection spanned 23–72 cm, but 88% of them were among the larger half of the tagged individuals.
|
The recaptures were made after various times at large, ranging from 316 to 2811 days, with a mean of 1442 days. The mean (±s.d.) length at release was 30.5 ± 7.2 cm, compared with 47.8 ± 6.8 cm at recapture (Fig. 2c). Sex was determined for 54 of the recaptures, and 61% were female. The recaptures were from the main fishing grounds of the north-east Arctic (NEA) and the west Nordic (WN) management units, as described by Albert and Vollen (2015), with 74% from the latter region. Mean fishing depth was 517 m, and all fish were caught with commercial groundfish trawls.
Growth of fish and otoliths during time at large
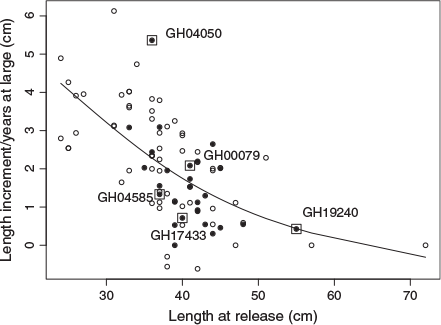
For the recaptured fish with reliable length measurements (n = 89), the mean annualised growth during time at large varied from –0.6 to 6.1 cm, with higher values observed for fish that were relatively small at release (Fig. 3). Mean (±s.d.) annualised growth during time at large was 3.6 ± 1.1 cm for the 10 smallest (≤31 cm) released fish, and 0.6 ± 0.8 cm for the 10 largest (≥45 cm). A linear spline regression model of mean annualized growth v. length at release, with recapture region (NEA and WN), showed no significant effect of recapture region (P > 0.1, t-test). Neither sex nor recapture region were found to have significant effects after including sex in the model (n = 54; P > 0.1, t-test).
|
The 29 fish with OTC-marked otoliths that constitute the OTC collection ranged in size from 33 to 55 cm at time of release (Fig. 3). No OTC-marked otoliths were available for the recaptures that were 23–33 cm at time of release. The change in otolith size during time at large was nearly linear in relation to change in fish size. In a linear model of otolith growth v. fish growth, neither sex, length at release, time at sea nor recapture region were significant (P > 0.1, t-test).
Appearance of annual zones
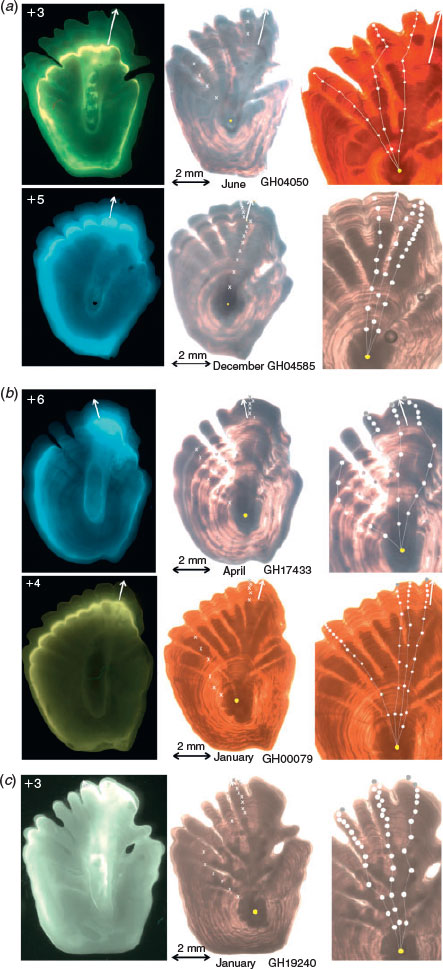
To illustrate the appearance of the fluorescent bands and the assumed annual zones, five examples were selected: two relatively fast-growing and two relatively slow-growing individuals between 36 and 41 cm at time of release, as well as the one in the OTC collection with the largest length at release (55 cm) (Fig. 3). They all showed very distinct fluorescent bands (4a–c), indicating that otolith growth during the first few weeks after release occurred primarily at the margins. The smaller individuals at release show substantial fluorescence and some additional growth around most of the otolith circumferences (Fig. 4a). The somewhat larger individuals (Fig. 4b) show more difference in fluorescence, with higher intensity in the anterior than in the posterior part (upper and lower part respectively of the otolith images). The largest fish at release (Fig. 4c) showed only fluorescence and additional growth in the anterior part.
|
The four individual age readers identified from zero to 10 zones in the regions outside the fluorescent bands without knowing where the fluorescent bands were located in the otoliths. This compares with the one to six annual zones expected. Of the 29 otoliths in the reference collection, the four readers identified the correct number of zones in 6, 11, 12 and 13 otoliths, closely resembling their individual level of experience. The mean bias was low for all age readers, ranging from –0.14 to +0.56 years, with an overall mean of 0.19 years. Accepting a bias of ±1 year, the accuracy of individual age readers listed by decreasing experience was 75, 89, 74 and 68% respectively.
Total age and growth
Based on known time at large, the position of the fluorescent band, individual age readers’ interpretations and previous validation work (Albert et al. 2009), the author established post hoc the assumed ages of the OTC collection as between 6 and16 years, whereas estimates from the individual age readers were between 5 and 19 years. The relative biases between individual age reader estimates and the assumed ages ranged from –7 to +8 years, but the mean relative bias for all samples in the OTC collection only ranged from –1.6 to +2.5 for individual age readers. The more experienced age readers had somewhat clearer bias structure, with one distinct modal group, than the less experienced readers. Precision was also slightly better for the two most experienced age readers. The mean CV for all four age readers per assumed age group was 16.3%, whereas for individual readers the corresponding values ranged from 13 to 22%.
Accepting the assumed ages as the true ages at time of recapture gives two pairs of length-at-age data per fish in the OTC collection, one at time of release and one at time of recapture (Fig. 5). The mean (±s.e.) linear growth from age-6 and above was 1.1 ± 0.2 cm year–1.
|
Discussions
Age interpretation
For typically slow-growing and long-lived deep-water fish, the otolith zonation pattern, especially the spacing and appearance of annual zones, may change between the juvenile fast-growth zones and the often regular, distinct and narrow zones of older ages (Matta and Kimura 2012; ICES 2013). Annual zones in this area are often considered the most difficult to interpret. The most recent workshop on Greenland halibut ageing (ICES 2011) considered these mid-ages (indicated as ages-5–10) as in need of resolving. For the north-east Arctic stock, Albert et al. (2009) validated both the first few and the last few annual zones of adult fish with slow growth, and the present paper shows that the mid-age zones may be reasonably accurately determined on the surface of whole right otoliths.
After tagging, there were identifiable zones that, on average, were produced annually. These were identified by the individual readers with varying accuracy. The mean bias for individual age readers was only between 0.04 and 0.56 years, which must be regarded as relatively low when the expected number of zones was between three and six for 79% of the recaptures. However, the marginal growth of whole otoliths after tagging was severely limited for the larger juveniles, making zones very densely packed. This seems the most probable explanation for the significant increase in negative bias in zone counts during time at large for the most slow-growing individuals. The results indicate a very slow adult growth rate and the current ageing protocol likely underestimates the age of older fish. Continued development of a refined or an alternative ageing protocol for Greenland halibut (e.g. including transverse sections for the larger individuals) is required.
The precision (CV) of the total age estimates by the individual age readers varied from 13 to 22%, with a mean of 16%. This is a relatively low precision that may affect estimation of population rates (Quinn and Deriso 1999). This precision is similar to that reported for many other slow-growing fish species (ICES 2013) and may be accounted for in statistical analyses (Powers 1983). It is also a good thing that the most experienced age readers had better precision than the less experienced readers, which indicates that there is scope for improvement by continued training and exchanges.
Growth estimates
Although a previous age and growth study of this stock (Albert et al. 2009) focussed on both the first few age groups (ages-1–5) and on adult fish from the main fishing areas (largely estimated as 10–20 years), because of the design of the tagging experiment the present study focussed on juvenile Greenland halibut of intermediate size and age. The length distribution of the present data overlapped with both previous datasets for the younger and older fish. The present estimated lengths at age for 3–5-year-old fish (30–40 cm) were similar with the previous results from analyses of length–frequency modes of young fish. The mean (±s.e.) length increase per year for the OTC collection was 1.1 ± 0.2 cm, which is between the previous estimates of the fast growth of younger individuals (3–8 cm) and the slow growth of tagged and recaptured adult fish (0.6 cm). There was also a clear reduction in growth rate with increasing size and age and, for fish above minimum legal landing size (45 cm), the mean annual length increase was <1 cm. Thus, the present results agree with those of the previous study (Albert et al. 2009) and with other studies reporting or indicating slow growth rates of this species (Gregg et al. 2006; Cooper et al. 2007; Treble et al. 2008).
Unlike most tag–recapture experiments, where recapture information is recorded by fishermen using non-standardised methods and equipment, the present study largely relied on research personnel during both release and recapture. With recaptured fish at large for up to 6 years and age determination based on a method that now has been validated for a broad age and length span, it is likely that the reported length-at-age relationship is currently the most accurate available for juvenile north-east Arctic Greenland halibut, at least up to 12 years and 45 cm (Fig. 5).
However, accurate growth estimates require representative sampling. Greenland halibut is highly migratory, the migrations are partly size selective and occur to un-fished areas and the stock boundaries in the region are not completely known (Godø and Haug 1989; Albert 2003; Knutsen et al. 2007; Albert and Vollen 2015). Although the present study did not find any difference in growth rate between recaptures from different management areas, a basin-wide study of growth and migration is required to establish a fully representative picture of the variability in growth within the population. The now increasingly validated ageing protocol and emerging knowledge of connectivity across the north-east Atlantic should make this feasible, and may also be timely as a reference before climate changes may drive this commercially important Arcto-Boreal species further to the Arctic proper (Hollowed et al. 2013).
Acknowledgements
The author is grateful to Tone Vollen for coordinating practical aspects of the tagging program, and to the other IMR field workers participating in the tagging surveys at 80° northern latitude. The editor and two anonymous referees are thanked for valuable suggestions for improving the manuscript.
References
Albert, O. T. (2003). Migration from nursery to spawning area in relation to growth and maturation for Greenland halibut (Reinhardtius hippoglossoides) in the northeast Arctic. Journal of Northwest Atlantic Fishery Science 31, 113–125.Albert, O. T., and Vollen, T. (2015). A major nursery area around the Svalbard archipelago provides recruits for the stocks in both Greenland halibut management areas in the northeast Atlantic. ICES Journal of Marine Science 72, 872–879.
| A major nursery area around the Svalbard archipelago provides recruits for the stocks in both Greenland halibut management areas in the northeast Atlantic.Crossref | GoogleScholarGoogle Scholar |
Albert, O. T., Kvalsund, M., Vollen, T., and Salberg, A.-B. (2009). Towards accurate age determination of Greenland halibut. Journal of Northwest Atlantic Fishery Science 40, 81–95.
| Towards accurate age determination of Greenland halibut.Crossref | GoogleScholarGoogle Scholar |
Campana, S. E. (2001). Accuracy, precision and quality control in age determination, including a review of the use and abuse of age validation methods. Journal of Fish Biology 59, 197–242.
| Accuracy, precision and quality control in age determination, including a review of the use and abuse of age validation methods.Crossref | GoogleScholarGoogle Scholar |
Cooper, D. W., Maslenikov, K. P., and Gunderson, D. R. (2007). Natural mortality rate, annual fecundity, and maturity at length for Greenland halibut (Reinhardtius hippoglossoides) from the northeastern Pacific Ocean. Fishery Bulletin 105, 296–304.
Godø, O. R., and Haug, T. (1989). A review of the natural history, fisheries, and management of the Greenland halibut (Reinhardtius hippoglossoides) in the eastern Norwegian and Barents Seas. Journal du Conseil – Conseil International pour l’Exploration de la Mer 46, 62–75.
| A review of the natural history, fisheries, and management of the Greenland halibut (Reinhardtius hippoglossoides) in the eastern Norwegian and Barents Seas.Crossref | GoogleScholarGoogle Scholar |
Gregg, J. L. D., Anderl, M., and Kimura, D. K. (2006). Improving the precision of otolith-based age estimates for Greenland halibut (Reinhardtius hippoglossoides) with preparation methods adapted for fragile sagittae. Fishery Bulletin 104, 643–648.
Hollowed, A. B., Planque, B., and Loeng, H. (2013). Potential movement of fish and shellfish stocks from the sub-Arctic to the Arctic Ocean. Fisheries Oceanography 22, 355–370.
| Potential movement of fish and shellfish stocks from the sub-Arctic to the Arctic Ocean.Crossref | GoogleScholarGoogle Scholar |
ICES (1997). Report of the ICES/NAFO workshop on Greenland halibut age determination. 26–29 November 1996, Reykjavik, Iceland. International Council for the Exploration of the Sea CM 1997/G:1. Available at http://www.ices.dk/community/Documents/PGCCDBS/G0197.pdf [Verified 2 February 2016].
ICES (2011). Report of the Workshop on Age Reading of Greenland Halibut (WKARGH). 14–17 February 2011, Vigo, Spain. International Council for the Exploration of the Sea CM 2011/ACOM: 41. Available at https://www.imr.no/filarkiv/2011/05/wkargh_2011.pdf/nb-no[Verified 2 February 2016].
ICES (2013). Report of the Workshop on Age Estimation Methods of Deep-water Species (WKAMDEEP). 21–25 October 2013, Mallorca, Spain. International Council for the Exploration of the Sea CM 2013/ACOM: 83. Available at http://archimer.ifremer.fr/doc/00179/29038/27474.pdf [Verified 2 February 2016].
Knutsen, H., Jorde, P. E., Albert, O. T., Hoelzel, A. R., and Stenseth, N. C. (2007). Population genetic structure in the North Atlantic Greenland halibut (Reinhardtius hippoglossoides): influenced by oceanic current systems? Canadian Journal of Fisheries and Aquatic Sciences 64, 857–866.
| Population genetic structure in the North Atlantic Greenland halibut (Reinhardtius hippoglossoides): influenced by oceanic current systems?Crossref | GoogleScholarGoogle Scholar |
Matta, M. E., and Kimura, D. K. (Eds) 2012. Age determination manual of the Alaska Fisheries Science Center Age and Growth Program. NOAA Professional Paper NMFS 13. Available at http://spo.nwr.noaa.gov/pp13.pdf [Verified 2 February 2016].
McFarlane, G. A., and Beamish, R. J. (1987). Selection of dosages of oxytetracycline for age validation studies. Canadian Journal of Fisheries and Aquatic Sciences 44, 905–909.
| Selection of dosages of oxytetracycline for age validation studies.Crossref | GoogleScholarGoogle Scholar |
Panfili, J., Troadec, H., de Puntual, H., and Wright, P. J. (Eds) (2002). Manual of schlerochronology in fishes. IFREMER-IRD. Available at http://archimer.ifremer.fr/doc/00017/12801/9742.pdf [Verified 2 February 2016].
Powers, J. E. (1983). Some statistical characteristics of ageing data and their ramifications in population analysis of oceanic pelagic fishes. In ‘Proceedings of the International Workshop on Age Determination of Oceanic Pelagic Fishes: Tunas, Billfishes, and Sharks’, 15–18 February 1982, Miami, FL, USA. (Eds E. D. Prince and L. M. Pulos.) Vol. 8, National Oceanic and Atmospheric Administration (NOAA) Technical Report, pp. 19–24. (National Marine Fisheries Service (NMFS): Washington DC, USA.)
Quinn, T. J., II, and Deriso, R. B. (1999). ‘Quantitative Fish Dynamics.’ (Oxford University Press: New York.)
Talman, S., Krusic-Golub, K., Roberson, S., and Green, C. (2003). Age estimation of deepwater fish species from the eastern north Atlantic. Final Report to the Bord Iascaigh Mhara (Irish Sea Fisheries Board). (Marine and Freshwater Resources Institute, Department of Primary Industries: Queenscliff, Vic., Australia.)
Treble, M. A., and Dwyer, K. S. (2008). Report of the Greenland halibut (Reinhardtius hippoglossoides) Age Determination Workshop. In ‘NAFO Scientific Council Studies’. (Ed. A. Thompson.) Report number 41, pp. 1–90. (Northwest Atlantic Fisheries Organization: Dartmouth, NS, Canada.) Available at http://archive.nafo.int/open/studies/s41/S41.pdf [Verified 4 February 2016].
Treble, M., Campana, S. E., Wastle, R. J., Jones, C. M., and Boje, J. (2005). An assessment of age determination methods, with age validation of Greenland halibut from the northwest Atlantic. NAFO SCR Doc. 05/43. Available at http://archive.nafo.int/open/sc/2005/scr05-043.pdf [Verified 2 February 2016].
Treble, M., Campana, S. E., Wastle, R. J., Jones, C. M., and Boje, J. (2008). Growth analysis and age validation of a deepwater Arctic fish, the Greenland halibut (Reinhardtius hippoglossiodes). Canadian Journal of Fisheries and Aquatic Sciences 65, 1047–1059.
| Growth analysis and age validation of a deepwater Arctic fish, the Greenland halibut (Reinhardtius hippoglossiodes).Crossref | GoogleScholarGoogle Scholar |