

Quantitative electron microprobe mapping of otoliths suggests elemental incorporation is affected by organic matrices: implications for the interpretation of otolith chemistry
A. McFadden A B E , B. Wade B , C. Izzo C , B. M. Gillanders C , C. E. Lenehan D and A. Pring DA Department of Chemistry, School of Physical Sciences, The University of Adelaide, North Terrace, Adelaide, SA 5005, Australia.
B Adelaide Microscopy, The University of Adelaide, Frome Road, Adelaide, SA, 5005, Australia.
C Southern Seas Ecology Laboratories, School of Biological Sciences, The University of Adelaide, North Terrace, Adelaide, SA 5005, Australia.
D School of Chemical and Physical Sciences, Flinders University, Bedford Park, SA, 5042, Australia.
E Corresponding author. Email: aoife.mcfadden@adelaide.edu.au
Marine and Freshwater Research 67(7) 889-898 https://doi.org/10.1071/MF15074
Submitted: 25 February 2015 Accepted: 28 September 2015 Published: 27 November 2015
Journal Compilation © CSIRO Publishing 2016 Open Access CC BY-NC-ND
Abstract
In an effort to understand the mechanism of otolith elemental incorporation, the distribution of strontium (Sr) and sulfur (S) in otoliths of Platycephalus bassensis was investigated in conjunction with otolith growth patterns. Optimisation of electron probe microanalysis (EPMA) quantitative mapping achieved both high spatial resolution (<3 µm) and two-dimensional visualisation of the fine scale Sr and S distributions in otoliths of P. bassensis with minimal damage. Electron backscatter diffraction (EBSD) mapping confirmed that grain growth is aligned with the otolith c-axis, with grain orientation independent of both otolith elemental composition and growth patterns. Results showed a linear correlation between Sr and S distribution (R2 = 0.86), and a clear association with the otolith growth patterns determined by scanning electron microscopy. Further examination by laser ablation–inductively coupled plasma–mass spectrometry (LA-ICP-MS) showed that incorporation of Mg and Ba appeared independent of both S distribution and the growth patterns. The results suggest that element incorporation into the otolith is linked to the organic composition in the endolymph during mineralisation, and the organic matrices may assist, in part, the uptake of Sr. Thus, these findings may have significant implications for the interpretation of otolith Sr chemistry.
Additional keywords: biomineralisation, electron backscatter diffraction, electron probe microanalysis, fish.
Introduction
Otoliths are calcium carbonate structures primarily composed of calcium carbonate and organic matrices (<10%) that are involved in the maintenance of balance and hearing in the inner ear of teleost fish. The predictable growth properties of otoliths and permanent uptake of trace elements from the environment is advantageous for a variety of ecological applications, including age determination, stock identification, migration pathway reconstruction and elucidation of environmental histories (Campana 1999; Elsdon et al. 2008). Otolith growth and composition are dependent on environmental factors, such as water composition, temperature and salinity, as well as biological factors including genetics, ontogeny, diet and elemental fractionation through biological transport (Barnes and Gillanders 2013; Reis-Santos et al. 2013; Woodcock et al. 2013).
Biomineralisation is highly regulated by organic macromolecules, which are usually negatively charged proteins containing carboxylate, sulfate and phosphate functional groups (Addadi et al. 1987; Mann 1988). These groups are thought to bind Ca2+ ions, and could be involved in the control of crystal nucleation by lowering the energy of formation between the crystal and the organic substrate (Weiner 1986; De Yoreo and Vekilov 2003). Sulfur uptake in otoliths is well documented in the study of nutrient flows, migratory patterns and hypoxia (Weber et al. 2002; Limburg et al. 2015), but the role of sulfated macromolecules in biomineralisation is not well understood. In otoliths, it is thought that sulfate groups primarily occur in a class of proteins called proteoglycans (Addadi et al. 1987; Albeck et al. 1996). Evidence for the involvement of proteoglycans in biomineralisation is abundant across many biomineral types, including mollusc shells (Simkiss 1965), sea urchin spines (Wilt 1999), eggshells (Arias et al. 1992) and fish otoliths (Borelli et al. 2001). Inorganic experiments demonstrate the ability of various proteoglycans to stabilise nucleation and influence crystal size and orientation (Addadi and Weiner 1985; Addadi et al. 1987; Arias et al. 2004). To extract valuable information from the chemistry of otoliths, it is necessary to understand the mechanism of elemental uptake during organic-mediated biomineralisation (Campana 1999; Kalish 1989).
Elemental incorporation in biominerals is not well understood and, although organic matrices determine the physical properties of biominerals and provide a template for formation (Lowenstam and Weiner 1989; Weiner and Dove 2003; Addadi et al. 2006), organic matrices may exhibit affinities for minor and trace elements and preferentially facilitate or inhibit uptake. Based on shell microstructure and elemental composition, recent bivalve shell studies have suggested the possibility that Sr is not under environmental control (Foster et al. 2009; Poulain et al. 2015) but rather that Sr fractionation is mediated by sulfate-rich organic macromolecules at the site of calcification (Schöne et al. 2013; Shirai et al. 2014). However, aragonitic shells are considerably more enriched in trace elements than otoliths, so the mechanism of incorporation may differ between the two biominerals (Schöne et al. 2013; Shirai et al. 2014). Otoliths undergo greater biological fractionation of elements on uptake than shells (Campana 1999), although the trace element compositions of both biominerals are predicted to reflect the environment, suggesting a related, although perhaps not identical mechanism. As such, studies of eel otoliths have indicated that excess glycosaminoglycans (GAGs), a component of proteoglycans, released during larval eel metamorphosis may affect Sr fractionation (Otake 1994; Tzeng 1996). Both studies noted changes in the Sr : Ca ratios during metamorphosis that could not be accounted for by the surrounding ambient environmental conditions (Otake 1994; Tzeng 1996). Distribution of Sr within the otolith has also been noted to be affected by the formation of the seasonal translucent and opaque zones (Toole et al. 1993; Tomás et al. 2006). Despite these studies, to our knowledge the role organic matrices play in the fractionation of minor and trace elements in otoliths has not been evaluated.
Elemental quantification within microstructural features (1–5 µm) of otoliths is limited by: (1) the spatial resolution of the commonly used techniques; (2) the sensitivity of the otolith structure to damage during analysis; and (3) the sensitivity of available techniques to the elements of interest. Electron microprobe analysis (EPMA) offers a significant improvement in spatial resolution compared with laser ablation–inductively coupled plasma–mass spectrometry (LA-ICP-MS) and is a well-established technique for the evaluation of major and minor elements in otoliths (Gunn et al. 1992; Zimmerman and Nielsen 2003). Herein we report an optimised EPMA method using mean atomic number (MAN) background collection for the two-dimensional visualisation of minor and trace elemental composition at high resolution (<3 µm).
We hypothesised that otolith trace elements are fractionated during mineralisation in the endolymph and suggest that understanding this fractionation may reduce the assumptions inherent in interpretation of otolith chemistry. The aim of the present study was to optimise quantitative EPMA mapping to investigate the relationship between otolith composition and growth patterns at a fine scale (<3 µm) with a view to evaluating the effect of the organic matrix on elemental fractionation in otolith biomineralisation to improve future interpretations of otolith chemistry in relation to ecological issues.
Materials and methods
Sample preparation
Sagittal otoliths were obtained from specimens of juvenile sand flathead (Platycephalus bassensis, Platycephalidae) a demersal coastal marine species collected from Investigator Strait, South Australia. Upon removal, otoliths were rinsed in ultrapure water to remove any adhering tissue, air dried in a laminar fume hood and stored in microcentrifuge tubes for later examination. Otoliths were subsequently embedded in two part epoxy resin and sectioned through the core to expose the growth increments using a Buehler ISOMET low-speed saw (Lake Bluff, IL, USA). Sectioned otoliths were polished on a Struers TegraPol mechanical polisher (Cleveland, OH, USA), with a graded series of lapping cloths starting with 9 µm, 3 µm and finishing on 0.04 µm colloidal silica. Between each polish, samples were cleaned ultrasonically and rinsed thoroughly in ultrapure water. Prior to scanning electron microscopy (SEM) and EPMA, the polished sections were carbon coated to avoid sample charging during analysis.
SEM and image analysis
SEM was used to visualise the growth patterns and grain microstructure of the otoliths, primarily by backscatter electron imaging (BSE). All images were acquired on an FEI (Eindhoven, Netherlands) Quanta 450 Field Emission Gun SEM operated at 20 kV. High-magnification images were subsequently stitched together in Microsoft (Redmond, WA, USA) ICE. These images were used to relate the otolith growth patterns and grain microstructure to the elemental distribution maps. No etching of the surface was used before imaging to avoid removing minor and trace elements. Of the samples imaged, four otoliths (FH275, FH276, FH277 and FH278) were selected for quantitative mapping by EPMA.
Image analysis, undertaken in ImageJ (National Institutes of Health (NIH), Bethesda, MD, USA) and Avizo Fire 8.1 (FEI), allowed for the determination of grain size across the otolith sections. Grain size was determined through segmentation of the SEM images by thresholding and the application of an adjustable watershed that segments grains based on the Euclidean distance map method (Vincent and Soille 1991). All images were analysed in both ImageJ and Avizo Fire to ensure reproducible results.
Electron backscatter diffraction
Electron backscatter diffraction (EBSD) was used to determine the grain orientation across the otolith sections. EBSD patterns were acquired on a Phillips (Eindhoven) XL30 FEG SEM equipped with an Oxford Instruments Channel 5 Nordlys (Abingdon, UK) EBSD detector. Operating conditions included an accelerating voltage of 15 kV for EBSD mapping at a tilt angle of 70° and a working distance of 20 mm.
Electron probe microanalysis
EPMA quantitative maps were acquired on a CAMECA (Paris, France) SXFive microprobe. The instrument was equipped with five wavelength dispersive spectrometers (WDS), four of which have large diffracting crystals. Data were acquired and processed in Probe for EPMA software (Eugene, OR, USA). Analytical conditions for spot analyses consisted of an accelerating voltage of 15 kV and a beam current of 20 nA, using beam diameters ranging between 2 and 20 µm. Elements analysed, peak and background positions, count times, standards and elemental overlap corrections for spot analyses are summarised in Table 1. Quantitative elemental maps were collected with a focussed beam of 15 kV, 100 nA, with pixel size of 1 µm and a dwell time of 100 ms. Oxygen and carbon weight percentage content (wt%) were calculated by stoichiometry.

|
To improve the signal to noise ratio and detection limits of the analysis of sulfur (S), WDS signal aggregation was used with two LPET diffracting crystals. Elemental S maps of the four otolith samples were processed using each LPET spectrometer individually and also via aggregating the counts into a single file. The subsequent detection limits for the two individual spectrometers and the aggregated data were determined for S. The detection limits, expressed as parts per million (equivalent to milligrams per kilogram), for Spectrometer A, Spectrometer B and the aggregated signal were 900, 1200 and 300 ppm respectively, demonstrating the superior detection limit possible with count aggregation.
MAN backgrounds were used for quantitative mapping to reduce damage to the beam-sensitive otoliths. Maps were processed in CalcImage (Probe Software, Eugene, OR, USA) and visualised in Surfer (Golden Software, Golden, CO, USA). The detection limits for Ca, Sr and S in EPMA maps were calculated to be 500, 600 and 300 ppm respectively, calculated to assume detection at threefold the background variance. The limits of quantification for Ca, Sr and S were subsequently calculated to be 1700, 1800 and 900 ppm respectively, calculated to assume quantification at 10-fold the background variance. The effective spatial resolution of the electron beam, taking into account accelerating voltage, beam current and sample matrix, was ~2 µm in diameter, which is adequate to resolve the L and D zones on the antisulcal side of the otoliths; however, the sulcal L and D zones are finer than the effective spatial resolution and as a result are averaged.
Laser ablation inductively coupled plasma mass spectrometry
LA-ICP-MS elemental analyses were performed on an Agilent 7700cx quadrupole ICP-MS (Agilent Technologies, Melbourne, Vic., Australia) coupled to an ASI Resonetics (M-50 Excimer Laser equipped with a Laurin Technic Cell (ASI, Canberra, ACT, Australia). National Institute of Standards and Technology (NIST) 612 standard reference material was used as the external standard, with the US Geological Survey calcium carbonate MACS-3 measured as a secondary standard. Spot analyses were undertaken adjacent to EPMA analyses at a pulse rate of 5 Hz, laser fluence of ~3.5 mJ µm–2 and spot diameters of 17–24 µm. All data were processed in Glitter (GEMOC, Macquarie University, Sydney, NSW, Australia) and elemental concentrations were calculated by using the 43Ca signal within each sample as an internal standard, because Ca was previously quantified independently by EPMA. Elemental maps were collected using a pulse rate of 10 Hz, laser fluence of ~3.5 mJ µm–2, 14-µm spot diameter and a scan speed of 14 µm s–1. Isotope dwell times were as follows: 43Ca, 5 ms; 88Sr, 50 ms; 24Mg, 20 ms; 138Ba, 50 ms. All data were processed and output as elemental maps using the program Iolite (Melbourne University, Melbourne, Vic.) developed by the Melbourne Isotope Group (Woodhead et al. 2007). The detection limits for Sr, Mg and Ba were calculated to be 59, 0.75 and 0.15 ppm respectively, calculated to assume detection at threefold the background variance. The limits of quantification for Sr, Mg and Ba were calculated to be 199, 2.5 and 0.5 ppm respectively, calculated to assume quantification at 10-fold the background variance. The effective spatial resolution of the LA-ICP-MS maps is 14 µm in the y direction and ~4 µm in the x direction. The spatial resolution in the y direction is fixed by the spot diameter, whereas the spatial resolution in the x direction is dependent on the spot diameter, scan speed and analysis time. Therefore, the LA-ICP-MS maps are only able to resolve the seasonal growth of otoliths.
Results
Effect of MAN backgrounds
Repeated spot measurements at beam diameters of 2, 5, 7, 10 and 20 µm were collected on otolith material without moving the sample in order to determine the degradation of the calcium carbonate over time (Fig. 1). At small beam diameters (high beam power density) there was a significant increase in the apparent measured Ca wt% with repeated measures. Thus, larger beam diameters are required to minimise damage to the otolith during repeated measures.
|
The beam-sensitive nature of otoliths prevents the collection of a second pass off-peak background acquisition for quantitative mapping and, as a result, MAN background fits were assessed as an alternative for quantitative mapping of otoliths. A comparison of the accuracy and precision of elemental maps created using off-peak backgrounds v. those using MAN fit backgrounds was undertaken using a natural aragonite crystal from the Tazouta Mine, Sefrou Morocco (voucher number G34206; South Australian Museum, Adelaide, SA, Australia) as a proxy for the otolith. The absolute numbers and errors were then compared with those of the spot analysis on the aragonite. Aragonite was chosen because it is an ideal CaCO3 mineral that is much less sensitive to beam damage than otoliths, removing this as a variable in the comparison. The bulk concentrations of Ca, Sr and S for aragonite (taken as an average of the concentrations from each pixel within a 300 × 300-µm map) determined by both off-peak and MAN background methods are given in Table 2. Both methods gave virtually identical results; however, the MAN approach required only one irradiation rather than the two used by off-peak background measurements, thus significantly reducing the likelihood of damage to otoliths. The levels of Ca and Sr detected within the aragonite using both methods are typical of those of otoliths, and both are detectable at errors of <5%. Absolute values are also comparable to those determined by more accurate spot analyses (Table 2). In aragonite, S is present at lower levels (~100 ppm) than is expected from the otoliths (~500 ppm) and so errors are expected to be marginally improved for real otolith samples.

|
Otolith growth patterns and microstructure
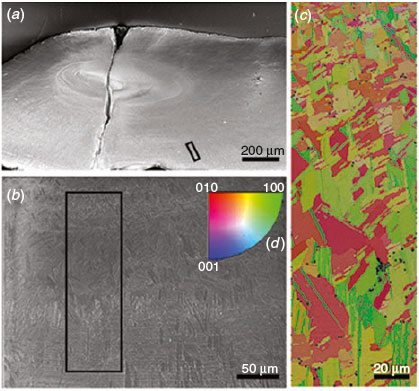
Sectioned P. bassensis otoliths exhibit the typical alternating paired opaque D-zone bands (areas rich in organic material) and translucent L-zone bands (areas rich in calcium carbonate; for a more detailed definition, see Jolivet et al. 2008). D-Zones were clearly visible on the antisulcal side of otoliths, ranging in width from 1 to 15 µm, although the thinner daily growth bands on the sulcal side, with widths ≤1 µm, were not always distinct. BSE imaging revealed the presence of D-zone bands throughout the aragonite grains (Fig. 2). Acicular microstructure (crystal fabrics) dominates the otolith, with growth occurring outwards from the core. The grain size increases from the core, where individual grains are small (<0.5 µm2) and bordering on indistinct because of a high organic content, to large grains (>100 µm2) at the outer growth surface.

|
An exception to the general trend of grain size increase from the core to the outer surface was observed when the sulcal and antisulcal sides of the otolith were compared. Grain size showed a greater increase towards the sulcus. On the sulcal side, where the bulk of otolith growth occurs, the D-zone bands were thinner and the L-zone bands were more defined. Towards the antisulcus, grain size and L-zone width were compressed, whereas the D-zones were broader, possibly due to a lower degree of calcification away from the sensory epithelium.
EBSD maps indicated that the aragonite grain growth is aligned with the c-axis (Fig. 3). Grain orientation was independent of growth patterns and elemental composition.
|
Otolith elemental distribution
Strontium and S were distributed heterogeneously across the four otolith samples analysed, each with the highest concentrations at the D-zones compared with the intervening L-zones (Fig. 4). The mean (±95% confidence interval (CI)) Sr concentration across the entire otolith map for all four samples (FH275, FH276, FH277 and FH278) was 1720 ± 280 ppm, with the highest mean Sr concentration being 3400 ± 300 ppm. The mean (±95% CI) S concentration across the entire otolith map for all four samples was 550 ± 50 ppm, with the highest mean concentration being 1000 ± 75 ppm. Concentrations of Sr and S were linearly correlated in all four samples. Plotting the correlation for sample FH278 gave an R2 of 0.86 (Fig. 5).

|
|
The distribution of Sr and S in P. bassensis otoliths showed a correlation with the D-zones (Fig. 4). The growth bands on the antisulcal side were well resolved by EPMA mapping, but the spatial resolution of the technique did not allow for adequate resolution of the much finer growth bands on the sulcal side. Quantitative EPMA maps revealed that Sr concentrations were, on average, 40% higher in the D-zones than the adjacent L-zones, whereas concentrations of S in the L-zones fell below the detection limit. The concentration of Sr in each D-zone varied, whereas S concentrations remained consistent across all D-zones (Fig. 4). Although the Sr concentration in the D-zones was above the limits of quantification, the concentration of S in the bands was just on the limit of quantification.
Because they fell close to the limit of quantification obtained from mapping, Sr concentrations were also evaluated by LA-ICP-MS and EPMA spot analyses. The mean (±95% CI) Sr concentration determined by LA-ICP-MS in the four samples using a 17-µm spot diameter was 2230 ± 250 ppm. EPMA spot analyses with a 20-µm beam diameter yielded a mean (±95% CI) Sr concentration in the four samples of 2020 ± 200 ppm (Table 3), compared with a mean (±95% CI) Sr concentration determined by EPMA mapping with a 1-µm beam diameter of 1720 ± 280 ppm.
|
LA-ICP-MS maps of the otolith seasonal translucent and opaque banding revealed that the distribution of Mg and Ba did not exhibit the same correlation with otolith growth patterns, or S distribution as seen for Sr (Fig. 6). The mean (±95% CI) Mg and Ba concentrations in the four samples were 9.1 ± 1.1 and 1.3 ± 0.19 ppm respectively. The Mg distribution was largely inverse to that of Sr, with increased concentrations in the otolith core, and in diffuse bands where Sr levels were the lowest (Fig. 6). The distribution of Ba showed some concentrated bands in common with Sr, although the thin bands of high concentration were inadequately resolved and could not be linked to growth pattern changes (Fig. 6).

|
Discussion
Optimisation of EPMA mapping
EPMA mapping was optimised for quantification of Sr and S to take advantage of the high spatial resolution (<3 µm) provided by the technique. One of the major limitations of quantitative mapping by EPMA is the damage caused by the electron beam to sensitive materials such as otoliths. This damage is due to the decomposition of the aragonite structure and subsequent loss of CO2 under the beam and is particularly problematic for repeated measurements (Gunn et al. 1992; Zimmerman and Nielsen 2003). However, as beam diameter increased, beam power density was reduced because of beam spread across a larger area, and consequently CO2 loss decreased. Otolith analysis should use a beam power density of <3 µW µm–2, as noted by Gunn et al. (1992), which we found corresponded to a beam diameter of 20 µm. We observed significant changes in elemental quantification with repeated measurements, suggesting that accurate quantitative analyses require a reduction in beam time and the elimination of repeated measurements (but see Zimmerman and Nielsen 2003, who found contrasting results). To circumvent the problem of damage at small beam diameters and the need for repeated measures during quantitative mapping, MAN backgrounds were assessed as an alternative to traditional off-peak background measurements to reduce beam time on the sample.
Traditional off-peak background collection requires two sweeps of the electron beam across the sample, which is unacceptable for elemental quantification of otoliths. Unlike off-peak backgrounds, MAN backgrounds are calculated from the dependence of the X-ray background continuum on MAN. By measuring and curve fitting the background X-ray intensities at the analytical peak in standards that do not contain any of the analyte or interfering elements, the acquisition time and the effect of beam damage is significantly reduced (Donovan and Tingle 1996).
Quantitative elemental mapping at spatial resolutions close to the size of the otolith growth features allows for a better understanding of the relationship between the growth pattern and composition. Coarser sampling by LA-ICP-MS and EPMA spot analyses demonstrated the effect of averaging across the growth patterns, whereby the extreme values can be under- or overestimated because of sampling at resolutions larger than the growth features. The effect of signal averaging at coarse spatial resolution has been investigated in mollusc shells, where there was a pronounced reduction in peak height of the highest concentrations across the growth lines (Shirai et al. 2014). The effect of averaging was largely overcome in the present study by EPMA mapping because the features of interest (i.e. the D and L zones) were larger than or equal in size to the beam diameter. Averaging is particularly problematic when relating growth patterns to composition in otoliths and should always be considered with care in the interpretation of chronological profiles.
Otolith composition and structure
The association between the distribution of Sr and S, and the otolith growth patterns, indicates that the incorporation of Sr is affected by the biomineralisation process in the otoliths of P. bassensis. The role of biological processes in trace element partitioning has been reported previously (Kalish 1989; Campana 1999) and the effects of the elemental pathways and barriers between the water and the otolith have been summarised by Campana (1999). Although the effects of partitioning on physiologically important elements such as Na, P, K and Cl are significant and unpredictable (Campana 1999), the effects on many trace elements are more subtle (Kalish 1989) and are often considered negligible when concentration closely reflects the elemental composition of the water. Based on observations of the present study and the assumption that the changing growth pattern and S distribution reflect the organic composition at the site of mineralisation, we suggest that the organic matrices in the endolymph partially facilitate the uptake of Sr and affect overall otolith composition. Recent reports from mollusc shell studies support this interpretation, because the Sr : Ca and S : Ca ratios exhibit a distinct relationship with the shell microstructure (Foster et al. 2009; Schöne et al. 2013; Shirai et al. 2014).
Role of the organic matrix
Based on the correlation of S with the D-zones, S is assumed to be incorporated in the otolith as a component of the organic matrix, not as inorganic sulfate. This assumption is supported by studies of aragonitic mollusc shells, in which S primarily exists as sulfate within polysaccharides and proteoglycans, whereas a smaller fraction is included as amino acids (Cuif et al. 2003; Dauphin et al. 2005). Neither CaSO4 nor SrSO4 have been reported in otoliths, but some mollusc shell studies have reported the presence of inorganic sulfate (Siriprom et al. 2011; Yoshimura et al. 2013). Although not undertaken on otoliths, chemical speciation studies on a variety of biominerals, including mollusc shells and corals, indicate that S exists primarily as a component of the organic matrix (Lowenstam and Weiner 1989; Cuif et al. 2003). The function of sulfated macromolecules in biominerals has not been established, but it is proposed that organic sulfate contained within the crystal grains plays a role in nucleation, whereas organic sulfate between the grains is responsible for controlling properties such as size and shape (Arias et al. 2004; Addadi et al. 2006).
The organic macromolecules most likely responsible for the high S concentrations at the growth bands are sulfated proteoglycans, which have been observed in the endolymph and extracted from otoliths (Payan et al. 1997; Borelli et al. 2001; Arias et al. 2004). The role of proteoglycans in otolith biomineralisation has not been established, but their anionic properties have led to the suggestion of a role in concentrating Ca2+ ions at the endolymph–crystal interface (Borelli et al. 2001). Borelli et al. (2001) observed an increasing proximodistal gradient of proteoglycans in the endolymphs of Oncorhychus mykiss and Psetta maxima, whereas proteins, collagens and amino acids exhibited a decreasing proximodistal gradient. It was suggested that there may be a relationship between the endolymph gradient and the otolith growth axes, notably that the strong growth at the sulcus may be associated with the proximodistally decreasing gradients of proteins and collagens (Borelli et al. 2001). Inversely, the increasing proximodistal gradient of proteoglycans may be limiting growth at the antisulcus by binding free cations in the endolymphatic fluid (Payan et al. 2002). At the antisulcal side, where grain size is smaller, the appearance of broad D-zones supports the notion of a growth-inhibiting action of S-rich organic matrices. The growth pattern correlation with Sr would also suggest such organic macromolecules exhibit a high cation-binding affinity, perhaps leading to enhanced Sr incorporation, predominantly at the antisulcus. However, the fine scale microstructure on the sulcal side is not adequately resolved by EPMA mapping to determine whether such observations are exclusive to the antisulcus or are equivalent on the sulcal side at a finer, unresolved scale.
The role of proteoglycans in otoliths has not been established, but if they are indeed the macromolecules observed by proxy through the S distribution, then a role in crystal orientation control can be ruled out. Grain orientation in biominerals is predicted to be constrained by the organic template, an insoluble collagen-like protein present throughout the mineral structure. The independence of grain orientation and elemental composition in the present study suggests that the organic template exerts little or no control over trace element uptake.
Otolith chemistry
Differences in the distribution of Sr, Mg and Ba throughout the otolith may be a result of environmental changes, but may also be explained, in part, by differences in the site occupied by each element in the aragonite structure. High-energy X-ray absorption studies have revealed that Sr is randomly substituted for Ca in the aragonite structure of otoliths (Doubleday et al. 2014). Therefore, the relationship between Sr and the S-rich organic matrices is unlikely to be a result of direct binding of the organic matrix to Sr, but rather a result of organic-mediated fractionation during mineralisation. It is predicted that most of the discrimination against Sr incorporation occurs during crystallisation rather than during Sr uptake from the water because of the similarity in the water–otolith and endolymph–otolith partition coefficients (Campana 1999). Using our results, the mean water–otolith partition coefficient (DSr) is calculated to be 0.19 assuming a mean seawater Sr : Ca ratio of 8.9 mmol mol–1. This is comparable to estimates of other studies and to the calculated endolymph–otolith DSr of 0.25 (Kalish 1989); however, it is unclear whether the Sr fractionation is related to the presence of S-rich proteoglycans because of the limits of detection and spatial resolution constraints of EPMA mapping. Sr and S were shown to be correlated at the D-zones, where concentrations are the highest, but the S concentrations fell below the detection limits within the L-zones. Current observations point towards the facilitation of Sr uptake by the S-rich organic matrices, but it is unclear whether these observations are exclusive to the D-zones or extend throughout the otolith structure at concentrations below the detection limits of EPMA.
Mg is present in otoliths at concentrations too low to evaluate its bonding mode; however, mollusc shell studies show Mg to be hosted by the organic component as a disordered phase in biogenic aragonite (Foster et al. 2008). The high concentration of Mg observed in the otolith core by LA-ICP-MS mapping supports this possibility in otoliths as well, although it also indicates that the organic matrix involved in otolith nucleation and initial growth may not be the S-rich organic matrix observed by proxy in the present study. The S-rich proteoglycans are not known to be involved in the nucleation process, but rather are implicated in the inhibition of crystal growth in specific stereochemical directions (Addadi et al. 1987). Mg is more likely to be bound by a component of the organic matrix involved in nucleation, rather than have uptake facilitated as in the case of Sr.
The host site of Ba within otoliths has not been evaluated, although it is predicted to occupy sites analogous to those of Sr (Pingitore 1986; Dietzel et al. 2004). Because of the larger ionic radius of Ba (1.47 Å) than Ca (1.18 Å), substitution of Ba for Ca is more limited than that of Sr. Because of the increase in crystal defects with greater Sr uptake (Pingitore 1986), uptake of Ba may be facilitated by Sr in waters with a high Sr : Ca ratio (de Vries et al. 2005). However, based on our LA-ICP-MS maps, Ba is not affected by the organic matrix or the Sr concentration, which may be due to a low Sr : Ca ratio for our samples (1–3 mmol mol–1), below that needed to facilitate Ba uptake (>4 mmol mol–1; de Vries et al. 2005). Despite this, it cannot be ruled out that a relationship exists at a spatial resolution below that achieved by LA-ICP-MS mapping.
Implications for otolith chemistry interpretation
The correlation of Sr with both S and otolith growth patterns may have implications for the interpretation of otolith chemistry, but there are still ambiguities to be addressed before such implications can be fully understood. The present study highlights that Sr and S are linked in the D-zones, and suggests that S-rich organic matrices play a role in Sr incorporation, possibly by concentrating Sr at the site of mineralisation. However, the detection limits of EPMA limit our understanding of the relationship across the entire otolith. If Sr and S are correlated within the L-zones as well as the D-zones, then it is possible that S-rich organics are responsible for the fractionation of Sr between the endolymph and otolith. In that case, the observed variation in Sr would be directly related to ambient water concentration. However, if the correlation is only present within the organic-rich D-zones, then the observed Sr variation at the bands may be a result of the concentration of the organic matrices in the endolymph, rather than the ambient water concentration. The distinction is one of importance with regard to implications for otolith chemistry interpretations, but a definitive answer currently remains below the spatial resolution and detection limits of the techniques available.
Conclusions
Using MAN background fits and signal aggregation, high-resolution, two-dimensional elemental mapping of otoliths by EPMA revealed a relationship between Sr and S distribution and the otolith growth patterns, providing an insight into the role of biomineralisation in otolith elemental incorporation. Otolith grain orientation was independent of otolith growth patterns and composition, suggesting that the organic template upon which growth is constrained is unlikely to be involved in elemental uptake. Under the assumption that S is present as a component of the organic matrix, we suggest that Sr uptake is mediated by organic macromolecules in the endolymph, with S-rich organic matrix components, such as proteoglycans, likely candidates in the facilitation. Without direct measurement of the organic matrices, it is not possible to reach definitive conclusions, but recent findings in mollusc shells support the suggestion of an organic-mediated Sr uptake in biogenic systems. Further studies are needed to investigate the extent of the relationship across the otolith at lower detection limits to fully understand the implications of biomineralisation on otolith chemistry interpretations. Further investigations into the organic matrix at a fine scale will also improve our understanding of elemental uptake in biogenic systems, such as otoliths.
Acknowledgements
The authors acknowledge the facilities and the scientific and technical assistance of the Australian Microscopy and Microanalysis Research Facility at Adelaide Microscopy, The University of Adelaide. The support of all the Adelaide Microscopy staff is gratefully acknowledged. B. M. Gillanders was supported by an Australian Research Council Future Fellowship (FT100100767).
References
Addadi, L., and Weiner, S. (1985). Interactions between acidic proteins and crystals – stereochemical requirements in biomineralization. Proceedings of the National Academy of Sciences of the United States of America 82, 4110–4114.| Interactions between acidic proteins and crystals – stereochemical requirements in biomineralization.Crossref | GoogleScholarGoogle Scholar | 1:CAS:528:DyaL2MXks1ylsrs%3D&md5=2f50f8f758fbe9dee247c2e60ebf8854CAS | 3858868PubMed |
Addadi, L., Moradian, J., Shay, E., Maroudas, N. G., and Weiner, S. (1987). A chemical model for the cooperation of sulfates and carboxylates in calcite crystal nucleation: relevance to biomineralization. Proceedings of the National Academy of Sciences of the United States of America 84, 2732–2736.
| A chemical model for the cooperation of sulfates and carboxylates in calcite crystal nucleation: relevance to biomineralization.Crossref | GoogleScholarGoogle Scholar | 1:CAS:528:DyaL2sXlt12ms7w%3D&md5=7678077f33ca902858bae6bd902a7909CAS | 16593827PubMed |
Addadi, L., Joester, D., Nudelman, F., and Weiner, S. (2006). Mollusk shell formation: a source of new concepts for understanding biomineralization processes. Chemistry 12, 980–987.
| Mollusk shell formation: a source of new concepts for understanding biomineralization processes.Crossref | GoogleScholarGoogle Scholar | 1:CAS:528:DC%2BD28Xht1Wnur4%3D&md5=54c3abd52133e90f818664891895c635CAS | 16315200PubMed |
Albeck, S., Weiner, S., and Addadi, L. (1996). Polysaccharides of intracrystalline glycoproteins modulate calcite crystal growth in vitro. Chemistry – a European Journal 2, 278–284.
| Polysaccharides of intracrystalline glycoproteins modulate calcite crystal growth in vitro.Crossref | GoogleScholarGoogle Scholar | 1:CAS:528:DyaK28XhvVOrsbg%3D&md5=8a79b81d6d68cea21003b9cd488d86c6CAS |
Arias, J. L., Carrino, D. A., Fernandez, M. S., Rodriguez, J. P., Dennis, J. E., and Caplan, A. I. (1992). Partial biochemical and immunochemical characterization of avian eggshell extracellular matrices. Archives of Biochemistry and Biophysics 298, 293–302.
| Partial biochemical and immunochemical characterization of avian eggshell extracellular matrices.Crossref | GoogleScholarGoogle Scholar | 1:CAS:528:DyaK38Xls1Oqurk%3D&md5=5170d32f209202c5391cd49dc1bfe815CAS | 1524440PubMed |
Arias, J. L., Neira-Carrillo, A., Arias, J. I., Escobar, C., Bodero, M., David, M., and Fernandez, M. S. (2004). Sulfated polymers in biological mineralization: a plausible source for bio-inspired engineering. Journal of Materials Chemistry 14, 2154–2160.
| Sulfated polymers in biological mineralization: a plausible source for bio-inspired engineering.Crossref | GoogleScholarGoogle Scholar | 1:CAS:528:DC%2BD2cXls1egs7w%3D&md5=51318b7f7fb6d849d0856dfa6c67ed67CAS |
Barnes, T. C., and Gillanders, B. M. (2013). Combined effects of extrinsic and intrinsic factors on otolith chemistry: implications for environmental reconstructions. Canadian Journal of Fisheries and Aquatic Sciences 70, 1159–1166.
| Combined effects of extrinsic and intrinsic factors on otolith chemistry: implications for environmental reconstructions.Crossref | GoogleScholarGoogle Scholar | 1:CAS:528:DC%2BC3sXhtFCisb3J&md5=25ec3c304cfa0ec3751b83ae5395b9baCAS |
Borelli, G., Mayer-Gostan, N., De Pontual, H., Boeuf, G., and Payan, P. (2001). Biochemical relationships between endolymph and otolith matrix in the trout (Oncorhynchus mykiss) and turbot (Psetta maxima). Calcified Tissue International 69, 356–364.
| Biochemical relationships between endolymph and otolith matrix in the trout (Oncorhynchus mykiss) and turbot (Psetta maxima).Crossref | GoogleScholarGoogle Scholar | 1:CAS:528:DC%2BD38XpvFykug%3D%3D&md5=342e84f50d68253f540aa7e2a59ffddfCAS | 11800233PubMed |
Campana, S. E. (1999). Chemistry and composition of fish otoliths: pathways, mechanisms and applications. Marine Ecology Progress Series 188, 263–297.
| Chemistry and composition of fish otoliths: pathways, mechanisms and applications.Crossref | GoogleScholarGoogle Scholar | 1:CAS:528:DC%2BD3cXjtFKmtA%3D%3D&md5=6aa6bd7f37d02a8ee60835938650a0bdCAS |
Cuif, J.-P., Dauphin, Y., Doucet, J., Salome, M., and Susini, J. (2003). XANES mapping of organic sulfate in three scleractinian coral skeletons. Geochimica et Cosmochimica Acta 67, 75–83.
| XANES mapping of organic sulfate in three scleractinian coral skeletons.Crossref | GoogleScholarGoogle Scholar | 1:CAS:528:DC%2BD38XpsV2ktLk%3D&md5=6348e283ea532b611128f788e87a2f75CAS |
Dauphin, Y., Cuif, J.-P., Salomé, M., and Susini, J. (2005). Speciation and distribution of sulfur in a mollusk shell as revealed by in situ maps using X-ray absorption near-edge structure (XANES) spectroscopy at the S K-edge. The American Mineralogist 90, 1748–1758.
| Speciation and distribution of sulfur in a mollusk shell as revealed by in situ maps using X-ray absorption near-edge structure (XANES) spectroscopy at the S K-edge.Crossref | GoogleScholarGoogle Scholar | 1:CAS:528:DC%2BD2MXht1GrtrnE&md5=bfb28121f74ff1be2ba35ea6e02c5a9eCAS |
de Vries, M. C., Gillanders, B. M., and Elsdon, T. S. (2005). Facilitation of barium uptake into fish otoliths: influence of strontium concentration and salinity. Geochimica et Cosmochimica Acta 69, 4061–4072.
| Facilitation of barium uptake into fish otoliths: influence of strontium concentration and salinity.Crossref | GoogleScholarGoogle Scholar | 1:CAS:528:DC%2BD2MXot1Wrtrg%3D&md5=86fb5dfd488e61f889563378bcd06ca1CAS |
De Yoreo, J. J., and Vekilov, P. G. (2003). Principles of crystal nucleation and growth. Reviews in Mineralogy and Geochemistry 54, 57–93.
| Principles of crystal nucleation and growth.Crossref | GoogleScholarGoogle Scholar | 1:CAS:528:DC%2BD2cXktVCmsw%3D%3D&md5=30495cd9b83e9f816f9eb673886f1b1cCAS |
Dietzel, M., Gussone, N., and Eisenhauer, A. (2004). Co-precipitation of Sr2+ and Ba2+ with aragonite by membrane diffusion of CO2 between 10 and 50°C. Chemical Geology 203, 139–151.
| Co-precipitation of Sr2+ and Ba2+ with aragonite by membrane diffusion of CO2 between 10 and 50°C.Crossref | GoogleScholarGoogle Scholar | 1:CAS:528:DC%2BD3sXpslCltLc%3D&md5=c2e487e082f28371d1a7c81df308d639CAS |
Donovan, J. J., and Tingle, T. N. (1996). An improved mean atomic number background correction for quantitative microanalysis. Microscopy and Microanalysis 2, 1–7.
| An improved mean atomic number background correction for quantitative microanalysis.Crossref | GoogleScholarGoogle Scholar | 1:CAS:528:DyaK28XksVWks78%3D&md5=ed91816a3bd4e3acd629b69f4baa3e27CAS |
Doubleday, Z. A., Harris, H. H., Izzo, C., and Gillanders, B. M. (2014). Strontium randomly substituting for calcium in fish otolith aragonite. Analytical Chemistry 86, 865–869.
| Strontium randomly substituting for calcium in fish otolith aragonite.Crossref | GoogleScholarGoogle Scholar | 1:CAS:528:DC%2BC3sXhvV2ku77M&md5=eb694917e610e6e393b90dad87646e0fCAS | 24299165PubMed |
Elsdon, T. S., Wells, B. K., Campana, S. E., Gillanders, B. M., Jones, C. M., Limburg, K. E., Secor, D. H., Thorrold, S. R., and Walther, B. D. (2008). Otolith chemistry to describe movements and life-history parameters of fishes: hypotheses, assumptions, limitations and inferences. In ‘Oceanography and Marine Biology: An Annual Review’, Vol 46. (Eds R. N. Gibson, R. J. A. Atkinson and J. D. M. Gordon.) pp. 297–330. (CRC Press–Taylor & Francis Group: Boca Raton.)
Foster, L. C., Finch, A. A., Allison, N., Andersson, C., and Clarke, L. J. (2008). Mg in aragonitic bivalve shells: seasonal variations and mode of incorporation in Arctica islandica. Chemical Geology 254, 113–119.
| Mg in aragonitic bivalve shells: seasonal variations and mode of incorporation in Arctica islandica.Crossref | GoogleScholarGoogle Scholar | 1:CAS:528:DC%2BD1cXps1Smu78%3D&md5=b8897b23a0bae19c0f8eac9c7af15b12CAS |
Foster, L. C., Allison, N., Finch, A. A., and Andersson, C. (2009). Strontium distribution in the shell of the aragonite bivalve Arctica islandica. Geochemistry Geophysics, Geosystems 10, Q03003.
| Strontium distribution in the shell of the aragonite bivalve Arctica islandica.Crossref | GoogleScholarGoogle Scholar |
Gunn, J. S., Harrowfield, I. R., Proctor, C. H., and Thresher, R. E. (1992). Electron probe microanalysis of fish otoliths: evaluation of techniques for studying age and stock discrimination. Journal of Experimental Marine Biology and Ecology 158, 1–36.
| Electron probe microanalysis of fish otoliths: evaluation of techniques for studying age and stock discrimination.Crossref | GoogleScholarGoogle Scholar |
Jolivet, A., Bardeau, J.-F., Fablet, R., Paulet, Y.-M., and Pontual, H. (2008). Understanding otolith biomineralization processes: new insights into microscale spatial distribution of organic and mineral fractions from Raman microspectrometry. Analytical and Bioanalytical Chemistry 392, 551–560.
| Understanding otolith biomineralization processes: new insights into microscale spatial distribution of organic and mineral fractions from Raman microspectrometry.Crossref | GoogleScholarGoogle Scholar | 1:CAS:528:DC%2BD1cXhtFOrtrrJ&md5=1d72d878be8c5be938705435aec95027CAS | 18665353PubMed |
Kalish, J. M. (1989). Otolith microchemistry: validation of the effects of physiology, age and environment on otolith composition. Journal of Experimental Marine Biology and Ecology 132, 151–178.
| Otolith microchemistry: validation of the effects of physiology, age and environment on otolith composition.Crossref | GoogleScholarGoogle Scholar | 1:CAS:528:DyaK3cXpsFyktQ%3D%3D&md5=b6b09cc965f998f18bbaa428167c44a3CAS |
Limburg, K. E., Walther, B. D., Lu, Z., Jackman, G., Mohan, J., Walther, Y., Nissling, A., Weber, P. K., and Schmitt, A. K. (2015). In search of the dead zone: use of otoliths for tracking fish exposure to hypoxia. Journal of Marine Systems 141, 167–178.
| In search of the dead zone: use of otoliths for tracking fish exposure to hypoxia.Crossref | GoogleScholarGoogle Scholar |
Lowenstam, H. A., and Weiner, S. (1989) ‘On Biomineralization.’ (Oxford University Press: New York.)
Mann, S. (1988). Molecular recognition in biomineralization. Nature 332, 119–124.
| Molecular recognition in biomineralization.Crossref | GoogleScholarGoogle Scholar | 1:CAS:528:DyaL1cXitFOrs7g%3D&md5=9b74a33ad77afc6ed0794cedff3cc28aCAS |
Otake, T. (1994). Drastic changes in otolith strontium/calcium ratios in leptocephali and glass eels of Japanese eel Anguilia japonica. Marine Ecology Progress Series 112, 189–193.
| Drastic changes in otolith strontium/calcium ratios in leptocephali and glass eels of Japanese eel Anguilia japonica.Crossref | GoogleScholarGoogle Scholar | 1:CAS:528:DyaK2MXitFSrtbw%3D&md5=101c275c29bc0224208b14974e4b19d2CAS |
Payan, P., Kossmann, H., Watrin, A., Mayer-Gostan, N., and Boeuf, G. (1997). Ionic composition of endolymph in teleosts: origin and importance of endolymph alkalinity. The Journal of Experimental Biology 200, 1905–1912.
| 1:CAS:528:DyaK2sXltFCntr8%3D&md5=de369a00ef9cb8a0dad61a408e3a3446CAS | 9232004PubMed |
Payan, P., Borelli, G., Priouzeau, F., De Pontual, H., Boeuf, G., and Mayer-Gostan, N. (2002). Otolith growth in trout Oncorhynchus mykiss: supply of Ca2+ and Sr2+ to the saccular endolymph. The Journal of Experimental Biology 205, 2687–2695.
| 1:CAS:528:DC%2BD38XnvVWjs7c%3D&md5=dfb686486dc6fb7d66d3d2aad673901cCAS | 12151374PubMed |
Pingitore, N. E. (1986). Modes of coprecipitation of Ba2+ and Sr2+ with calcite. ACS Symposium Series 323, 574–586.
| Modes of coprecipitation of Ba2+ and Sr2+ with calcite.Crossref | GoogleScholarGoogle Scholar | 1:CAS:528:DyaL2sXitFajtQ%3D%3D&md5=380fa20c3b84f888343b58d931af5f17CAS |
Poulain, C., Gillikin, D. P., Thebault, J., Munaron, J. M., Bohn, M., Robert, R., Paulet, Y.-M., and Lorrain, A. (2015). An evaluation of Mg/Ca, Sr/Ca, and Ba/Ca ratios as environmental proxies in aragonite bivalve shells. Chemical Geology 396, 42–50.
| An evaluation of Mg/Ca, Sr/Ca, and Ba/Ca ratios as environmental proxies in aragonite bivalve shells.Crossref | GoogleScholarGoogle Scholar | 1:CAS:528:DC%2BC2MXkslyqtw%3D%3D&md5=ddf11165a171891360c5510fd8485a31CAS |
Reis-Santos, P., Tanner, S. E., Elsdon, T. S., Cabral, H. N., and Gillanders, B. M. (2013). Effects of temperature, salinity and water composition on otolith elemental incorporation of Dicentrarchus labrax. Journal of Experimental Marine Biology and Ecology 446, 245–252.
| Effects of temperature, salinity and water composition on otolith elemental incorporation of Dicentrarchus labrax.Crossref | GoogleScholarGoogle Scholar | 1:CAS:528:DC%2BC3sXhtFSls7nF&md5=a27274764433310ae01a6bbb8487b50aCAS |
Schöne, B. R., Radermacher, P., Zhang, Z., and Jacob, D. E. (2013). Crystal fabrics and element impurities (Sr/Ca, Mg/Ca, and Ba/Ca) in shells of Arctica islandica: implications for paleoclimate reconstructions. Palaeogeography, Palaeoclimatology, Palaeoecology 373, 50–59.
| Crystal fabrics and element impurities (Sr/Ca, Mg/Ca, and Ba/Ca) in shells of Arctica islandica: implications for paleoclimate reconstructions.Crossref | GoogleScholarGoogle Scholar |
Shirai, K., Schöne, B. R., Miyaji, T., Radarmacher, P., Krause, R. A., and Tanabe, K. (2014). Assessment of the mechanism of elemental incorporation into bivalve shells (Arctica islandica) based on elemental distribution at the microstructural scale. Geochimica et Cosmochimica Acta 126, 307–320.
| Assessment of the mechanism of elemental incorporation into bivalve shells (Arctica islandica) based on elemental distribution at the microstructural scale.Crossref | GoogleScholarGoogle Scholar | 1:CAS:528:DC%2BC2cXps12muw%3D%3D&md5=a758282e86e77c57a44dff650ff77b27CAS |
Simkiss, K. (1965). Organic matric of oyster shell. Comparative Biochemistry and Physiology 16, 427–435.
| Organic matric of oyster shell.Crossref | GoogleScholarGoogle Scholar | 1:CAS:528:DyaF28Xjsl2msA%3D%3D&md5=bcca5b4f971368ff36fd5768c83b46c7CAS | 5881749PubMed |
Siriprom, W., Kaewkhao, J., Phachana, K., and Limsuwan, P. (2011). Crystal structure and morphology dependence of the phase of mollusc shell: a case study of XRD, SEM and ESR. In ‘2nd International Symposium on Advanced Magnetic Materials and Applications (ISAMMA 2010)’, 12–16 July 2010, Sendai, Japan. (Eds M. Takahashi, H. Saito, S. Yoshimura, K. Takanashi, M. Sahashi, and M. Tsunoda). Vol. 266, paper 012124. (IOP Publishing Ltd: Bristol.)
Tomás, J., Geffen, A. J., Millner, R. S., Pineiro, C. G., and Tserpes, G. (2006). Elemental composition of otolith growth marks in three geographically separated populations of European hake (Merluccius merluccius). Marine Biology 148, 1399–1413.
| Elemental composition of otolith growth marks in three geographically separated populations of European hake (Merluccius merluccius).Crossref | GoogleScholarGoogle Scholar |
Toole, C., Markle, D. F., and Harris, P. M. (1993). Relationships between otolith microstructure. microchemistry, and early life history events in Dover sole, Microstomus pacificus. Fish Bulletin 91, 732–753.
Tzeng, W.-N. (1996). Effects of salinity and ontogenetic movements on strontium:calcium ratios in the otoliths of the Japanese eel, Anguilla japonica Temminck and Schlegel. Journal of Experimental Marine Biology and Ecology 199, 111–122.
| Effects of salinity and ontogenetic movements on strontium:calcium ratios in the otoliths of the Japanese eel, Anguilla japonica Temminck and Schlegel.Crossref | GoogleScholarGoogle Scholar | 1:CAS:528:DyaK28XlsVWgtbs%3D&md5=7a8bf9d31ffd5d4141a652eb6967dc98CAS |
Vincent, L., and Soille, P. (1991). Watersheds in digital spaces: an efficient algorithm based on immersion simulations. IEEE Transactions on Pattern Analysis and Machine Intelligence 13, 583–598.
| Watersheds in digital spaces: an efficient algorithm based on immersion simulations.Crossref | GoogleScholarGoogle Scholar |
Weber, P. K., Hutcheon, I. D., McKeegan, K. D., and Ingram, B. L. (2002). Otolith sulfur isotope method to reconstruct salmon (Oncorhynchus tshawytscha) life history. Canadian Journal of Fisheries and Aquatic Sciences 59, 923–923.
| Otolith sulfur isotope method to reconstruct salmon (Oncorhynchus tshawytscha) life history.Crossref | GoogleScholarGoogle Scholar |
Weiner, S. (1986). Organization of extracellularly mineralized tissues: a comparative study of biological crystal growth. CRC Critical Reviews in Biochemistry 20, 365–408.
| Organization of extracellularly mineralized tissues: a comparative study of biological crystal growth.Crossref | GoogleScholarGoogle Scholar | 1:CAS:528:DyaL28XlsVyhtrs%3D&md5=0825c295c0b8989607395154cd487ef5CAS | 3524990PubMed |
Weiner, S., and Dove, P. M. (2003). An overview of biomineralization processes and the problem of the vital effect. In ‘Biomineralization’, Vol. 54. (Eds P. M. Dove, J. J. DeYoreo and S. Weiner.) pp. 1–29. (Mineralogical Society of America: Washington, DC.)
Wilt, F. H. (1999). Matrix and mineral in the sea urchin larval skeleton. Journal of Structural Biology 126, 216–226.
| Matrix and mineral in the sea urchin larval skeleton.Crossref | GoogleScholarGoogle Scholar | 1:STN:280:DyaK1Mvgt1Sjsg%3D%3D&md5=ba6da7a6d7bcb48844dad61058b553c9CAS | 10475684PubMed |
Woodcock, S. H., Grieshaber, C. A., and Walther, B. D. (2013). Dietary transfer of enriched stable isotopes to mark otoliths, fin rays, and scales. Canadian Journal of Fisheries and Aquatic Sciences 70, 1–4.
| Dietary transfer of enriched stable isotopes to mark otoliths, fin rays, and scales.Crossref | GoogleScholarGoogle Scholar | 1:CAS:528:DC%2BC3sXhslahs7k%3D&md5=a7c388de4579097bbf9306c274c0c8e6CAS |
Woodhead, J. D., Hellstrom, J., Hergt, J. M., Greig, A., and Maas, R. (2007). Isotopic and elemental imaging of geological materials by laser ablation inductively coupled plasma–mass spectrometry. Geostandards and Geoanalytical Research 31, 331–343.
| Isotopic and elemental imaging of geological materials by laser ablation inductively coupled plasma–mass spectrometry.Crossref | GoogleScholarGoogle Scholar | 1:CAS:528:DC%2BD1cXhs1Wlurs%3D&md5=85e7f6e4bc77928137bcd602d40e7faeCAS |
Yoshimura, T., Tamenori, Y., Suzuki, A., Nakashima, R., Iwasaki, N., Hasegawa, H., and Kawahata, H. (2013). Element profile and chemical environment of sulfur in a giant clam shell: insights from μ-XRF and X-ray absorption near-edge structure. Chemical Geology 352, 170–175.
| Element profile and chemical environment of sulfur in a giant clam shell: insights from μ-XRF and X-ray absorption near-edge structure.Crossref | GoogleScholarGoogle Scholar | 1:CAS:528:DC%2BC3sXhtFOkt73K&md5=1010259830ece52bf344c425c67b50a4CAS |
Zimmerman, C. E., and Nielsen, R. L. (2003). Effect of analytical conditions in wavelength dispersive electron microprobe analysis on the measurement of strontium-to-calcium (Sr/Ca) ratios in otoliths of anadromous salmonids. Fishery Bulletin 101, 712–718.