

A new tool in the toolbox for large-scale, high-throughput fisheries mark-recapture studies using genetic identification
Russell W. Bradford A B , Peta Hill A , Campbell Davies A and Peter Grewe AA CSIRO Wealth from Oceans Flagship, Marine and Atmospheric Research, GPO Box 1538, Hobart, Tas. 7001, Australia.
B Corresponding author. Email: russ.bradford@csiro.au
Marine and Freshwater Research 67(8) 1081-1089 https://doi.org/10.1071/MF14423
Submitted: 23 December 2014 Accepted: 13 April 2015 Published: 16 September 2015
Journal Compilation © CSIRO Publishing 2016 Open Access CC BY-NC-ND
Abstract
The lack of independently verifiable estimates of catches and fisheries independent estimates of abundance and fishing mortality are major sources of uncertainty in the management of many fisheries. DNA profiling provides the potential to substantially improve the quality of data for assessments and act as an additional deterrent to illegal, unreported, and unregulated (IUU) fishing. Barriers to the implementation of this technology include cost of sample collection and processing, forensic grade quality control, and the ability to apply undetectable tags. We present the results of a comparison of two current and one new (gene tag tool, GTT) sampling techniques, using the highly valued southern bluefin tuna as an example. We demonstrate that fish sampled with two techniques are highly unlikely to be recognised as ‘tagged’, whereas one technique was easily recognisable after 73 days. The GTT reduced handling before DNA extraction, whereas both other techniques require additional labour, adding to cost and potential contamination of the evidentiary chain. Evidence of cross-contamination in the Whatman FTA Elute samples suggests they may not be as suitable for at-sea field applications. Two of the three sampling techniques are capable of obtaining high quality tissue samples for stock assessment and chain of custody purposes in a cost-effective and unidentifiable manner.
Additional keywords: biopsy, fishery-independent, genetic tag, mark-recapture.
Introduction
The lack of independently verifiable estimates of catches, abundance and fishing mortality are major sources of uncertainty in the assessment and management of many fisheries, particularly those that are not amenable to traditional ground fish survey methods. These fisheries generally rely on fishery-dependent data sources, such as catch-per-unit-effort (CPUE) as the main index of abundance and size or age data from catch composition records (Hilborn and Walters 1992). Mark–recapture programs, used in conjunction with CPUE analysis, can provide additional information on rates of fishing and natural mortality and year class strength (Polacheck et al. 2006) thereby reducing some uncertainty. Several fish marking techniques have been developed, with each technique having particular advantages and disadvantages (see, e.g. McKenzie et al. 2012). However, many mark–recapture programs rely on the participation of fishers and processors to report and return tag–recaptures, and therefore, are fishery-dependent. The fishery-dependent nature of most recovery programs means that additional parameters (e.g. recapture and reporting rates) need to be estimated through tag seeding experiments and observer programs (Hearn et al. 1999; Pollock et al. 2001; Hearn et al. 2008; Carruthers and McAllister 2010). Careful consideration of the sources of bias is required during the design phase of any large-scale tagging program as they can represent a substantial proportion of the total cost of a well designed program and, as importantly, completely undermine the utility of the results if not accounted for appropriately. Hence the development of a tagging technique that is permanent (i.e. no tag loss), does not require reporting or returning of tags directly from the fishery and is cost-effective relative to current techniques would be a major step forward in fisheries independent monitoring.
Physical tags often violate two criteria essential for a truly fishery-independent tag: (i) they are visible to the fishery and (ii) they present a foreign body that is often unacceptable to both the fishery and consuming public. Genetic profiling, or gene tagging, has been considered a potential fishery-independent alternative to conventional tagging for many years; however, the high set-up and ongoing costs of gene tagging have meant that there has not been widespread development of this approach for fisheries assessment (Nguyen et al. 2006), except in a few high value and unusual applications (Graves and McDowell 2003; Beacham et al. 2008). Although costs in the past have been prohibitively high, recent developments in robotics and genotyping procedures have substantially reduced the costs associated with gene tagging (Bert et al. 2002; Ogden et al. 2009; Eggen 2012). These advances have opened the potential for studies at the level required for the management of large-scale fisheries using genetic tags. Efficiency gains in the remaining bottlenecks of high through put tissue sampling and tracking logistics will further reduce the operating costs.
The aim of this study was to benchmark the collection of a biopsy using the purpose-built tissue biopsy tool, the gene tag tool (GTT), with two existing techniques for collecting samples for individual-based DNA profiling. The performance of each sampling technique was examined with respect to suitability for use in large-scale tagging programs in terms of: ease of use in field conditions, long-term DNA archive capacity, quality and quantity of DNA extracted, potential for cross-contamination and extent of manual handling for tissue samples required before pre-DNA extraction. Specifically we compared the performance of the GTT, with that of FTA (Flinders Technical Association) Elute cards, and fin clipping. Initial trials involved a laboratory comparison of the GTT and FTA technology as a part of initial trials of the GTT. Operational field trials were then conducted to compare wound healing and visual detection of ‘tagged’ fish in a commercial processing environment following biopsies taken using the GTT, FTA card and fin clipping.
Methods
Statement on animal ethics
The procedures used in this study were approved by an independent Animal Ethics Committee under permit AEC 26/2011–12 (Department of Primary Industries, Parks, Water and Environment, Tasmania, Australia).
Description of the gene tag tool biopsy tip
Fig. 1 details the GTT biopsy tip. The GTT tip consists of a sample collection end terminating in a sharp point to facilitate penetration of scale and skin. The cutting edge of the sample end faces backwards, allowing the tip to be cleaned on entry before taking a tissue sample on exit. The non-sample end has a positive locking mechanism to secure the tip to the handle. Midway between the sampling and locking ends is an annulus which prevents the tip being inserted too deeply, reduces the chance of tissue adhering to the handle (reducing potential for cross-contamination), and ensuring the tip sits upright inside the sealed epindorf tube on ejection.
|
Laboratory trials: tissue sampling for DNA extraction
In preliminary laboratory trials, designed to highlight any major issues with the sampling methods, GTT and FTA Elute (GE Healthcare Life Sciences, Sydney, NSW, Australia) samples were taken from three southern bluefin tuna (SBT, Thunnus maccoyii) obtained from the Port Lincoln tuna farms operating out of the Spencer Gulf, South Australia. Two of the fish were actively rubbed together to simulate potential cross-contamination processes akin to at-sea sampling conditions; the other was kept separate. A ‘control’ muscle biopsy was collected from each fish before using the GTT and FTA Elute card, to be used as the ‘standard’ muscle biopsy technique against which the other methods were compared. No fin clips were collected as part of the laboratory trials.
For each of the three fish, using the GTT we sampled the dorsal musculature at the base of the second dorsal fin (traditionally where conventional tags have been applied), and at a site as close to the tail as possible to simulate taking a sample from tail stock of a processed fish. Fish 1 (uncontaminated) was also sampled close to the site of the head plug where the nervous system of sashimi grade fish is destroyed by Ike Jime at time of harvest. The collected samples were deposited into a pre-weighed 1.7-mL microcentrifuge tube, immediately weighed and then placed into a freezer block. All samples were subsequently frozen (–20°C) for ~1 month before DNA extraction.
A second set of samples were collected using FTA Elute cards from the same locations as those sampled using the tool. The FTA card was dabbed on the skin of the dorsal surface of Fish 1 to ensure we would obtain a ‘clean’ sample. Subsequent samples were collected from the dorsal musculature of all three fish after simulating at-sea tagging conditions and from the cut at the base of the caudal peduncle where the tail had been removed at the time of harvest. The FTA cards were dried at room temperature then stored at room temperature for ~1 month before DNA extraction.
Field trials: visible or detectable damage resulting from tissue sample collection
In July 2012, 19 live SBT were captured from a commercial grow-out cage in Port Lincoln, South Australia, using a handline and barbless hook. The grow-out cage held an estimated 680 fish. Each fish was removed from the water to a padded cradle and photographed before any further intervention. Total length (TL) was then recorded and three tissue samples taken: one from the dorsal musculature next to the second dorsal fin using the GTT, a fin clip from the dorsal tip of the caudal fin, and a sample of the slime coating or blood using a FTA card. An orange conventional dart tag (Hallprint Pty Ltd: www.hallprint.com, accessed 29 June 2015) was inserted into the dorsal musculature on the side opposite to where the tissue sample was taken using the GTT for subsequent identification. Following a second set of photographs, the fish was immediately returned to the grow-out cage with no further intervention until commercial harvest 73 days later. Both the GTT and fin clip samples were immediately placed on ice and transported to a land-based facility within 4 h where they were immediately frozen before being transported to the laboratory facility in Hobart, Tasmania. The FTA cards were dried face open before the cards were closed ready for transport.
In September 2012 (73 days post-initial biopsy), all fish from the grow-out cage were transported to a land-based processing facility and examined for the presence of a conventional tag. Only 12 of the original 19 fish were found. Fish with tags were further examined for evidence of visible wound damage resulting from the fin clip and tissue biopsy. Where possible, photographs from the initial tagging procedure were compared to fish at the time of harvest.
DNA extraction and analysis
Sub-sampling of tissue collected using the GTT was not required before DNA extraction. FTA cards, however, were sub-sampled by folding them in half so the two tissue surfaces were sandwiched and facing each other. Two discs were then simultaneously punched out using a Harris Uni-Core (3 mm, GE Healthcare Life Sciences) and placed into a 1.7-mL microcentrifuge tube for extraction. A clean sheet of Whatman filter paper was punched between samples to minimise possible contamination between sub-samples. Approximately 10 mg of tissue was sub-sampled from each fin clip and transferred into a 1.7-mL microcentrifuge tube for extraction.
DNA extractions for all samples were performed using a Qiagen DNA easy tissue extraction kit (QIAGEN Inc., Valencia, CA) following the manufacturer’s protocols. Final elution volumes were 200 µL and the quantity and quality of DNA was determined using an ND-1000 NanoDrop Spectrophotometer (NanoDrop Technologies, Wilmington, DE, USA). Each DNA sample from the GTT, fin clip and control muscle biopsies were further diluted at the rate of 4 µL into 100 µL using distilled water supplied as part of the Qiagen Master Mix Kit used for Polymerase Chain Reaction (PCR). DNA extracts from FTA cards were left undiluted.
Each sample was analysed using a suite of DNA microsatellite loci developed for DNA profiling of SBT (Bravington et al. 2014). Approximately 4 µL of DNA extract was used as template for PCR. A total of 25 DNA microsatellite loci in four separate locus multiplex panels were amplified in a total reaction volume of 12.5 µL (Bravington et al. 2014). All amplifications were carried out on an Eppendorf Mastercycler EP gradient Silver Block thermal cycler (Eppendorf, Germany). DNA fragment profiles were produced following separation on an ABI 3130xL Genetic Analyser against GeneScan Liz 500 and 600 size markers. Individual genotypes were determined using GeneMapper 4.0 software (Life Technologies).
Following DNA extraction a small amount of tissue remained on the GTT; the GTT samples and fin clips were subsequently re-frozen and held at –30°C. After ~3 weeks a second DNA extraction and analysis was performed on the GTT samples using the same protocols described above to validate the suitability of this sampling technique for providing archival tissue.
Results
Laboratory trials: tissue sampling for DNA extraction
The GTT tip collected consistent amounts of tissue (n = 11, 14.3 ± 1.2 mg, mean ± s.e.). This was of a similar mass to the amount of tissue sub-sampled (between 8 and 15 mg) from a typical 200-mg tail stock control biopsy taken for routine DNA extractions in our Hobart laboratory facility. Calculating a direct quantity estimate was not possible for the amount of tissue (mucous) as collected by FTA Elute cards.
Both the GTT and FTA cards collected genetic biopsies suitable for determining DNA profiles as compared to results obtained from control DNAs using our standard DNA extraction and microsatellite DNA profiling analysis protocols. Both approaches took a similar amount of time to obtain a biopsy. However, FTA cards required an extra 1–2 h step to completely dry cards face open in a heated space (e.g. engine room) but required no further processing before storage and transport. GTT tips were placed on ice and immediately frozen upon arrival at a land-based facility and required careful packaging to keep them frozen for transport. Overall, once the biopsy had been obtained, the GTT tips took less time to prepare but required more costly transport from the tagging site to the laboratory than FTA cards.
DNA extraction and analysis
DNA profile comparisons between the GTT, fin clip and FTA biopsy approaches were assessed by two criteria: (i) delivery of complete DNA profiles and (ii) presence of DNA cross-contamination from multiple individuals contributing to a biopsy at time of sampling. The amount of DNA extracted was 40.3, 79.8 and 11.7 ng μL–1 for the GTT, fin clip and FTA card respectively. The amount of DNA obtained from the second extraction of the GTT biopsy was approximately half that recovered from the original extraction.
As expected, all three techniques delivered DNA of sufficient concentration and quality to give full DNA profiles (25 microsatellite loci) for all 19 fish sampled during the field trials. Identical DNA profiles were obtained for each of these fish from the GTT and fin clip sampling protocols.
DNA cross-contamination was apparent in some of the DNA profile results from the GTT and FTA card techniques (Fig. 2). However, for the GTT biopsies, cross contamination was restricted to samples taken from the head wound area where the hind-brain had been cored at time of harvest (Fish 1, initial laboratory trials). In contrast, most of the FTA card biopsies from the field trials (>60%) exhibited some degree of cross-contamination (i.e. unexpected contaminant allele peaks). Tissue biopsies collected in the laboratory trials using FTA cards were obtained from cleanly exposed internal muscle tissue in tail stock cross-sections and showed no cross-contamination.

|
Field trials: visible or detectable damage resulting from tissue sample collection
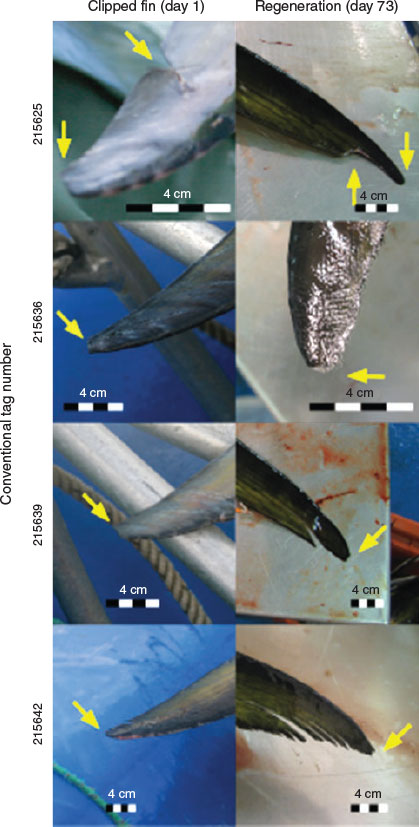
The average length (TL) of the fish tagged was 110.7 cm (standard deviation 10.7 cm), representing a fish of ~3–4 years of age. The collection of a tissue biopsy using the GTT resulted in a puncture wound ~5 mm in diameter (Fig. 3a, b). For some of the puncture wounds a small amount of bleeding was observed, which is consistent with the application of conventional dart tags (R. Bradford, pers. comm.). Obtaining a sample using FTA cards resulted in some visible removal of the slime coating of the fish (Fig. 3c, d) although this damage was expected to be repaired within a few hours after the fish was returned to the water. No physical marking such as scratching or removal of scales was evident immediately after FTA card biopsies were taken. Clipping the upper lobe of the caudal fin resulted in an obvious visible straight edge as compared to the rounded lobe that is characteristic of a normal caudal fin observed in the wild (Fig. 4). Both GTT biopsy and caudal fin clipping left immediately obvious identifiable marks.

|
|
Only 12 of the original 19 tagged fish (63%) were recovered in the processing facility. There was a negligible increase in length (mean 0.55 cm; s.d. 0.25 cm) during the period between the initial intervention and harvest. Examination of the 12 tagged fish showed varying degrees of repair from the initial trauma associated with the fin clipping, GTT biopsy, and FTA card sampling. Fin clipping tended to leave a recognisable mark in the form of a relatively straight edge as opposed to the normal rounded tip of the caudal fin (Fig. 4). As expected, the site of FTA card sampling was unrecognisable on the harvested fish. The trauma wound created by the GTT had healed with little sign of lasting physical damage or complication. Under the factory processing conditions of the trial, the GTT biopsied fish would have been difficult, if not impossible, to identify based on a recognisable mark resulting from the initial biopsy without the aid of a conventional dart tag. A small mark was evident on some fish but overall in the opinion of the authors, observations on a representative group of before and after comparisons indicate a minimal, almost undetectable, degree of residual trauma wound resulting from the GTT after 73 days at liberty (Fig. 5) (see Fig. S1 of the Supplementary material for all images).

|
Discussion
Current mark–recapture programs are able to call upon a variety of tag types and techniques ranging from the simple and inexpensive conventional dart tag through to the more technologically complex PIT, coded wire, and genetic tags. Each technique has its own advantages and disadvantages (Table 1) depending on the questions being posed, with most data collection being either partially or wholly fishery-dependent. Gene tagging represents a fully fishery-independent approach and as such is a more desirable technique from which to provide unbiased parameter estimates for stock assessment and management advice.

|
Recent advances in DNA extraction and robotics have greatly reduced the cost of routine laboratory analyses for DNA extraction, yet, significant hurdles remain. Specifically, there remains a need to increase sampling rate and reduce handling time while collecting tissue samples, reduce the high cost (both time and financial) associated with sub-sampling tissue biopsies, minimise visible wounding associated with biopsy collection, and provide a means to ensure a legally defensible mechanism to trace samples from point of collection through to archive (i.e. chain of evidence). This paper describes a new tool for the collection of tissue biopsies that addresses these remaining hurdles to making gene tagging the mark–recapture method a cost-effective option for large-scale programs where previously it had not.
There are many examples in the biomedical field of tools to obtain a tissue biopsy, with most aimed at human medicine. However, there were a few biopsy tools for the livestock trade. For example Kuhne et al. (2005) describe two tools (Typifix, Agrobiogen GmbH, Thalmannsdorf, Germany; and FlexoPLUS Geno, Caisley, Bocholt, Germany) to apply a cattle ear tag while taking a tissue sample. Through direct experience in the collection and processing of tissue samples for a large-scale close-kin mark–recapture study for SBT (Bravington et al. 2014), it was evident that large cost savings and improvements in data management and security could be made through the design of a more efficient and secure sampling tool. Furthermore, international import restrictions, poor return rates and lack of reporting rate estimates for previous conventional tagging programs meant that genetic mark–recapture was one of the few potential options for estimating population parameters for the SBT stock (Davies et al. 2007, 2008; Harley et al. 2008).
Prior to developing the GTT we examined many of these tools against several critical criteria for large-scale sampling under at-sea conditions. The primary criteria were: (i) ease of use; (ii) speed of sample collection; (iii) post-biopsy sample handling to secure the tissue for transport and sub-sampling (if required); and (iv) compatibility with downstream high-throughput robotics. Of the tools we examined, none were able to satisfy all four critical criteria and were not considered suitable for large-scale, high through-put fisheries genomic applications, hence the need to develop this new tool.
Collecting tissue samples for gene tagging, while minimising cross-contamination between samples, requires additional handling to ensure the collected tissue is securely stored with the DNA stabilised and prepared for subsequent sub-sampling before laboratory analyses. Sampling rates using FTA cards and the GTT biopsy tip were comparable to those of applying a conventional dart tag. Although samples collected with FTA card were immediately stabilised within the card’s cellulose matrix they still required an additional step of drying before storage for transport. However, once dried, FTA cards can provide a validated DNA archive that could be stored at room temperature for an extended period of time (Smith and Burgyone 2004; Nagy 2010; Anon. 2011). Using the GTT the amount of biological material collected required no sub-sampling before performing a DNA extraction (~1.5 h on a robotic workstation to perform 96 extractions). For the GTT, sufficient DNA was extracted without full tissue digestion; the remaining tissue was sufficient to supply an archive sample.
Eliminating the need to sub-sample collected biopsies reduces both handling times and labour costs associated with gene tagging. Of the techniques examined in the current study, only the GTT eliminated the biopsy sub-sampling component. Although FTA cards required a sub-sampling step they did present a reduction in time (i.e. initial biopsy extraction) to produce a DNA template for use in downstream profiling. However, the GTT had the added advantage of providing a higher concentration of DNA in a process that could be fully automated, thereby eliminating further manual handling of the initial biopsy. Removing manual steps has further important ramifications in helping to reduce human error that could occur in the chain of steps (chain of evidence) from taking a biopsy to producing the DNA profile.
Tissue sampling for gene tagging often requires the removal or damage of a body part, such as the removal of a whole fin or part thereof, which can leave visible marks and potentially identify the fish as having been tagged. Such visible marks invalidate one of the primary criteria of a fishery-independent marker. In the present study clipping the caudal fin of SBT in most cases left a visible mark that lasted the 73 days to harvest of the fish. FTA cards initially produced a visible mark when collecting mucous; however, this mark was certainly not visible during harvest of the fish 73 days later. The GTT biopsy tip produced a visible puncture wound at sampling. However, that mark was indistinguishable from natural marks observed at subsequent harvest. We were unable to examine fish between the initial tagging and harvest dates, therefore we could not estimate when the wound healed sufficiently to be indistinguishable from natural marks, but due to the level of healing it was estimated to have occurred well before the harvest date (i.e. within 3 weeks of biopsy).
The time required for healing is important when considering suitability for a mark–recapture program. For most fishery assessments using tagged fish a minimum 2–3-month mixing period is assumed. This would indicate that genetically tagged fish using the GTT would be functionally ‘invisible’ to the fishery after that time frame. However, this criterion is not always met. For example since 1990 ~144 000 conventional dart tags have been released into the Australian SBT fishery; of these ~8% (~1500) of all recaptures (~18 700) were within the period when mixing was assumed to be occurring (P. Eveson, pers. comm.), and subsequently excluded from most analyses. Although further research is required to confirm the rate of healing for SBT, within the marine environment recovery from muscle damage has been reported to be rapid with complete regeneration of muscle tissue observed to occur within 10–15 days (Thorsteinsson 2002; Ward 2003; Fontenot and Neiffer 2004; Eriksen et al. 2011), well within the allowance for mixing to occur.
These same techniques potentially have application to chain of custody systems, in the case of market related fishery certifications, or Catch Documentation Schemes (CDS) aimed at verifying reported catch rates and eliminating IUU catches (Ogden et al. 2009; Glover 2010; Stokstad 2010; Fleming 2011). For example, regional fisheries management organisations, such as the Commission for the Conservation of Southern Bluefin Tuna (CCSBT), have implemented a CDS for high value sashimi tuna that require every fish to be labelled with a tag and reported to the national fisheries agency and the CCSBT secretariat as part of reconciling national quota allocations. In the absence of a mechanism to establish the chain of custody from the vessel to landing and sale there is considerable scope for non-reporting of catches (ISOFISH 1998; Smith and McVeagh 2000; Polacheck and Davies 2008). The routine implementation of an appropriately designed genetic tagging program has the potential to provide an independent source of data to monitor and verify catches, as well as potentially provide valuable data streams for stock assessment purposes.
Efficiency gains in stabilisation and shipment at room temperature of the tissue in the GTT biopsy tip could be accomplished using ‘RNAlater’ (AMBION Inc., Austin, TX, USA) or ‘DNAgard’ (Biomatrica Inc., San Diego, CA, USA). These reagents increase the individual unit sampling costs, but reduce the shipping logistics. In addition, the long-term security of the samples to a similar level as provided by FTA cards can be accomplished if the samples are frozen (Nagy 2010). Alternative solutions are under investigation to further reduce the cost of stabilisation of the tissue in the GTT tip.
The GTT was developed and built by CSIRO based on the experience of the authors with large-scale tagging programs using conventional spaghetti tags and large-scale tissue collection and genotyping for a close-kin mark–recapture study (~14 000 individuals) for the SBT fishery. Over a season spanning several months 10–20 000 SBT would be brought onboard, measured and double tagged before being released back into the water; per fish, the entire operation required ~30 s to complete. A ‘new’ tagging technique would have to emulate the ease and speed of conventional tagging without substantially increasing the cost per tag. The GTT was able to fulfil these criteria. In a similar fashion to conventional tagging, the GTT requires only one hand to collect a biopsy; leaving the other hand free to maintain control of the fish while on the cradle. The disposable tip would cost <AU$0.10 using a commercial injection mould process. DNA extraction and analyses are an additional cost; however, cost savings resulting from a reduction in the number of tags required for gene tagging and the elimination of rewards and the need to estimate reporting and tag loss rates associated with conventional tagging programs reduces the cost per ‘return’ to approach that of a conventional tag (Preece et al. 2013). The combination of the self-cleaning nature of the tip and the annulus greatly reduced the incidence of cross-contamination between samples.
In conclusion, the GTT, FTA card technology, and fin clipping provide sampling techniques to deliver high throughput approaches for the collection of large quantities of high quality genomic DNA for DNA profiling. However, fin clipping was unsuitable as a fishery-independent tagging method due to the ability to identify fin-clipped fish. For FTA card, their susceptibility to water damage before biopsy and the need for a drying stage may make this approach impractical in the damp environment of large, at-sea tagging programs. Furthermore, FTA required an additional sub-sampling step before DNA extraction, which required further time and labour and added another link with the potential for incurring cross-contamination in DNA. FTA biopsied fish recovered more rapidly (presumably within hours to a few days) whereas GTT biopsy tip wounds required a longer period before the small trauma wound healed and made them indistinguishable from un-sampled fish. The GTT, when used on undamaged tissue, provided a biopsy with no DNA cross-contamination whereas the FTA was unable to provide this level of security unless biopsies were taken from cleanly exposed internal tissue. Given this we conclude that the GTT with its single-use, self-cleaning biopsy tip offers a better alternative for sampling in terms of field convenience, cost reduction, and minimising potential for contamination when used in the context of large-scale genetic tagging programs or in the context of at-sea and in-port catch sampling programs. Application of the GTT for DNA profiling has great potential to enhance fisheries independent monitoring and assessment of tunas and other high value finfish species where programs require several thousands of individuals to be tagged.
Acknowledgements
The authors express their appreciation for the support provided by the Australian Southern Bluefin Tuna Industry Association; to Tony’s Tuna International Pty Ltd, and Andrew Wilkinson in particular, for allowing us to perform field trials on commercial fish, the use of their processing facility, and for their enthusiastic support of the project. Matt Lansdell (CSIRO) provided invaluable field support. Tony Jones and Adam Kemp (Protec Marine) provided additional logistical support in Port Lincoln. Paige Eveson (CSIRO) provided data related to days at liberty for conventionally tagged SBT since 1990. The positive control tissue samples (TC2005 and TC2205, male and female reproductive tissue respectively) used for this study were collected by Thor Carter fishing in waters near southern NSW, Australia. The authors thank Levente Bodrossy, Anne Preece and several anonymous referees for their insightful reviews of the manuscript.
References
Anon. (2011). ‘Your Forensic Samples, Our Experience.’ (General Electric Healthcare, General Electric Company: Little Chalfont, UK.)Beacham, T. D., Wetklo, M., Wallace, C., Olsen, J. B., Flannery, B. G., Wenburg, J. K., Templin, W. D., Antonovich, A., and Seeb, L. W. (2008). The application of microsatellites for stock identification of Yukon River Chinook salmon. North American Journal of Fisheries Management 28, 283–295.
| The application of microsatellites for stock identification of Yukon River Chinook salmon.Crossref | GoogleScholarGoogle Scholar |
Bert, T. M., Tringali, M. D., and Seyoum, S. (2002). Chapter 3: Development and application of genetic tags for ecological aquaculture. In ‘Ecological Aquaculture: The Evolution of the Blue Revolution’. (Ed. B.A. Costa-Pierce.) pp. 47–76. (Blackwell Publishing Ltd: Melbourne.)
Bravington, M., Grewe, P., and Davies, C. (2014). Fishery-independent estimate of spawning biomass of southern bluefin tuna through identification of close-kin using genetic markers. FRDC Report 2007/034, Hobart, Tas., Australia.
Carruthers, T. R., and McAllister, M. K. (2010). Quantifying tag reporting rates for Atlantic tuna fleets using coincidental tag returns. Aquatic Living Resources 23, 343–352.
| Quantifying tag reporting rates for Atlantic tuna fleets using coincidental tag returns.Crossref | GoogleScholarGoogle Scholar |
Davies, C., Preece, A., and Basson, M. (2007). A review of the Southern Bluefin Tuna Commission’s Scientific Research Program and considerations of current priorities and way forward. In ‘12th Meeting of the Extended Scientific Committee’, 4–8 September and 10–14 September 2007, Hobart, Tas., Australia. CCSBT-ESC/0709/16. (CSIRO Oceans & Atmosphere Flagship: Hobart.)
Davies, C., Moore, A., Grewe, P., Bradford, R., and Basson, M. (2008). Report on the potential and feasibility of genetic tagging of SBT. In ‘13th Meeting of the Extended Scientific Committee’, 8–12 September 2008, Rotorua, New Zealand. CCSBT-ESC/0809/14. (CSIRO Oceans & Atmosphere Flagship: Hobart, Tas., Australia.)
Eggen, A. (2012). The development and application of genomic selection as a new breeding paradigm. Animal frontiers 2, 10–15.
| The development and application of genomic selection as a new breeding paradigm.Crossref | GoogleScholarGoogle Scholar |
Eriksen, T. B., Fraser, T., Gregersen, H., Kristiansen, M., Olufsen, M., Rajan, B., Ramirez, R., Raungsri, J., Ron, O., and Sarmiento, M. G. (2011). Should fin clipping be used as a method for identification of fish? Available at http://norecopa.no/student-essays [Verified 24 June 2015].
Fleming, N. (2011). DNA chip test will track down illegal fish. Available at http://www.newscientist.com/article/mg21028125.100-dna-chip-test-will-track-down-illegal-fish.html#.VYnvWEa0Lfc [Verified 24 June 2015].
Fontenot, D. K., and Neiffer, D. L. (2004). Wound management in teleosts fish: biology of the healing process, evaluation, and treatment. The Veterinary Clinics Exotic Animal Practice 7, 57–86.
| Wound management in teleosts fish: biology of the healing process, evaluation, and treatment.Crossref | GoogleScholarGoogle Scholar |
Glover, K. A. (2010). Forensic identification of fish farm escapees: the Norwegian experience. Aquaculture Environment Interactions 1, 1–10.
| Forensic identification of fish farm escapees: the Norwegian experience.Crossref | GoogleScholarGoogle Scholar |
Graves, J. E., and McDowell, J. R. (2003). Stock structure of the world’s istiophorid billfishes: a genetic perspective. Marine and Freshwater Research 54, 287–298.
| Stock structure of the world’s istiophorid billfishes: a genetic perspective.Crossref | GoogleScholarGoogle Scholar |
Harley, S., Bradford, R., and Davies, C. (2008). Using passive integrated transponder (PIT) technology to improve performance of CCSBT’s conventional tagging programme. In ‘CCSBT 5th Management Procedure Workshop/13th Meeting of the Extended Scientific Committee’, 2–7 September and 8–12 September 2008, Rotorua, New Zealand. CCSBT-ESC/0809/14. (CSIRO Oceans & Atmosphere Flagship: Hobart, Tas., Australia.)
Hearn, W. S., Polacheck, T., Pollock, K. H., and Whitelaw, W. (1999). Estimation of tag reporting rates in age-structured multicomponent fisheries where one component has observers. Canadian Journal of Fisheries and Aquatic Sciences 56, 1255–1265.
| Estimation of tag reporting rates in age-structured multicomponent fisheries where one component has observers.Crossref | GoogleScholarGoogle Scholar |
Hearn, W., Polacheck, T., and Stanley, C. (2008). Estimates of reporting rate from the Australian surface fishery based on previous tag seeding experiments and tag seeding activities in 2007/2008. In ‘CCSBT 5th Management Procedure Workshop/13th Meeting of the Extended Scientific Committee’, 2–7 September and 8–12 September 2008, Rotorua, New Zealand. CCSBT-ESC/0809/21. (CSIRO Oceans & Atmosphere Flagship: Hobart, Tas., Australia.)
Hilborn, R., and Walters, C. J. (1992). ‘Quantitative Fisheries Stock Assessment and Management: Choices, Dynamics and Uncertainty.’ (Chapman and Hall: New York.)
ISOFISH (1998) The involvement of Mauritius in the trade in Patagonian toothfish from illegal and unregulated longline fishing in the Southern Ocean and what might be done about it. ISOFISH Occasional Report 1, 3rd edn, Hobart, Australia.
Kuhne, S., Schroeder, C., Holmquist, G., Wolf, G., Horner, S., Brem, G., and Ballagi, A. (2005). Detection of bovine viral diarrhoea virus infected cattle – testing tissue samples derived from ear tagging using an Erns capture ELISA. Journal of Veterinary Medicine B 52, 272–277.
| Detection of bovine viral diarrhoea virus infected cattle – testing tissue samples derived from ear tagging using an Erns capture ELISA.Crossref | GoogleScholarGoogle Scholar | 1:STN:280:DC%2BD2Mrktlygtw%3D%3D&md5=351cacebbe8bc467e1021420228b9336CAS |
McKenzie, J. R., Parsons, B., Seitz, A. C., Kopf, R. K., Mesa, M., and Phelps, Q. (Eds) (2012). ‘American Fisheries Society Symposium 76. Proceedings of the Symposium Advances in Fish Tagging & Marking Technology’, 24–28 February 2008, Auckland, New Zealand. (American Fisheries Society: Bethesda, MD, USA.)
Nagy, Z. T. (2010). A hands-on overview of tissue preservation methods for molecular genetic analyses. Organisms, Diversity & Evolution 10, 91–105.
| A hands-on overview of tissue preservation methods for molecular genetic analyses.Crossref | GoogleScholarGoogle Scholar |
Nguyen, N. H., Ponniah, A. G., and Ponzoni, R. W. (2006). Potential applications of reproductive and molecular genetic technologies in the selective breeding of aquaculture species. In ‘Development of Aquatic Animal Genetic Improvement and Dissemination Programs: Current Status and Action Plans. World Fish Centre Conference Proceedings 73’, 21–22 September 2005, Penang, Malaysia. (Eds R. W. Ponzoni, B. O. Acosta, and A. G. Ponniah.) pp. 15–21. (WorldFish: Penang, Malaysia.)
Ogden, R., Dawnay, N., and McEwing, R. (2009). Wildlife DNA forensics – bridging the gap between conservation genetics and law enforcement. Endangered Species Research 9, 179–195.
| Wildlife DNA forensics – bridging the gap between conservation genetics and law enforcement.Crossref | GoogleScholarGoogle Scholar |
Polacheck, T., and Davies, C. (2008). Considerations of implications of large unreported catches of southern bluefin tuna for assessments of tropical tunas, and the need for independent verification of catch and effort statistics. CSIRO Marine and Atmospheric Research Paper 23, Hobart, Australia.
Polacheck, T., Eveson, J. P., Laslett, G. M., Pollock, K. H., and Hearn, W. S. (2006). Integrating catch-at-age and multiyear tagging data: a combined Brownie and Petersen estimation approach in a fishery context. Canadian Journal of Fisheries and Aquatic Sciences 63, 534–548.
| Integrating catch-at-age and multiyear tagging data: a combined Brownie and Petersen estimation approach in a fishery context.Crossref | GoogleScholarGoogle Scholar |
Pollock, K. H., Hoenig, J. M., Hearn, W. S., and Caligaert, B. (2001). Tag reporting rate estimation: 1. An evaluation of the high-reward tagging method. North American Journal of Fisheries Management 21, 521–532.
| Tag reporting rate estimation: 1. An evaluation of the high-reward tagging method.Crossref | GoogleScholarGoogle Scholar |
Preece, A., Davies, C., Bravington, M., Hillary, R., Eveson, P., and Grewe, P. (2013). Preliminary cost and precision estimates of sampling designs for gene tagging for SBT. CCSBT-ESC/1309/18. Commission for the Conservation of Southern Bluefin Tuna.
Smith, L. M., and Burgyone, L. A. (2004). Collecting, archiving and processing DNA from wildlife samples using FTA databasing paper. BMC Ecology 4, 4–11.
| Collecting, archiving and processing DNA from wildlife samples using FTA databasing paper.Crossref | GoogleScholarGoogle Scholar | 1:STN:280:DC%2BD2czpvFaksQ%3D%3D&md5=04a7b9d602da4d9265e3f3f628500399CAS | 15072582PubMed |
Smith, P., and McVeagh, M. (2000). Allozyme and microsatellite DNA markers of toothfish population structure in the Southern Ocean. Journal of Fish Biology 57, 72–83.
| Allozyme and microsatellite DNA markers of toothfish population structure in the Southern Ocean.Crossref | GoogleScholarGoogle Scholar | 1:CAS:528:DC%2BD3cXot1ylt78%3D&md5=59acb6b1ad714814085d17e8572c9d56CAS |
Stokstad, E. (2010). News focus: to fight illegal fishing, forensic DNA gets local. (American Association for the Advancement of Science: Washington, DC, USA.) Available at www.sciencemag.org./10.1126/science.330.6010.1468 [Verified 18 June 2012].
Thorsteinsson, V. (2002). Tagging methods for stock assessment and research in fisheries, report of Concerted Action FAIR CT.96.1394 (CATAG). Marine Research Institute Technical Report 79, Reykjavik.
Ward, D. L. (2003). Effects of marking techniques and handling on swimming ability of bonytail chub. Journal of the Arizona-Nevada Academy of Science 36, 34–36.