

Age, growth and genetic status of the white shark (Carcharodon carcharias) from Kashima-nada, Japan
S. Tanaka A D , T. Kitamura B , T. Mochizuki C and K. Kofuji CA School of Marine Science and Technology, Tokai University, 3-20-1 Orido, Shimizu, Shizuoka 424-8610, Japan.
B Environmental Science Laboratory, Japan NUS Co., 1-1 Fukuura, Kanazawa, Yokohama 236-0004, Japan.
C Ibaraki Prefectural Oarai Aquarium, 8252-3 Isohama-machi, Oarai, Higashi-Ibaraki 311-1301, Japan.
D Corresponding author. Email: sho@scc.u-tokai.ac.jp
Marine and Freshwater Research 62(6) 548-556 https://doi.org/10.1071/MF10130
Submitted: 8 June 2010 Accepted: 6 January 2011 Published: 24 June 2011
Journal Compilation © CSIRO Publishing 2011 Open Access CC BY-NC-ND
Abstract
The white shark, a top predator inhabiting the world’s oceans, is an endangered species. However, knowledge of its life-history traits and population structure is still limited. We hypothesised that life-history traits would vary among populations because the species’ various habitats are diverse and change through time. Age was estimated by counting growth bands in the centra of white sharks caught in Japan. The von Bertalanffy growth parameters were estimated at L∞ = 455 cm TL, k = 0.196 year–1 and t0 = –1.92 years for males and L∞ = 607 cm TL, k = 0.159 year–1 and t0 = –1.80 years for females. The growth rate to maturity was higher than that known for individuals from California and South Africa. Male sharks matured at 310 cm TL at 4 years of age and females began to mature at ~450 cm TL and 7 years. The D-loop-region sequences of mitochondrial DNA extracted from Japanese white sharks and GenBank datasets from sharks of California, Australia, New Zealand and South Africa indicate that Japanese white sharks form a monophyletic clade separate from the populations of other regions. The results suggest that unique life-history traits of Japanese white sharks may be caused by genetic differences.
Additional keywords: growth rate, maturity, corpus calcaeum, population, white shark.
Introduction
The white shark, Carcharodon carcharias, is one of the top predators of coastal and offshore regions, being found mainly in subtropical waters to cold-temperate areas of the world. It is known to grow to ~6 m in total length and has been known to attack humans. The species is listed in CITES Appendix II (http://www.cites.org/eng/app/appendices.shtml, verified February 2011) and is placed in the Vulnerable category of the IUCN Red List (http://www.iucnredlist.org/, verified February 2011), although the abundance of the white shark is little known (Cliff et al. 1996; Strong et al. 1996).
Recently, the movements, habitat features and population structure of white sharks around South Africa, Australia, New Zealand and California have been studied using electronic tags and DNA analysis techniques (Bonfil et al. 2005, 2010; Gubili et al. 2009; Jorgensen et al. 2010). These studies reveal that white sharks move over large spatial areas: South Africa to Australia, New Zealand to Australia and California to Hawaii. However, there are few studies of white sharks around Japan: Nakaya (1993, 1994) has reported on fatal attacks and distribution of the white shark and Uchida et al. (1996) has described pregnant females and embryos.
Information about the age and growth of the white shark is also scarce (Cailliet et al. 1985; Wintner and Cliff 1999), although such information is important for life-history and demographic analyses. Elasmobranch age is generally estimated from counts of the growth bands in the vertebral centra (Cailliet and Goldman 2004). The visibility and readability of growth bands must often be enhanced for accurate age determination, which Cailliet et al. (1985) and Wintner and Cliff (1999) achieved for whole centra of white sharks using X-radiography. Unfortunately, when examining whole centra using X-radiography, the visibility of the growth bands is compromised owing to the intermedialia of the centrum. Recently, thin sectioning has been recommended as a more accurate technique (Cailliet and Goldman 2004). Using the same white sharks assessed by Cailliet et al. (1985), Kerr et al. (2006) compared the counts of growth bands obtained from thin sections with Cailliet et al. (1985)’s counts and found only small differences between them. However, it is difficult to read the growth bands laid down at a young age on cross-sections of the corpus calcareum. Conversely, using the whole centrum has the advantage that the entire surface of the corpus calcareum is available for examination. Semba et al. (2009) used this whole centrum technique and observed uneven annuli on the surface of the corpus calcareum in the short-fin mako, Isurus oxyrinchus, using the shadowing method. Therefore, we examined only the corpus calcareum using X-radiography to compare the visibility of growth bands with the previous studies of the white shark.
The life-history traits of many fish species are known to vary among geographical populations and as a consequence of density-dependent responses, even in the same population over a long period of time (Jorgensen et al. 2007; Magnussen 2007). The porbeagle shark, Lamna nasus, in the family Lamnidae, which includes the white shark, exhibits different life-history traits between New Zealand and North Atlantic populations, and between virgin and exploited populations in the western North Atlantic (Cassoff et al. 2007; Francis et al. 2007). As white sharks inhabit many waters of the world’s oceans, being found in diverse and changing habitats, we hypothesised that the life-history traits of Japanese white sharks would differ from those of other populations. The objectives of this study were to: (1) show a simple means of enhancing the visibility of growth bands accumulated in the corpus calcareum of white shark centra; (2) estimate the age and growth rate from the band counts; and (3) examine the relationship between white sharks caught in Japanese waters with other populations in the Indian and Pacific Oceans using genetic techniques. A detailed description of the genetic structure of Japanese white sharks will be presented in a separate article once more samples have been examined.
Materials and methods
Sampling
In total, 21 white sharks were obtained from incidental catches of large set nets in Kashima-nada, Ibaraki Prefecture, Japan between April 2004 and December 2009. Sharks were held at the Ibaraki Prefectural Oarai Aquarium and measured and dissected for collection of biological samples. Natural total length (TL), fork length (FL) and precaudal length (PCL) of all sharks, and inner clasper length of males, were measured to the nearest millimetre as described by Mollet et al. (1996). Sex, bodyweight (BW) and gonad weight were also recorded.
The data for both sexes were pooled and used to calculate the following conversions:


The relationship between total length and bodyweight was calculated using the data:

Vertebral samples were taken anterior to the diplospondylous transition above the cloaca from 11 males (231.4–442.0 cm TL) and 8 females (231.8–482 cm TL) and frozen. Individual centra were boiled and soaked in a 5% solution of sodium hypochlorite to remove the muscle and connective tissue. The centra were then washed in running water and stored in 80% ethanol. Muscle tissue was collected from 7 sharks (231.4–446.3 cm TL) caught in 2008 and 2009 for genetic analysis and stored frozen or in 95% ethanol.
Growth bands
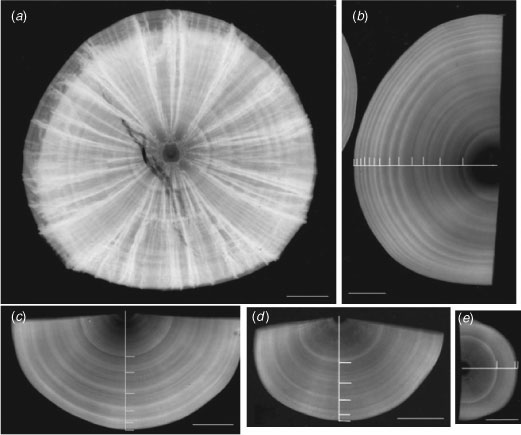
The visibility of growth bands was enhanced with X-radiography (SOFRON, SRO-M50, Tokyo, Japan). First, a whole centrum was cut in half transversely with a diamond saw and photographed with X-radiography (Fig. 1a). Then, the half centrum was cut sagittally and the intermedialia was removed with a diamond saw and whetstones (see Accessory Publication on the Marine and Freshwater Research website). The centrum, being now only the corpus calcareum, was put on photographic paper and X-rayed at a distance of 40 cm. Exposure times ranged from 3 to 6 min, and voltage and current were fixed at 40 kV and 5 mA, respectively. The X-radiographs were scanned (Epson, GT-9800F, Suwa, Japan) and Adobe Photoshop software was used to enhance the images for subsequent measurement. A growth band was defined as a pair of zones, one opaque and the other translucent (Fig. 1). The centrum radius (CR) and band radius (BR) were measured from the focus to the outer edge of the centrum and opaque zone, respectively. The mean and variance of each radius in each band group were calculated for males and females and compared statistically for both using one-sided t-tests and one-sided F-tests, respectively. Although sample size was small, we attempted to confirm the annual periodicity of band formation by assessing whether the last deposited band was a translucent or opaque zone.
|
Growth parameters
Growth parameters were estimated with the von Bertalanffy growth model and fitted to individual back-calculated length-at-age data. Back-calculation was based on band radii using the regression of CR on TL by the Fraser–Lee method (Francis 1990). Growth parameters were fitted by using the nonlinear least-squares method on Microsoft Excel Solver (Akamine 2004). The growth model’s goodness of fit was examined by a Chi-square test.
Genetic analysis
Total genomic DNA of seven white sharks was extracted using the DNeasy Tissue Kit (Qiagen K. K., Tokyo, Japan). Polymerase chain reaction was used to amplify ~500 bp of the mitochondrial DNA D-loop region, using primers and conditions available for the white sharks in GenBank (Pardini et al. 2000). The two primers for the D-loop region were GWDL-L (TTG ACG CGA TCA AGG ACG AA) and GWDL-H (CAA ACA TCC ATT TGG CCT TC), and the DNA polymerase used was TaKaRa Ex Taq Hot Start Version (TaKaRa Bio Inc., Otsu, Japan). The D-loop region fragments were sequenced with BigDye Terminator ver.3.1 Cycle Sequence Kit (Applied Biosystems, Tokyo, Japan) and aligned using the software DNASIS Pro V2.2 (Hitachi Solutions, Ltd, Tokyo, Japan). All positions containing gaps and missing data were eliminated from the dataset (‘Complete deletion’ option). The choice of nucleotide-substitution models was determined based on the Akaike information criterion calculated using MrAIC.pl. ver.1.4.4 (Nylander 2004). A neighbour-joining tree was drawn with Mega ver.3 using the genetic distances calculated by the Kimura 2-parameter (K2P) method (Kimura 1980; Saitou and Nei 1987; Kumar et al. 2004), including previously published datasets from California (Jorgensen et al. 2010; Accession Nos. GU2302–GU2321), Australia, New Zealand and South Africa (Pardini et al. 2001; Accession Nos. AY026196–AY026224) in GenBank. To further examine the phylogenetic tree, maximum likelihood and Bayesian trees were constructed using PhyML ver.3.0 from the GTR+G (general time reversible + gamma) model and MrBayes ver.3.1.2 from the K2P+G model (as determined by MrAIC.pl. ver.1.4.4), respectively (Huelsenbeck and Ronquist 2001; Guindon and Gascuel 2003). The bootstrap consensus was inferred from 1000 replicates (Felsenstein 1985). Branches corresponding to partitions reproduced in less than 70% bootstrap replicates were collapsed. Population subdivision was estimated using AMOVA (FST calculated by Arlequin ver.3.1).
Results
Age and growth
The relationship between TL and CR was linear for males and females (see Accessory Publication), and the regressions were statistically significant: male CR = 0.089TL – 2.915 (n = 11, R2 = 0.830, P < 0.001), female CR = 0.083TL – 2.665 (n = 8, R2 = 0.952, P < 0.001). ANCOVA for the regression lines of both sexes showed no significant difference (F1,16 = 3.508, P > 0.05).
Growth bands were observed more easily in the corpus calcareum than in the whole centrum (Fig. 1). In the centra of small sharks, there was less discrimination between opaque and translucent zones. The visibility of growth bands in females was lower than that in males. Males accumulated 2 to 12 growth bands and females, 2 to 8 bands. The Rosa Lee phenomenon was not detected in the relationship between CR and BR in any band group for males or females (Fig. 2). The distribution of each BR group overlapped that of the neighbouring BR groups in the third and higher BR groups in males and the second and higher BR groups in females. Although there were no differences in variance between females and males in the first to sixth BR groups (one-sided F-test: 3.39 > Fcal > 1.03, 0.546 > P >0.059), the mean BR of females was significantly larger than that of males in the second to sixth BR groups (one-sided t-test: 2.46 > tcal >1.83, 0.044 > P > 0.016).

|
Back-calculated lengths for individual sharks were obtained using the regression of TL–CR and each BR for males and females by the Fraser–Lee method (Fig. 3). Some of the resultant curves for males were more curviform than those of females. Back-calculated lengths from the first BR ranged from 112.6 to 162.2 cm TL (mean = 142.3 cm TL) in males and from 138.2 to 167.3 cm TL (mean = 149.9 cm TL) in females. The first band was recognised as a birth band, as the back-calculated lengths were similar in value to the birth size of white sharks (Uchida et al. 1996). One male of 323.9 cm TL indicated unusual growth, with a small birth size and low growth rate (Fig. 3).

|
An opaque zone was observed in the outer margin of the centrum between March and June, whereas a translucent zone was observed in March, April and December (Table 1). The opaque and translucent zones tended to be formed in spring to summer and in winter to spring, respectively, as the last band of six sharks in May and June was an opaque zone. Although the results were ambiguous, we assumed that growth bands were laid down annually.
|
Von Bertalanffy growth parameters were derived from the back-calculated lengths of individual sharks (Table 2). The goodness-of-fit of the growth model for both sexes was significant, although the goodness-of-fit for males was better than that for females. Asymptotic length, L∞, for males was close to the observed maximum TL, while that for females was higher, being 100 cm larger, when compared with the observed length. The growth coefficient, k, of males was higher than that of females, and the 95% confidence range of the former was wide. The theoretical age at zero length, t0, for both sexes was similar. These growth curves corresponded closely with the observed length data (Fig. 4).

|
|
One male of 310.9 cm TL possessed hard claspers 58.2 cm long and seminal fluid. The increase in clasper length in sharks over 310 cm TL was gradual compared with that of males between 230 and 310 cm TL (Fig. 5). One male of 323.9 cm TL, which had a slow growth rate, also had seminal fluid. Male sharks of 310.9 and 323.9 cm TL were 3 and 7 years old, respectively. The testis weight in a male of 381.0 cm TL at 8 years old was 3300 g. These findings suggest that male white sharks reach maturity at above 310 cm TL and over 4 years old, based on the growth curve.
|
Two females of 446.3 and 482.0 cm TL possessed a maturing ovary heavier than 4100 g (Fig. 5). The uterus of the latter female was wide, suggesting that it might experience parturition. These females were 6 and 7 years old, respectively. Each of six females below 400 cm TL and 5 years old had an immature ovary and a thread-like uterus. These observations suggest that female sharks begin to mature when they reach 450 cm TL and 7 years old, from the growth curve.
Genetic status
Analyses of the nucleotide sequence of 403 bp in the D-loop region (GenBank Accession Nos. AB598391–AB598397) revealed that sequence divergences among Japanese white sharks may be low except for shark no. 4 (Fig. 6). This shark was a maturing female of 446.3 cm TL. The neighbour-joining tree showed two major groups: South Africa and the other regions, as described by Pardini et al. (2001) and Jorgensen et al. (2010). Japanese white sharks were included in the latter group and formed a definite monophyletic cluster separate from California, Australia and New Zealand populations (bootstrap value 89%). Furthermore, the results of the maximum likelihood and Bayesian analyses were similar to the results from the neighbour-joining method. Bayesian posterior probability for the Japanese monophyletic cluster was also high (97%). All pairwise FST population comparisons yielded significant heterogeneity (P < 0.001) (Table 3). These results suggest the gene pool of female Japanese white sharks is disjunct from that of the other populations.
|
|
Discussion
The results of this study demonstrate that Japanese white sharks form a distinct population with different life-history traits to other populations of white sharks in California and South Africa. Comparisons of growth parameters suggest that Japanese white sharks grow faster than other populations. Population distinction between Japan and other areas was supported by the genetic analysis.
Age estimation
The maximum number of growth bands per centrum was 12 in males and 8 in females in this study. Previous maximum numbers were 15 in California, 13 for males and 8 for females in South Africa, and 22 for females in New Zealand (Cailliet et al. 1985; Francis 1996; Wintner and Cliff 1999). These observations suggest that white sharks can be aged up to 22 years or greater. Band width narrowed with increasing band number in the outer margin of the corpus calcareum and discrimination became difficult. Francis et al. (2007) discussed the limits of age determination using the vertebral centrum in the porbeagle shark, pointing out the inconsistency between known-age and growth band counts in older individuals. This affects the estimation of longevity. Furthermore, Natanson et al. (2008) reported a difference in growth band counts along an individual vertebral column in the basking shark, a phenomenon that was conspicuous in large sharks and also affects longevity estimates. Therefore, longevity estimates should be validated using techniques such as bomb radiocarbon chronology and tag–recapture analyses (Smith et al. 2003; Francis et al. 2007; Kneebone et al. 2008).
In the vertebral centrum of many lamnoid sharks, the intermedialia consists of calcified lamellar structures and uncalcified cartilage as described by Ridewood (1921). Since growth bands are formed mainly in the corpus calcareum of the centrum in elasmobranch fishes (Cailliet and Goldman 2004), we examined only the corpus calcareum of white sharks using X-radiography after removing the intermedialia. This approach resulted in increased visibility of the growth bands. However, it was still difficult to discriminate the opaque and translucent zones deposited at a younger age. As opaque and translucent zones result from differences in the accumulation of calcium phosphate and organic matter (Cailliet and Radtke 1987), the distinction between the zones would be minimal for young-of-the-year, which inhabit stable environments (Dewar et al. 2004; Weng et al. 2007b). The growth bands of male white sharks were more distinct than those of females, a difference that may reflect sex-specific differences in behaviour (Robbins 2007; Weng et al. 2007a; Domeier and Nasby-Lucas 2008).
The observed overlap of band radius among neighbouring band groups indicated the differences in back-calculated lengths-at-age in individual sharks. Uchida et al. (1996) reported that the size at birth of white sharks from Japan ranges from 120 to 150 cm TL. The smallest free-swimming white shark appears to be 122 cm TL (Casey and Pratt 1985; Francis 1996). The mean back-calculated lengths for the first band for males and females were 142.3 and 149.9 cm TL, respectively. Therefore, the first band can logically be considered to be a birth mark. The smallest back-calculated length from the first band radii was 112.6 cm TL, but the first band radius was, in fact, not the lowest among the first band radii. On the other hand, the largest back-calculated length from the first band radii was 167.3 cm TL. The difference was 55 cm, which is equal to the growth rate in the first year for males as calculated by the von Bertalanffy growth equation. Body growth is variable between individual sharks and that would be reflected on centrum growth. Therefore, variability in growth of individuals and reflection of centrum growth by body growth account for the differences seen in back-calculated lengths.
The period of time taken for growth band formation could not be defined. Wintner and Cliff (1999) reported that the use of injected oxytetracycline, as part of a tagging–recapture program, and examination of the marginal increment ratio (MIR) in South African white sharks did not allow confirmation of annual growth band deposition. Also, Kerr et al. (2006) found that radiocarbon analysis could not validate growth band periodicity in white sharks. However, some species of the family Lamnidae form annual growth bands (Natanson et al. 2002; Cerna and Licandeo 2009). The periodicity of growth band formation is essential information in age determinations (Cailliet et al. 2006). Recently, Okamura and Semba (2009) reported a statistical method for validating the periodicity in elasmobranchs. However, like in the MIR method, monthly samples are needed. Therefore, several techniques of the validation analysis of Cailliet and Goldman (2004) should be pursued to complement these methods, particularly since the white shark is one of most difficult species to collect.
Differences in life-history traits
The von Bertalanffy growth curves for male and female sharks in this study indicated faster growth than that previously reported (Cailliet et al. 1985; Wintner and Cliff 1999). The growth coefficient (k), influenced by early growth, was 0.196 year–1 in males and 0.159 year–1 in females in this study, whereas that from white sharks in California and South Africa was 0.058 year–1 and 0.065 year–1, respectively (Cailliet et al. 1985; Wintner and Cliff 1999). Therefore, the growth rate per year was clearly higher until males reached 4 years old and females reached 6 years old. As mentioned above, the growth of young-of-the-year was 55 cm TL in males and 75 cm TL in females, about twice the rates previously found. Ainley et al. (1985) reported the growth of ~50 cm per year based on sight observations of white sharks in the field. Young white sharks kept in aquaria show high growth rates (Kerr et al. 2006). These findings suggest that young white sharks can experience fast growth if food is not limiting.
The estimated asymptotic length (L∞), 455.0 cm TL, of males was smaller than the maximum length of 490 cm TL reported previously in Japan (Shimamoto et al. 1994), while that of females (606.7 cm TL) was larger than the maximum observed length of 555 cm TL reported from Okinawa (Uchida et al. 1996). The asymptotic length for both sexes in this study appears to be appropriate, considering that the maximum length of females measured in Cuba was 640.8 cm TL (Mollet et al. 1996). The size at birth (L0) estimated by the growth model was 142.5 cm TL in males and 150.7 cm TL in females. These lengths were also similar to the length of the full-term embryos observed by Uchida et al. (1996).
Male sharks were found to mature at 310 cm TL, while Pratt (1996) reported that size at maturity of the Atlantic white shark is ~370 cm TL. Females began to mature at ~450 cm TL in this study, which is similar to the size reported by Francis (1996). However, the size at maturity of females remained ambiguous due to small samples. Nakaya (1994) described a similar size at maturity for Japanese female white sharks, being 4.8 m TL. As size at maturity is influenced by the density and the abundance of prey in the habitat, which is very likely to vary over the distribution of this species, white shark growth and size might also differ among populations. Male and female white sharks in this study attained maturity at 4 and ~7 years old, respectively, because their early growth was fast. Previous estimates of age at maturity were 9–10 years for combined sexes in California and, 8–10 years for males and 12–13 years for females in South Africa, based on the growth curves calculated by Cailliet et al. (1985) and Wintner and Cliff (1999). Therefore, the age at maturity of white sharks in Japan also appears to differ from that of other population studied.
The analysis of mtDNA revealed that the Japanese population forms a monophyletic cluster from other populations. Pardini et al. (2001) and Jorgensen et al. (2010) found genetic differences among white shark populations of South Africa, Australia–New Zealand and California. The present neighbour-joining tree differed slightly from Jorgensen’s tree in the relationship between Australia–New Zealand and California. This difference is attributable to the addition of the genetic data of the Japanese population. The genetic diversity of mtDNA in the Japanese population was low, as has been found for the other populations (Pardini et al. 2001; Zenger et al. 2006). Therefore, the gene flow between females of the populations appears to be low due to female site fidelity as suggested by Pardini et al. (2001). However, based on electronic tagging data and photographic identification of individuals, Bonfil et al. (2005) reported transoceanic migration from South Africa to Australia of one white shark. The movement and habitat use of sharks in Australia–New Zealand and California–Hawaii has also been observed using the above methods (Boustany et al. 2002; Bruce et al. 2006; Weng et al. 2007a). As the white sharks in Japan are assumed to be genetically closer to those from Australia–New Zealand and California–Hawaii than from South Africa, the population structure in the Pacific Ocean needs to be validated using electronic tagging studies on individuals from the western North Pacific and information from photographic identification, in conjunction with detailed studies of population genetics.
Unique life-history traits, related to early growth rate and age at maturity, in Japanese white sharks may be caused by genetic differences from other populations. However, as it is still unclear whether this is due to a geoecotype or a compensatory density-dependent growth response, further research on the population dynamics of white sharks in the western North Pacific is needed.
Acknowledgements
We thank Osamu Mikami (Oose Fisheries Cooperation) and Kazuhiro Shibagaki (Ibaraki Prefectural Oarai Aquarium) who provided and collected samples. The specimens were collected as a part of natural history education by Ibaraki Prefectural Oarai Aquarium under a partnership with Oose Fisheries Cooperation. We also thank Kiyomi Koga, Shuhei Ohnishi, Keiko Tanaka and Shingo Suzuki for laboratory and analytical assistance, and two anonymous reviewers who provided helpful comments on this manuscript.
References
Ainley, D. G., Henderson, R. P., Huber, H. R., Boekelheide, R. J., Allen, S. G., et al. (1985). Dynamics of white shark/pinniped interactions in the Gulf of the Farallones. Memoirs of the Southern California Academy of Sciences 9, 109–122.Akamine, T. (2004). Statistical test and model selection of fish growth formula. Bulletin of the Japanese Society of Fisheries Oceanography 68, 44–51.
Bonfil, R., Meyer, M., Scholl, M. C., Johnson, R., O’Brien, S., et al. (2005). Transoceanic migration, spatial dynamics, and population linkages of white sharks. Science 310, 100–103.
| Transoceanic migration, spatial dynamics, and population linkages of white sharks.Crossref | GoogleScholarGoogle Scholar | 1:CAS:528:DC%2BD2MXhtVOjsr7N&md5=dbb22b5fbf790fa57faac3fa3dea5958CAS | 16210537PubMed |
Bonfil, R., Francis, M. P., Duffy, C., Manning, M. J., and O’Brien, S. (2010). Large-scale tropical movements and diving behavior of white sharks Carcharodon carcharias tagged off New Zealand. Aquatic Biology 8, 115–123.
| Large-scale tropical movements and diving behavior of white sharks Carcharodon carcharias tagged off New Zealand.Crossref | GoogleScholarGoogle Scholar |
Boustany, A. M., Davis, S. F., Pyle, P., Anderson, S. D., Le Boeuf, B. J., et al. (2002). Expanded niche for white sharks. Nature 415, 35–36.
| Expanded niche for white sharks.Crossref | GoogleScholarGoogle Scholar | 1:CAS:528:DC%2BD38Xkt1Kjtg%3D%3D&md5=0af179efad5edb659b342540d69b943cCAS |
Bruce, B. D., Stevens, J. D., and Malcolm, H. (2006). Movements and swimming behaviour of white sharks (Carcharodon carcharias) in Australian waters. Marine Biology 150, 161–172.
| Movements and swimming behaviour of white sharks (Carcharodon carcharias) in Australian waters.Crossref | GoogleScholarGoogle Scholar |
Cailliet, G. M., and Goldman, K. J. (2004). Age determination and validation in chondrichthyan fishes. In ‘Biology of Sharks and Their Relatives’. (Eds J. C. Carrier, J. A. Musick and M. R. Heithaus.) pp. 399–447. (CRC Press: Boca Raton, FL.)
Cailliet, G. M., and Radtke, R. L. (1987). A progress report on the electron microprobe analysis techniques for age determination and verification in elasmobranchs. In ‘The Age and Growth of Fish’. (Eds R. C. Summerfelt and G. E. Hall.) pp. 359–369. (The Iowa State University Press: Ames, IA.)
Cailliet, G. M., Natanson, L. J., Welden, B. A., and Ebert, D. A. (1985). Preliminary studies on the age and growth of the white shark, Carcharodon carcharias, using vertebral bands. Memoirs of the Southern California Academy of Sciences 9, 49–60..
Cailliet, G. M., Smith, W. D., Mollet, H. F., and Goldman, K. J. (2006). Age and growth studies of chondrichthyan fishes: the need for consistency in terminology, verification, validation, and growth function fitting. Environmental Biology of Fishes 77, 211–228.
| Age and growth studies of chondrichthyan fishes: the need for consistency in terminology, verification, validation, and growth function fitting.Crossref | GoogleScholarGoogle Scholar |
Casey, J. G., and Pratt, H. L. (1985). Distribution of the white shark, Carcharodon carcharias, in the western North Atlantic. Memoirs of the Southern California Academy of Sciences 9, 2–14..
Cassoff, R. M., Campana, S. E., and Myklevoll, S. (2007). Changes in baseline growth and maturation parameters of northwest Atlantic porbeagle, Lamna nasus, following heavy exploitation. Canadian Journal of Fisheries and Aquatic Sciences 64, 19–29.
| Changes in baseline growth and maturation parameters of northwest Atlantic porbeagle, Lamna nasus, following heavy exploitation.Crossref | GoogleScholarGoogle Scholar |
Cerna, F., and Licandeo, R. (2009). Age and growth of the shortfin mako (Isurus oxyrinchus) in the south-eastern Pacific off Chile. Marine and Freshwater Research 60, 394–403.
| Age and growth of the shortfin mako (Isurus oxyrinchus) in the south-eastern Pacific off Chile.Crossref | GoogleScholarGoogle Scholar |
Cliff, G., Van Der Elst, R. P., Govender, A., Witthuhn, T. K., and Bullen, E. M. (1996). First estimate of mortality and population size of white sharks on the South African coast. In ‘Great White Sharks: The Biology of Carcharodon carcharias’. (Eds A. P. Klimley and D. G. Ainley.) pp. 393–400. (Academic Press: Millbrae, CA.)
Dewar, H., Domeier, M., and Nasby-Lucas, N. (2004). Insights into young of the year white shark, Carcharodon carcharias, behavior in the Southern California Bight. Environmental Biology of Fishes 70, 133–143.
| Insights into young of the year white shark, Carcharodon carcharias, behavior in the Southern California Bight.Crossref | GoogleScholarGoogle Scholar |
Domeier, M. L., and Nasby-Lucas, N. (2008). Migration patterns of white sharks Carcharodon carcharias tagged at Guadalupe Island, Mexico, and identification of an eastern Pacific shared offshore foraging area. Marine Ecology Progress Series 370, 221–237.
| Migration patterns of white sharks Carcharodon carcharias tagged at Guadalupe Island, Mexico, and identification of an eastern Pacific shared offshore foraging area.Crossref | GoogleScholarGoogle Scholar |
Felsenstein, J. (1985). Confidence limits on phylogenies: an approach using the bootstrap. Evolution 39, 783–791.
| Confidence limits on phylogenies: an approach using the bootstrap.Crossref | GoogleScholarGoogle Scholar |
Francis, R. I. C. C. (1990). Back-calculation of fish length: a critical review. Journal of Fish Biology 36, 883–902.
| Back-calculation of fish length: a critical review.Crossref | GoogleScholarGoogle Scholar |
Francis, M. P. (1996). Observations on a pregnant white shark with a review of reproductive biology. In ‘Great White Sharks: The Biology of Carcharodon carcharias’. (Eds A. P. Klimley and D. G. Ainley.) pp. 157–172. (Academic Press: Millbrae, CA.)
Francis, M. P., Campana, S. E., and Jones, C. M. (2007). Age under-estimation in New Zealand porbeagle sharks (Lamna nasus): is there an upper limit to ages that can be determined from shark vertebrae? Marine and Freshwater Research 58, 10–23.
| Age under-estimation in New Zealand porbeagle sharks (Lamna nasus): is there an upper limit to ages that can be determined from shark vertebrae?Crossref | GoogleScholarGoogle Scholar |
Gubili, C., Johnson, R., Gennari, E., Oosthuizen, W. H., Kotze, D., et al. (2009). Concordance of genetic and fin photo identification in the great white shark, Carcharodon carcharias, off Mossel Bay, South Africa. Marine Biology 156, 2199–2207.
| Concordance of genetic and fin photo identification in the great white shark, Carcharodon carcharias, off Mossel Bay, South Africa.Crossref | GoogleScholarGoogle Scholar |
Guindon, S., and Gascuel, O. (2003). A simple, fast, and accurate algorithm to estimate phylogenies by maximum likelihood. Systematic Biology 52, 696–704.
| A simple, fast, and accurate algorithm to estimate phylogenies by maximum likelihood.Crossref | GoogleScholarGoogle Scholar | 14530136PubMed |
Huelsenbeck, J. P., and Ronquist, F. (2001). ‘MRBAYES: Bayesian Inference of Phylogenic Trees.’ (Oxford University Press: New York.)
Jorgensen, C., Enberg, K., Dunlop, E. S., Arlinghaus, R., Boukal, D. S., et al. (2007). Managing evolving fish stocks. Science 318, 1247–1248.
| Managing evolving fish stocks.Crossref | GoogleScholarGoogle Scholar | 1:CAS:528:DC%2BD2sXhtlOmsbfF&md5=7a484a2248ef33b0a4c0c2c94181626cCAS | 18033868PubMed |
Jorgensen, S. J., Reeb, C. A., Chapple, T. K., Anderson, S., Perle, C., et al. (2010). Philopatry and migration of Pacific white sharks. Proceedings of the Royal Society B: Biological Sciences 277, 679–688.
| Philopatry and migration of Pacific white sharks.Crossref | GoogleScholarGoogle Scholar |
Kerr, L. A., Andrews, A. H., Cailliet, G. M., Brown, T. A., and Coale, K. H. (2006). Investigations of Δ14C, δ13C, and δ15N in vertebrae of white shark (Carcharodon carcharias) from the eastern North Pacific Ocean. Environmental Biology of Fishes 77, 337–353.
| Investigations of Δ14C, δ13C, and δ15N in vertebrae of white shark (Carcharodon carcharias) from the eastern North Pacific Ocean.Crossref | GoogleScholarGoogle Scholar |
Kimura, M. (1980). A simple method for estimating evolutionary rate of base substitutions through comparative studies of nucleotide sequences. Journal of Molecular Evolution 16, 111–120.
| A simple method for estimating evolutionary rate of base substitutions through comparative studies of nucleotide sequences.Crossref | GoogleScholarGoogle Scholar | 1:CAS:528:DyaL3MXmtFSktg%3D%3D&md5=b624e05c6d4a1dff9a13279cf8cb9101CAS | 7463489PubMed |
Kneebone, J., Natanson, L. J., Andrews, A. H., and Howell, W. H. (2008). Using bomb radiocarbon analyses to validate age and growth estimates for the tiger shark, Galeocerdo cuvier, in the western North Atlantic. Marine Biology 154, 423–434.
| Using bomb radiocarbon analyses to validate age and growth estimates for the tiger shark, Galeocerdo cuvier, in the western North Atlantic.Crossref | GoogleScholarGoogle Scholar |
Kumar, S., Tamura, K., and Nei, M. (2004). MEGA3: integrated software for molecular evolutionary genetics analysis and sequence alignment. Briefings in Bioinformatics 5, 150–163.
| MEGA3: integrated software for molecular evolutionary genetics analysis and sequence alignment.Crossref | GoogleScholarGoogle Scholar | 1:CAS:528:DC%2BD2cXntFGqu7s%3D&md5=eaed9e037de7ef0b04ef944fbe4e51e5CAS | 15260895PubMed |
Magnussen, E. (2007). Interpopulation comparison of growth patterns of 14 fish species on Faroe Bank: are all fishes on the bank fast-growing? Journal of Fish Biology 71, 453–475.
| Interpopulation comparison of growth patterns of 14 fish species on Faroe Bank: are all fishes on the bank fast-growing?Crossref | GoogleScholarGoogle Scholar |
Mollet, H. F., Cailliet, G. M., Klimley, A. P., Ebert, D. A., Testi, A. D., et al. (1996). A review of length validation methods and protocols to measure large white sharks. In ‘Great White Sharks: The Biology of Carcharodon carcharias’. (Eds A. P. Klimley and D. G. Ainley.) pp. 91–108. (Academic Press: Millbrae, CA.)
Nakaya, K. (1993). A fatal attack by a white shark in Japan and a review of shark attcks in Japanese waters. Japanese Journal of Ichthyology 40, 35–42..
Nakaya, K. (1994). Distribution of white shark in Japanese waters. Fisheries Science 60, 515–518..
| 1:CAS:528:DyaK2MXitFeku7s%3D&md5=94dff0e275a6d12d83bace39f8880dbdCAS |
Natanson, L. J., Mello, J. J., and Campana, S. E. (2002). Validated age and growth of the porbeagle shark (Lamna nasus) in the western North Atlantic Ocean. Fishery Bulletin 100, 266–278..
Natanson, L. J., Wintner, S. P., Johansson, F., Piercy, A., Campbell, P., et al. (2008). Ontogenetic vertebral growth patterns in the basking shark Cetorhinus maximus. Marine Ecology Progress Series 361, 267–278.
| Ontogenetic vertebral growth patterns in the basking shark Cetorhinus maximus.Crossref | GoogleScholarGoogle Scholar |
Nylander, J. A. A. (2004). MrAIC.pl. Program distributed by the author, Evolutionary Biology Centre, Uppsala University, Sweden. Available athttp://www.abc.se/~nylander/mraic/mraic.html [Accessed 19 November 2010].
Okamura, H., and Semba, Y. (2009). A novel statistical method for validating the periodicity of vertebral growth band formation in elasmobranch fishes. Canadian Journal of Fisheries and Aquatic Sciences 66, 771–780.
| A novel statistical method for validating the periodicity of vertebral growth band formation in elasmobranch fishes.Crossref | GoogleScholarGoogle Scholar |
Pardini, A. T., Jones, C. S., Scholl, M. C., and Noble, L. R. (2000). Isolation and characterization of dinucleotide microsatellite loci in the great white shark, Carcharodon carcharias. Molecular Ecology 9, 1176–1178.
| Isolation and characterization of dinucleotide microsatellite loci in the great white shark, Carcharodon carcharias.Crossref | GoogleScholarGoogle Scholar | 1:CAS:528:DC%2BD3cXmsVWgsrs%3D&md5=ec48aa4c0dde272fef3606579c8c9e28CAS | 10964240PubMed |
Pardini, A. T., Jones, C. S., Noble, L. R., Kreiser, B., Malcolm, H., et al. (2001). Sex-biased dispersal of great white sharks. Nature 412, 139–140.
| Sex-biased dispersal of great white sharks.Crossref | GoogleScholarGoogle Scholar | 1:CAS:528:DC%2BD3MXlsFWnsr4%3D&md5=3bcf499d9706ee72315bc42cd06bd219CAS | 11449258PubMed |
Pratt, H. L., Jr (1996). Reproduction in the male white shark. In ‘Great White Sharks: The Biology of Carcharodon carcharias’. (Eds A. P. Klimley and D. G. Ainley.) pp. 131–138. (Academic Press: Millbrae, CA.)
Ridewood, W. G. (1921). On the calcification of the vertebral centra in sharks and rays. Phylosophical Transactions of Royal Society London series B 210, 311–407.
| On the calcification of the vertebral centra in sharks and rays.Crossref | GoogleScholarGoogle Scholar |
Robbins, R. L. (2007). Environmental variables affecting the sexual segregation of great white sharks Carcharodon carcharias at the Neptune Islands South Australia. Journal of Fish Biology 70, 1350–1364.
| Environmental variables affecting the sexual segregation of great white sharks Carcharodon carcharias at the Neptune Islands South Australia.Crossref | GoogleScholarGoogle Scholar |
Saitou, N., and Nei, M. (1987). The neighbor-joining method: A new method for reconstructing phylogenetic trees. Molecular Biology and Evolution 4, 406–425..
| 1:STN:280:DyaL1c7ovFSjsA%3D%3D&md5=7797e863e348f56c62d0bd24725b6873CAS | 3447015PubMed |
Semba, Y., Nakano, H., and Aoki, I. (2009). Age and growth analysis of the shortfin mako, Isurus oxyrinchus, in the western and central North Pacific Ocean. Environmental Biology of Fishes 84, 377–391.
| Age and growth analysis of the shortfin mako, Isurus oxyrinchus, in the western and central North Pacific Ocean.Crossref | GoogleScholarGoogle Scholar |
Shimamoto, N., Tanda, M., Nakamura, Y., Otani, T., Nishikawa, T., et al. (1994). Record of the white shark Carcharodon carcharias caught in Sea of Harima in May 1992. Bulletin of the Hyogo Prefectural Fisheries Experimental Station 31, 79–84..
Smith, S. E., Mitchell, R. A., and Fuller, D. (2003). Age-validation of a leopard shark (Triakis semifasciata) recaptured after 20 years. Fishery Bulletin 101, 194–198..
Strong, W. R., Jr, Bruce, B. D., Nelson, D. R., and Murphy, R. D. (1996). Population dynamics of white sharks in Spencer Gulf, South Australia. In ‘Great White Sharks: The Biology of Carcharodon carcharias’. (Eds A. P. Klimley and D. G. Ainley.) pp. 401–414. (Academic Press: Millbrae, CA.)
Uchida, S., Toda, M., Teshima, K., and Yano, K. (1996). Pregnant white sharks and full-term embryos from Japan. In ‘Great White Sharks: The Biology of Carcharodon carcharias’. (Eds A. P. Klimley and D. G. Ainley.) pp. 139–155. (Academic Press: Millbrae, CA.)
Weng, K. C., Boustany, A. M., Pyle, P., Anderson, S. D., Brown, A., et al. (2007). Migration and habitat of white sharks (Carcharodon carcharias) in the eastern Pacific Ocean. Marine Biology 152, 877–894.
| Migration and habitat of white sharks (Carcharodon carcharias) in the eastern Pacific Ocean.Crossref | GoogleScholarGoogle Scholar |
Weng, K. C., O’Sullivan, J. B., Lowe, C. G., Winkler, C. E., Dewar, H., et al. (2007). Movements, behavior and habitat preferences of juvenile white sharks Carcharodon carcharias in the eastern Pacific. Marine Ecology Progress Series 338, 211–224.
| Movements, behavior and habitat preferences of juvenile white sharks Carcharodon carcharias in the eastern Pacific.Crossref | GoogleScholarGoogle Scholar |
Wintner, S. P., and Cliff, G. (1999). Age and growth determination of the white shark, Carcharodon carcharias, from the east coast of South Africa. Fishery Bulletin 97, 153–169..
Zenger, K. R., Stow, A. J., Peddemors, V., Briscoe, D. A., and Harcourt, R. G. (2006). Widespread utility of highly informative AFLP molecular markers across divergent shark species. The Journal of Heredity 97, 607–611.
| Widespread utility of highly informative AFLP molecular markers across divergent shark species.Crossref | GoogleScholarGoogle Scholar | 1:CAS:528:DC%2BD28XhtlCru7nI&md5=34d342d98d055348c6424c02596fbd21CAS | 17150982PubMed |