

Identifying the land-based sources of suspended sediments, nutrients and pesticides discharged to the Great Barrier Reef from the Tully–Murray Basin, Queensland, Australia
Zoe T. Bainbridge A D , Jon E. Brodie A , John W. Faithful A C , Damon A. Sydes B and Stephen E. Lewis AA Australian Centre for Tropical Freshwater Research, James Cook University, Townsville, Qld 4811, Australia.
B Cassowary Coast Regional Council, Tully, Qld 4854, Australia.
C Present address: Golder Associates, Calgary, AB T2P 3T1, Canada.
D Corresponding author. Email: zoe.bainbridge@jcu.edu.au
Marine and Freshwater Research 60(11) 1081-1090 https://doi.org/10.1071/MF08333
Submitted: 2 December 2008 Accepted: 20 August 2009 Published: 17 November 2009
Abstract
To assist in the development of the Tully Water Quality Improvement Plan, a subcatchment water quality monitoring program was undertaken to identify the pollutants of concern and their land-based sources. Monitoring of suspended sediments, nutrients and pesticides in subcatchment waterways was conducted during the 2005–06 and 2006–07 wet seasons, which both had above average annual flows. We found distinct water quality signals from the basin’s major land uses (forest, grazing, urban, sugarcane and banana cultivation), except for suspended sediment concentrations, which were low across all land uses when compared with neighbouring river catchments. This reflects the high ground cover of the basin and the location of intensive agriculture on low sloping areas of the floodplain, minimising the potential for erosion. Nitrate concentrations were elevated in streams draining sugarcane, indicating fertiliser export from intensive agricultural landscapes. Residues of the herbicides diuron and atrazine were detected at sites draining sugarcane, and on occasion exceeded national ecological protection trigger values, which highlights a potential threat to downstream wetlands of recognised national significance. Herbicides were also detectable offshore in flood plumes of the Tully–Murray Rivers, with some concentrations of diuron above lowest observable effect concentrations for specific species of seagrass and corals. Run-off of nitrate and diuron were identified as key water quality issues in the Tully–Murray basin.
Additional keywords: agricultural runoff, diuron, floodplume herbicides, nitrate, water quality.
Introduction
The increasing run-off of terrestrial materials to the marine environment is a major stressor of coral reefs (e.g. Wilkinson 2004). While the Great Barrier Reef (GBR) of Australia is one of the best managed and protected marine systems, negative effects of agricultural run-off to GBR coral reefs have been reported (e.g. Fabricius et al. 2005; DeVantier et al. 2006). In 2003, the Australian and Queensland Governments established the Reef Water Quality Protection Plan (‘Reef Plan’; Anonymous 2003) to reduce the run-off of sediments, nutrients and pesticides into the GBR lagoon (Hutchings et al. 2005; Haynes et al. 2007). This objective is achieved through the development of regional Water Quality Improvement Plans (WQIP) across the GBR catchment area (see Kroon 2009).
The Tully–Murray basin (2800 km2) is situated in the Wet Tropics of north Queensland and forms one of the WQIP regions (Fig. 1a; see also fig. 1 in Kroon 2009). In the last two–three decades, the Tully–Murray coastal floodplain has undergone extensive modification largely due to the expansion of the sugarcane and horticulture (banana and pawpaw) industries (Mitchell et al. 2006). Tourism forms another key industry within the region; the township of Mission Beach is the access point to the nearby islands and their associated fringing reefs (e.g. Dunk and Bedarra Islands). These reefs, as well as other inshore coral reefs of the Wet Tropics region, are degraded due to poor water quality (and other stressors), which has been linked to the run-off of terrestrial materials from agricultural lands (Fabricius et al. 2005; DeVantier et al. 2006; Brodie et al. 2007; Wolanski et al. 2008).

|
Dissolved inorganic nitrogen run-off associated with nitrogen fertiliser loss has been identified as a major water quality issue in the Tully–Murray basin (Mitchell et al. 2001, 2006). Additionally, diuron residues have been detected in marine sediments immediately adjacent to the basin (Haynes et al. 2000a). Similar studies in other catchments of the GBR (e.g. Bramley and Roth 2002; Mitchell et al. 2005; Hunter and Walton 2008; Rohde et al. 2008; Davis et al. in press) have also demonstrated that suspended sediment, nutrient and pesticide concentrations are elevated in subcatchment waterways draining intensive agriculture, compared with catchments under natural vegetation, such as the rainforest headwater streams of the Wet Tropics region and those draining into Princess Charlotte Bay, Cape York. High seasonal river flows transport these terrestrial pollutants to the adjacent marine environment in freshwater plumes where they impinge on mangrove, seagrass and coral reef communities (Devlin and Brodie 2005; Devlin and Schaffelke 2009).
In this paper, we identify pollutant sources and characterise the water quality signals of the different land uses within the Tully–Murray basin. Our subcatchment monitoring program specifically investigated the run-off of suspended sediments (SS), nutrients and pesticides during wet season (November–April) flood events that coincide with the transport of the bulk of these materials (Mitchell et al. 1997, 2005; Furnas 2003). The Tully–Murray River freshwater plumes generated by the wet season flood events were also sampled for pesticide residues to provide a preliminary assessment of risk to the key marine ecosystems (e.g. seagrass, coral reefs) adjacent to the catchment (Fig. 1a). Specifically, the objectives of this study were to: (1) identify sources of sediments, nutrients and pesticides from specific land uses within subcatchments of the Tully–Murray basin; (2) measure concentrations of pesticide residues in the plumes resulting from major flow events in the Tully–Murray Rivers and assess the significance of these concentrations to marine ecosystem health; (3) provide high-quality input data to parameterise and validate catchment modelling (see Armour et al. 2009); and (4) assist in the identification of key water quality issues in the Tully–Murray basin for the WQIP process.
Materials and methods
Site selection within the study area
Subcatchment waterway sites were selected to represent the major land uses of the region, and were classed as sugarcane, grazing, urban, banana, or natural forest land use categories, as defined using Queensland Land Use Mapping Program data (Table 1; see Faithful et al. 2008). Sites were also selected based on wet season access to the site and the size of the waterway. A total of 16 sites were selected for the monitoring program, including 11 subcatchments of the Tully–Murray basin, as well as a transect of locations along both the Tully and Murray Rivers (Fig. 1).

|
It was expected that concentrations of SS, nutrients and pesticides measured at each subcatchment site would reflect the dominant land use of that subcatchment, as each land use utilises very different management regimes. For example, land uses such as sugarcane and horticulture use considerable rates of fertilisers and pesticides, and we thus expect to measure significant concentrations of nitrogen, phosphorus and certain pesticide residues in water draining these land uses. We also expect to see a change in the proportion of nutrient species draining these types of intensive land uses, such as a shift from the leakage of natural nutrient forms (e.g. dissolved organic nitrogen) to a dominance of dissolved inorganic nitrogen (e.g. nitrate) in fertilised cropping conditions (Brodie and Mitchell 2005).
Sampling
Over the monitoring period, considerable rainfall occurred across the Tully–Murray basin with ~3 622 000 ML and ~3 977 000 ML of discharge measured by the Tully River gauge at Euramo (Queensland Natural Resources and Water flow gauge 113006A) in the 2005–06 and 2006–07 water years respectively. These were ranked the ninth and eighth largest annual discharge volumes, respectively, on the 35-year gauge record. We note that flow discharge over these two wet seasons may have been higher due to overbank flows (see Wallace et al. 2009). Approximately 60% of the annual flow in both of these water years occurred during the wet season months January to April. During the first wet season, sampling was conducted during two small ‘first flush’ events in mid and late January 2006 to capture initial high concentration pollutant run-off from the immediate catchment area, as well as during the larger, catchment-wide flow events of late March–early April 2006 that were largely generated by Tropical Cyclone Larry. The sampling regime in the 2006–07 wet season was limited due to funding constraints, with sampling efforts focussed on the large flow events that occurred in late January–early February and March 2007. Refer to Faithful et al. (2008) for additional climate and flow data for the two monitored wet seasons.
Over the 2005–06 and 2006–07 wet seasons, 192 water samples were collected for the analyses of SS and nitrogen and phosphorus species. Ninety-two water samples were also collected for the analysis of pesticide residues. Surface water samples (top 50 cm of water column) were collected following significant rainfall events that triggered stream flow. Where possible, a stratified sampling approach to collect samples over the rising, peak and falling stages of the flow hydrograph was conducted. Water samples were collected in pre-rinsed 1-L polypropylene bottles using an extendable sampling pole for total suspended solids (suspended sediments), unfiltered nutrient samples were subsampled into 60-mL polypropylene vials (Sarstedt, Germany), with filterable nutrients filtered on-site through pre-rinsed filter modules (MiniSart 0.45 μm cellulose acetate, Sartorius, Germany) into six 10-mL polypropylene vials (Sarstedt, Australia). Nutrient samples were immediately placed on ice and frozen within 12 h of sampling. Pesticide samples were collected in 1-L solvent-washed amber glass bottles prepared by the Queensland Health and Forensic Scientific Services (QHFSS) laboratory. Where it was not possible to collect samples using the pole, samples were collected in a bucket that was rinsed with site water before sample collection. Samples were collected from the centre of the channel flow where possible and every effort was made to ensure samples were collected from the main flow, away from the backwash at the riverbank.
Surface water samples were also collected from the freshwater plumes generated by the Tully–Murray Rivers for pesticide residue analyses. Sample trips were timed to coincide with peak river discharge events on 4 April 2006 and 2 February 2007. Four and nine samples, respectively, were collected in the coastal GBR lagoon along a transect between the mouth of the Tully River and Dunk Island (Fig. 1a). The river water plume samples were collected with a bucket and rope from a research vessel and subsampled into 1-L solvent-washed amber glass bottles (supplied by QHFSS) and refrigerated.
Laboratory analyses
Water samples were analysed at the Australian Centre for Tropical Freshwater Research Laboratory, James Cook University for SS, total nitrogen (TN), total phosphorus (TP), total filterable nitrogen (TFN) and total filterable phosphorus (TFP), ammonia, oxidised nitrogen (NOx-N: nitrate + nitrite) and filterable reactive phosphorus (FRP). Samples for SS analyses were filtered through pre-weighed Whatman (England) GF/C filter membranes (nominally 1.2 μm pore size) and oven-dried at 103–105°C for 24 h and reweighed to determine the dry SS weight as described in APHA (2005). Samples for TN, TP, TFN and TFP were digested in an autoclave using an alkaline persulfate technique (modified from Hosomi and Sudo 1986) and the resulting solution simultaneously analysed for NOx-N and FRP by segmented flow auto-analysis using an ALPKEM (Texas, USA) Flow Solution II. The analyses of NOx-N, ammonia and FRP were also conducted using segmented flow auto-analysis techniques following standard methods (APHA 2005). Particulate nutrient concentrations were estimated by the subtraction of the total filterable nutrient concentrations from the total nutrient concentrations. Similarly, dissolved (filterable) organic nitrogen (DON) and phosphorus (DOP) were estimated by the subtraction of NOx-N and ammonia (for nitrogen) and FRP (for phosphorus) from the TFN and TFP concentrations.
The water samples collected for pesticide analyses were analysed by liquid chromatography mass spectrometry (LCMS) and gas chromatography mass spectrometry (GCMS) at the National Association of Testing Authorities accredited QHFSS Laboratory. The extraction procedures and analytical methods for organochlorine, organophosphorus and synthetic pyrethroid pesticides, urea and triazine herbicides are described in Lewis et al. (2009). A total of 122 pesticides were analysed, with detection limits ranging from 0.01 to 1 μg L–1 (See Table A1, available as an Accessory Publication on the web).
Results
Catchment land-use water quality characteristics
Individual subcatchment sites have been grouped within each of the five land-use categories and compared across the two monitored wet seasons for the water quality parameters SS, nitrogen and phosphorus species and the herbicides atrazine and diuron (Fig. 2a–h; Table A2, available as an Accessory Publication on the web).
|
SS concentrations were uniformly low across all land uses of the Tully–Murray basin, with median concentrations ≤25 mg L–1, except for the urban land use (65 mg L–1) in the 2006–07 wet season (Fig. 2a). The lowest SS concentrations were associated with the forest and grazing land-use categories. Some samples collected on the rising stage of flow events in both wet seasons fell into the extreme outlier range, particularly for the sugarcane land-use category with a peak of 520 mg L–1 at the Warrami Creek site (Fig. 2a).
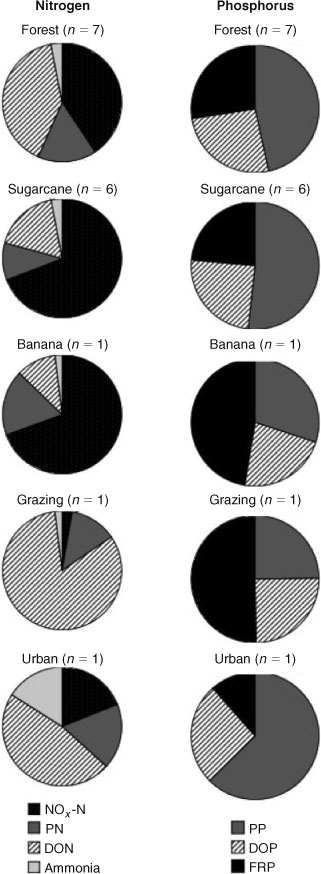
NOx-N concentrations were elevated in the sugarcane, banana and urban land-use categories compared with the forest land use (Fig. 2b). The two Kyambul sites, which have the largest percentage of the sugarcane land use in their upstream catchment areas (>60%), were only monitored in the first wet season. As a result, the median NOx-N concentration for this category was higher in the 2005–06 wet season compared with the 2006–07 wet season (i.e. 720 μg L–1 compared with 460 μg L–1) (Fig. 2b). NOx-N concentrations for the grazing land use were lower than the intensive land uses of the region, with TN dominated by other species, namely DON (Figs 2b, 3).
|
Median concentrations of PN, PP and DON were all consistently higher in the sugarcane, grazing and urban land uses compared with the forest land use (Fig. 2c–e). FRP concentrations were very low across all land uses (median ≤10 μg L–1), except the grazing land-use site (median FRP concentration of 33 μg L–1) (Fig. 2f). Elevated ammonia concentrations were also detected at the urban site (Fig. 3).
Residues of several herbicides were detected in the Tully–Murray subcatchment waterways, including ametryn, atrazine (and its degradation products desethyl and desisopropyl atrazine), diuron, hexazinone and simazine (Table A2b). The herbicides atrazine (and degradation product desethyl atrazine), diuron and hexazinone were detected frequently in the sugarcane land use, with peak concentrations of 1 μg L–1, 19 μg L–1 and 3.6 μg L–1 respectively (Fig. 2g, h, Table A2b). Pesticide residues (of those analysed; see Table A1) were not detected in the forest, banana, urban, or grazing land-use categories, except for one low level detection of diuron (0.02 μg L–1) at Davidson Creek (forest land use) during peak flow conditions in the 2005–06 wet season (Fig. 2g, h). While this site appears not to drain sugarcane (see Table 1), the sampling location is immediately proximal to sugarcane paddocks that may have influenced this particular sample.
Atrazine residues exceeded the ANZECC and ARMCANZ (2000) ecological protection trigger value (99% species protection) of 0.7 μg L–1 in 3 of the 32 samples where atrazine was detected over the two wet seasons (Fig. 2g). The ANZECC and ARMCANZ (2000) ecological protection trigger value (low reliability guideline) of 0.2 μg L–1 for diuron was also exceeded in 23 of the 36 samples where diuron was detected (Fig. 2h). Although hexazinone residues were commonly detected, concentrations were well below the ecological protection trigger value (low reliability guideline) of 75 μg L–1 (Table A2b). Ametryn, desisopropyl atrazine and simazine were detected less frequently at concentrations just above the level of analytical detection (0.01 μg L–1). While the ANZECC and ARMCANZ (2000) ecological protection trigger values are specifically designed for low flow conditions, they are the only available reference to assess the risk of pesticide residues in the freshwater environment.
Herbicide residues in the Tully–Murray River water plumes
Three herbicide residues were detected in both wet season river flood plumes, including atrazine (and its degradation product desethyl atrazine), diuron and hexazinone (Table A3, available as an Accessory Publication on the web). While these herbicides detected in the plume did not exceed the locally derived ecological protection trigger values for the GBR lagoon (GBRMPA 2009), 7 of the total 13 samples collected exceeded the current lowest observable effect concentration (LOEC) for diuron (0.1 μg L–1 for seagrass species Halophila ovalis and Zostera capricorni; Haynes et al. 2000b), which were detected at least 15 km from the river mouth (Fig. 1b). Atrazine residues were also detected in the plume to the extent of Dunk Island and the Family Island Group (Fig. 1c).
Discussion
The above average annual flows in the Tully–Murray basin during the 2005–06 and 2006–07 wet seasons allowed for an assessment of the potential exposure of land-based pollutants to downstream freshwater and marine receiving water bodies during large flow events. Specifically, the catchment to marine monitoring program was able to identify discernable differences in water quality parameters, particularly for nitrogen species and herbicides from specific land uses within the study basin, and to assess the risk of herbicide residues to adjacent marine ecosystems.
Catchment land-use water quality characteristics
Identifying sites to represent the banana and urban land-use categories was difficult in this study as natural forest (77%), sugarcane cultivation (10%) and grazing (6%) land uses dominate the Tully River catchment area. Similar proportions of land use also occur in the Murray River catchment (Table 1). The forest land use is generally confined to the upland rim of most of the basin’s subcatchments, with agriculture, grazing and urban land uses located on the lowland floodplain in much smaller proportions (Fig. 1a). As a result, a single land use cannot easily be represented in isolation from other land-use influences, and the water quality signal from a particular land use of interest may be diluted by the subcatchments’ major land use (e.g. forest or sugarcane). For example, Marquette Creek, which was chosen to represent the banana land-use category, only contains 4.6% banana in the small upstream catchment area (31 km2), with the remainder of the catchment consisting primarily of natural forest. The median NOx-N concentration for this site was only slightly elevated over that of the forest land-use category, suggesting that the water quality influence of bananas has been diluted.
Catchment disturbances have resulted in only minor increases in sediment loss in the Tully–Murray basin, with median SS concentrations only slightly elevated for the urban and sugarcane land-use categories compared with the forest land use (Fig. 2a). The introduction of green cane trash blanketing and minimum tillage practices over the past two decades by the sugarcane industry has resulted in considerable reductions in soil erosion from this land use (Rayment 2003). The range of SS concentrations found in this study (0.2–170 mg L–1) are also consistent with the long-term dataset (10–250 mg L–1) collected over the time periods 1989–1991 and 1995–2000 at the Tully River (Euramo) site (Mitchell and Furnas 2001; Mitchell et al. 2006). SS concentrations measured in this basin are lower than those measured in neighbouring catchments with similar rainfall regimes and land uses, including the Herbert River (range of 50–800 mg L–1; Mitchell et al. 1997), Johnstone River (10–1200 mg L–1; Hunter and Walton 2008) and Mackay Whitsunday catchments (5–1600 mg L–1; range excludes a developing urban site; Rohde et al. 2008). The low SS concentrations measured in the Tully–Murray basin are indicative of lower erosion rates due to high ground cover resulting from regular, year-long rainfall and the location of intensive agriculture mainly on low slope areas of the floodplain. In contrast, SS concentrations are much higher in the Burdekin River catchment (20–14 000 mg L–1; Bainbridge et al. 2007), which is dominated by rangeland beef grazing in a dry tropical rainfall regime, where ground cover is considerably lower leaving soils more exposed and erosion prone (e.g. Scanlan et al. 1996). Our results indicate that the run-off of SS is a relatively low concern in the Tully–Murray basin. However, a component of the SS load discharged from the Tully–Murray Rivers is transported to the adjacent inshore fringing reefs (Devlin and Brodie 2005) and may therefore influence turbidity on these reefs (see Wolanski et al. 2008).
The run-off of NOx-N was particularly elevated in the sugarcane land-use category, which indicates the run-off of fertilisers applied by this industry (Fig. 2b). In both the sugarcane and banana land uses, NOx-N contributed a high proportion (~70%) of TN compared with the other land uses (Fig. 3; see also Armour et al. 2009). Mitchell et al. (2009) demonstrated that a linear relationship exists between subcatchment NOx-N concentrations and the percentage of fertiliser-additive land use in the upstream catchment area, proving the link to fertiliser application. The slightly elevated median NOx-N concentration (250 μg L–1) for the forest land use in the second wet season can be partially explained by several forest land-use sites that contain small areas of non-forest land uses, including sugarcane (0.6%) at Bulgun Creek, bananas (2.5%) at Jarra Creek and grazing/dairy (6.7%) at the Tully Gorge (Table 1). In comparison, the upstream Murray River (Murray Falls) site, which drains a catchment area only of natural forest, had a median NOx-N concentration of 7 μg L–1 across the two monitored wet seasons, and is considered most representative of the forest land-use category. Typically the natural leakage of nitrogen is the dissolved organic fraction (Harris 2001; Perakis and Hedin 2002; Brodie and Mitchell 2005), with a shift to the more bioavailable inorganic fraction seen in fertilised cropping lands in neighbouring Wet Tropics catchments (e.g. Brodie and Mitchell 2005; Hunter and Walton 2008) and catchments worldwide (Carpenter et al. 1998). NOx-N run-off has been found to disrupt downstream marine ecosystems (Fabricius 2005; Brodie et al. 2007) and has been linked to the degradation of coral reefs in many parts of the world (e.g. Lapointe et al. 2005). The highly elevated concentrations of NOx-N (median ~600 μg L–1) in the sugarcane-dominated subcatchments compared with natural forested subcatchments (e.g. Murray Falls; median 7 μg L–1) show that run-off from fertiliser intensive industries is a key water quality issue in the Tully–Murray basin.
The elevated concentrations of PN and DON in the sugarcane, grazing and urban land uses (Fig. 2c, d) likely reflect the location of these land uses on rich lowland soil types that also have a long history of nutrient enrichment through fertiliser use and mill mud application. The elevated ammonia concentrations detected at the urban land-use site (Fig. 3) may be associated with unsewered (septic) residential leachate as found in the neighbouring Johnstone River catchment (see Hunter and Walton 2008). The concentrations of all forms of phosphorus species were low across all land uses in the Tully–Murray basin and reflect the low soil erosion in the region, as phosphorus may be strongly bound to the soils (i.e. in the particulate form). Studies on selected soils in the adjacent Herbert River catchment have shown that the potential for phosphorus loss is generally not high (Bramley et al. 2003). One exception was the elevated FRP measured in the grazing land-use site, which may be associated with the application of superphosphate for improved pastures (Jones 1990).
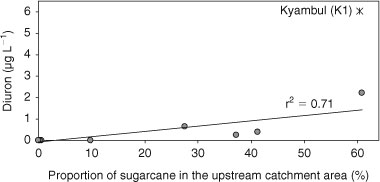
The herbicides diuron, atrazine (including its degradation product desethyl atrazine) and hexazinone were frequently detected in waterways draining the sugarcane land use during both monitored wet seasons (Fig. 2g, h). Similarly to the relationship between nitrate concentrations and fertilised land use outlined in Mitchell et al. (2009), a linear relationship exists (r2 = 0.71) between mean diuron concentrations and the proportion of sugarcane land use in the upstream catchment area (Fig. 4). This implies a fairly uniform application rate of these herbicides across the sugarcane industry within the Tully–Murray basin. A site at Kyambul (K1) proved to be an exception with a much higher mean concentration than the trend; this discrepancy may represent a sampling artefact with only four pesticide samples collected from this site. The herbicides detected in this study area are also utilised by the sugarcane industry in other GBR catchments, and have been commonly detected in subcatchment waterways associated with this land use (Rohde et al. 2008; Stork et al. 2008; Davis et al. in press). While the detection of diuron, atrazine, hexazinone and ametryn are all sourced to the sugarcane industry, simazine residues, detected only at the downstream Murray River site, are probably associated with plantation forestry (see McMahon et al. 2005) located in the upstream catchment area (Fig. 1). While simazine was detected at concentrations below the ANZECC and ARMCANZ (2000) ecological protection trigger value (99% species protection) of 0.20 μg L–1, the run-off of this herbicide may become a water quality issue for the region with any future expansion of the plantation forestry industry.
|
The ANZECC and ARMCANZ (2000) ecological protection trigger value (low reliability guideline) for diuron (0.2 μg L–1) was frequently exceeded. This indicates a potential risk to the freshwater bodies of the Tully–Murray basin, which include a series of wetlands listed on Australia’s National Directory of Important Wetlands (ANCA 1996). To date, there have been limited ecotoxicological studies undertaken to assess the risk of herbicide exposure on northern Australian tropical freshwater and estuarine aquatic organisms (see Davis et al. in press). As such, the risk of these herbicides on downstream freshwater environments, including the potential cumulative effects resulting from the presence of several of these herbicides is largely unknown.
Herbicide residues in the Tully–Murray River flood plumes
Similarly to the catchment herbicide results, diuron also had the highest concentrations measured in the flood plumes. In the 2007 plume, diuron residues were detected at biologically significant concentrations 15 km from the river mouth to the extent of Dunk Island and the Family Island Group and associated fringing reefs and nearby seagrass beds. Detected concentrations exceeding LOEC of 0.1 μg L–1 for the seagrass species Halophila ovalis and Zostera capricorni (Haynes et al. 2000b), and LOEC of 0.3 μg L–1 for the coral species Acropora formosa and Seriatopora hystrix (Jones and Kerswell 2003) indicates a risk to coral and seagrass ecosystems within this inshore area (see also Lewis et al. 2009). Further, the impact of diuron on marine plants (e.g. coral zooxanthellae, seagrass, macroalgae) is likely to be enhanced by the additive effects that may result from the combination of this herbicide with residues of atrazine and hexazinone also detected in the plume, which, like diuron are photosystem II inhibitors (Jones et al. 2003; Bengtson Nash et al. 2005, 2006).
In conclusion, this monitoring program has identified both the water quality characteristics of the major land uses of the Tully–Murray basin as well as the water quality issues of concern to the region. The highly elevated run-off of NOx-N from the sugarcane land use indicates the loss of fertiliser from intensive agricultural landscapes. This finding is consistent with previous studies and suggests that NOx-N run-off is a key water quality issue in the region with the potential to disrupt downstream freshwater and marine ecosystems. The frequent detection of diuron, atrazine and hexazinone residues in the waterways draining sugarcane also indicate a risk to downstream freshwater and marine ecosystems where nationally derived ecological protection trigger values have been exceeded. These residues can be traced offshore as far as the Dunk Island and Family Island Group at concentrations known to have negative effects on seagrass and coral reef communities. The success of the WQIP is dependent on the management of these key pollutants identified in this study.
Acknowledgements
This study was supported by the Terrain Natural Resource Management Tully Water Quality Improvement Plan. We gratefully acknowledge the catchment field support provided by Laurence Liessmann, Shane Blowes and Vern Veitch (ACTFR) and David Green (Queensland Natural Resources and Water). Pesticide samples from the 2007 flood plume were collected in conjunction with Marine and Tropical Sciences Research Facility Projects 3.7.1 and 3.7.2, with acknowledgement to Dr Katharina Fabricius and Dr Tim Cooper (Australian Institute of Marine Science) for the collection of these samples. Acknowledgement is also extended to Dr Jochen Mueller (University of Queensland, National Research Centre for Environmental Toxicology) for supplying pesticide data from the 2006 flood plume and Dr Britta Schaffelke (AIMS) for the collection of these pesticide samples. Appreciation is given to QNRW and Bureau of Meteorology for access to stream flow and rainfall gauging station data. We would also like to acknowledge two anonymous reviewers for their improvements to the manuscript, and the Guest Editor (Dr Frederieke Kroon) for further helpful comments.
Armour, J. D. , Hateley, L. R. , and Pitt, G. L. (2009). Catchment modelling of sediment, nitrogen and phosphorus nutrient loads with SedNet/ANNEX in the Tully–Murray basin. Marine and Freshwater Research 60, 1091–1096.
Bengtson Nash, S. M. , McMahon, K. , Eaglesham, G. , and Müller, J. F. (2005). Application of a novel phytotoxicity assay for the detection of herbicides in Hervey Bay and the Great Sandy Straits. Marine Pollution Bulletin 51, 351–360.
| Crossref | GoogleScholarGoogle Scholar | CAS | PubMed |
Harris, G. P. (2001). Biogeochemistry of nitrogen and phosphorus in Australian catchments, river and estuaries: effects of land use and flow regulation and comparisons with global patterns. Marine and Freshwater Research 52, 139–149.
| Crossref | GoogleScholarGoogle Scholar | CAS |
Mitchell, A. , Reghenzani, J. , Faithful, J. , Furnas, M. , and Brodie, J. (2009). Relationships between land use and nutrient concentrations in streams draining a ‘wet-tropics’ catchment in northern Australia. Marine and Freshwater Research 60, 1097–1108.
Scanlan, J. C. , Pressland, A. J. , and Myles, D. J. (1996). Run-off and soil movement on mid-slopes in north-east Queensland grazed woodlands. The Rangeland Journal 18, 33–46.
| Crossref | GoogleScholarGoogle Scholar |
Wolanski, E. , Fabricius, K. E. , Cooper, T. F. , and Humphrey, C. (2008). Wet season fine sediment dynamics on the inner shelf of the Great Barrier Reef. Estuarine, Coastal and Shelf Science 77, 755–762.
| Crossref | GoogleScholarGoogle Scholar |
