

Relationships between land use and nutrient concentrations in streams draining a ‘wet-tropics’ catchment in northern Australia
A. Mitchell A E , J. Reghenzani B , J. Faithful A C , M. Furnas D and J. Brodie AA Australian Centre for Tropical Freshwater Research, James Cook University, Townsville, Qld 4810, Australia.
B Terrain Natural Resource Management, PO Box 1293, Ingham, Qld 4850, Australia.
C Present address: Golder Associates, Calgary, Alberta T2P 3T1, Canada.
D Australian Institute of Marine Science, PMB No. 3, M.C., Townsville, Qld 4810, Australia.
E Corresponding author. Email: alan.mitchell@jcu.edu.au
Marine and Freshwater Research 60(11) 1097-1108 https://doi.org/10.1071/MF08330
Submitted: 1 December 2008 Accepted: 15 September 2009 Published: 17 November 2009
Abstract
Differences in stream nutrient concentrations typically reflect upstream differences in land use. In particular, nitrate concentrations are greatly increased by losses from nitrogen (N) fertiliser applied to areas of intensive cropping. In the present study, a relationship between the area of such land use and the nitrate concentrations in the receiving streams was predicted. This relationship was tested using several data sets from the Tully basin, in the wet-tropics bioregion of north Queensland, Australia. The proportions of fertiliser-additive land use (FALU), mostly sugarcane and bananas, were correlated with the concentrations of nutrients in streams that drain these land uses. The data compared included two long-term sampling studies in the Tully River catchment and more recent, broader catchment sampling and plot-scale studies in this region. A strong relationship was shown for nitrate, but weaker relationships were observed for other N-nutrient and P-nutrient forms. Comparisons were made with contemporary and historical land-use changes in the Tully basin. The strong relationship of FALU with nitrate provides evidence that the nitrate exports from this catchment are largely derived from fertiliser use. This relationship can be used to derive nitrate run-off coefficients for fertilised land use in catchment models or to monitor changes following management to reduce fertiliser usage.
Additional keywords: fertiliser-additive land use, key pollutants, nitrate, north Queensland, Tully basin, Tully River.
Introduction
Changes in nutrient concentrations at a downstream sampling site are generally assumed to be related to land use upstream and there is considerable support for this assumption. A comprehensive analysis of land use–nutrient export relationships was made by Beaulac and Reckhow (1982), in which nutrient export coefficients were established for row and non-row crops, pasture and grazing land, manure storage areas from feedlots, mixed agricultural watersheds and urban areas. A compilation of nutrient export coefficients (termed nutrient generation rates) for the major land-use types, forest, grazing, cropping, horticulture and urban areas, was published by Young et al. (1996) for both Australian and international locations. However, these relationships were generally from temperate areas and few measurements were included from tropical river catchments. The nutrient run-off issue is of particular concern for tropical river catchments adjacent to the Great Barrier Reef (GBR) because of possible downstream impacts of additional nutrients on this coral reef ecosystem (Fabricius 2005; DeVantier et al. 2006; Brodie et al. 2007a).
In the tropics, the lowest nutrient concentrations and export coefficients are typically observed in streams draining pristine, forested areas (Meybeck 1982; Lewis et al. 1999). For example, low nutrient and suspended sediment concentrations have been documented in pristine streams of tropical north Queensland, Australia (Brodie and Mitchell 2006), including the Tully River catchment (Faithful and Brodie 1990). By contrast, in the Moresby catchment of north Queensland, dominated by sugarcane (>50% area), fertiliser inputs accounted for 99% and 98% of the total annual nitrogen (N) and phosphorus (P) inputs respectively, whereas their removal in sugarcane crops was just 36% and 57% respectively (Eyre 1995). The remaining N and P inputs are assumed to be stored in catchment soils (particularly P), lost via run-off and to groundwater or, in the case of urea-applied N, through volatilisation of ammonia (Moody and Chapman 1991). In fact, only ~40% of applied N and P fertiliser is estimated to be incorporated into the most common tropical crop, sugarcane (Moody et al. 1996; Reghenzani et al. 1996).
Relatively few attempts have been made to directly link the proportion of different tropical agricultural land uses with the concentrations of nitrate or other nutrients in the receiving streams. Biggs et al. (2004) found increasing nutrient concentrations in the Brazilian Amazon basin with an increasing proportion of deforestation, and Wickham and Wade (2002) modelled higher N and P risk estimates as a function of lower percentage forest in the watershed. Benson et al. (2006) used a GIS approach to predict groundwater nitrate concentrations using the proportion of coverage by different crops. Howarth et al. (2002) showed increasing total nitrogen (TN) concentrations with rising N fertiliser application, population density and anthropogenic nitrate or ammonia depositions. Tirado (2007) also showed an increasing relationship between nitrate concentrations in nearby wells of an intense agricultural region of Thailand and increasing fertiliser application rates.
Evidence from many studies has shown that increased agricultural land use has led to increased soil erosion and nutrient loss from GBR catchments (Furnas 2003). The downstream impacts of this run-off into GBR waters are of major concern; however, the direct effects of agricultural run-off on reef communities have been difficult to measure and are, as a result, controversial. Recent research (Fabricius et al. 2005; DeVantier et al. 2006) has shown a decline in hard-coral richness within the latitudinal zone of 14–18°S, together with an increase in chlorophyll a concentrations in the central inshore GBR lagoon (Brodie et al. 2007a). This zone of apparent change lies adjacent to coastal catchments with high levels of fertiliser-additive land use (FALU), mostly sugarcane, which is relatively close to the GBR.
In the present study, we examine potential relationships between the area of fertilised land use and the concentrations of nutrients in receiving streams in the Tully basin, tropical Queensland, Australia. Considerable areas of the Tully basin have been deforested and cleared, and sugarcane, grazing and horticulture (bananas) have developed as the main agricultural land uses (Fig. 1; Kroon 2008; Armour et al. 2009). The rivers of this basin discharge directly into the GBR lagoon, at a distance of just 15–25 nautical miles from the GBR mid-shelf reefs. The extent of flood plumes and exposure of marine ecosystems in the Tully coastal region have recently been outlined by Devlin and Schaffelke (2009). Given that fertilised crops are generally the largest, non-point source of nitrate run-off, we predict a positive relationship between the areas of fertilised land use and the concentrations of nitrate in the streams draining these areas. In the Tully basin, sugarcane and banana crops comprise almost all of the FALU. To test our prediction, we correlate the proportion of FALU above each sampling site against nutrient concentrations, particularly nitrate, in the receiving streams. Although this simple relationship is relatively crude, it should provide a relative measure of the inputs of nitrate from fertiliser to the catchment and establish a benchmark for future reductions in fertiliser applications.

|
Materials and methods
The data analysed in the present study are from sampling sites in three catchments within the Tully basin, the Tully, Murray and Hull River catchments (Fig. 1).
Nitrogen and P nutrient forms were considered as well as total suspended sediments (TSS). The forms of N examined included nitrate (NO3) and nitrite (NO2), which combine into ‘nitrate’ (NOX-N form), ammonia (NH4-N), which combines with ‘nitrate’ into dissolved inorganic nitrogen (DIN = NOX + NH4), and dissolved organic nitrogen (DON) and particulate nitrogen (PN), which combine with DIN into TN. The forms of P examined include phosphate (PO4-P, also known as filterable reactive phosphorus, orthophosphate or dissolved inorganic phosphorus), dissolved organic phosphorus (DOP) and particulate phosphorus (PP), which combine into total phosphorus (TP). All nutrients are expressed in μg L–1 of the element and TSS is expressed in mg L–1 units.
The subcatchment sampling sites represent a range of near-pristine (rainforest), agricultural and urban influences (Fig. 1; Table 1). The exact locations of the sugarcane and banana farms are not shown because of a confidentiality agreement. Most samples were collected near the centre of the stream from bridges. For the Australian Institute of Marine Science–Bureau of Sugar Experiment Stations (AIMS–BSES) studies, single or duplicate samples were collected and all were subsampled in duplicate for the analyses. The means of these replicates were compared in the present study. Single samples were collected by Faithful et al. (2007, 2008), Bainbridge et al. (2009) and Prange et al. (2007).

|
Water-quality data were collected for several years in the Tully basin (Mitchell et al. 2001, 2007; Furnas 2003; Reghenzani 2003). A long-term, surface sampling study was conducted between 1987 and 2000 by the AIMS and the BSES (Tully Office) at a lower Tully River site (Euramo, site 17, Fig. 1; AIMS–BSES Study 1). Regular monthly samples were collected plus many additional samples during rainfall events, with the objective of describing the nutrient dynamics of the wet seasons when most export occurs. Monthly surface sampling with occasional, additional wet-season sampling was also undertaken at other subcatchment sites within the Tully River catchment over a shorter period from 1987 to 1995 (sites 3, 4, 5, 7 and 20, Fig. 1; AIMS–BSES Study 2). The Upper Banyan site was only sampled from late 1990. Two more recent studies have also been conducted. Bainbridge et al. (2009) completed sampling commenced by Faithful et al. (2008) in other subcatchment locations in the Tully River area from 2005 to 2007 (other sites + Euramo, Fig. 1) and Prange et al. (2007) sampled at the Euramo site from 2004 to 2006.
Recent plot-scale studies were also conducted in the Tully River catchment to examine losses from both sugarcane and banana cultivation, the two dominant, intensive agricultural land uses of the Tully River catchment (Faithful and Finlayson 2004, 2005; Faithful et al. 2007). Farm run-off was measured directly from farm drains, with the sampling conducted during wet-season conditions, which is the most relevant period for likely maximum nutrient loss. Because of their farm scale, these studies provided nutrient loss values for lands near 100% fertilised cropping.
The methods of collection and analysis of the samples are detailed in Mitchell et al. (2001, 2007), Furnas (2003), Faithful et al. (2007, 2008), Bainbridge et al. (2009) and Prange et al. (2007). There were differences in processing and analysis between these sample sets. Water samples from sample sets 1 and 2 were mostly processed at the BSES laboratory within 3 h of collection, whereas some were processed on site (when collected by an AIMS representative). Sample sets 3, 4 and 5 were processed on site within 1 h of collection. For dissolved nutrients, all water samples were pre-filtered by plastic syringe into 10-mL Sarstedt polypropylene vials, sample sets 1 and 2 using pre-rinsed Whatman GF/F filters (nominal porosity 0.7 μm), and sample sets 3, 4 and 5 using Sartorius Minisart filter modules (0.45-μm pore size). These vials were frozen for later analysis. For PN and PP, sample sets 1, 2 and 5 were separately filtered onto pre-combusted, 25-mm diameter, Whatman GF/F filters, folded over in half, wrapped in foil and frozen for later analysis. For sample sets 3 and 4, unfiltered aliquots were used for PN and PP determinations, as the difference between TN/TP and total filterable N/P (TFN, TFP). For TSS analyses, 1-L samples were filtered through pre-weighed Sartorius membrane filters (0.4-μm pore size; sample sets 1, 2 and 5) or pre-weighed Whatman GF/C filters (nominal porosity 1.2 μm; sample sets 3 and 4).
Chemical analyses of the water samples were carried out at two laboratories. The AIMS laboratory analysed sample sets 1, 2 and 5, whereas sets 3 and 4 were analysed by the laboratory of the Australian Centre for Tropical Freshwater Research (ACTFR) at James Cook University. All dissolved nutrient concentrations were determined by segmented flow autoanalysis, with samples for TN, TP, TFN and TFP (ACTFR laboratory; sample sets 3 and 4) pre-digested using an alkaline persulfate technique. This digestion technique was also used for the separate PN and PP samples (AIMS laboratory; sample sets 1, 2 and 5). The DON and DOP samples were separately oxidised by the AIMS laboratory using 12-h ultraviolet oxidation before segmented-flow analysis. The differences in the processing and analysis may have resulted in small differences in DON, DOP, PN and PP between the two laboratories. However, the processes and analyses for the dissolved inorganic nutrients (NOX, NH4 and PO4) and TSS were essentially the same, with close results obtained from historical inter-calibration exercises.
The 2005 version of the Queensland Land Use Mapping at Plot Scale (QLUMP) GIS program was used for the land-use analyses, to be relevant with most data sets. This version had land-use classification dates of 1999–2003 (Mitchell et al. 2007). For each sampling point, polygons were drawn up to the top of each respective subcatchment to describe the likely land-use influence on the site, using ArcView GIS 3.2, intersected with QLUMP and the results corrected for area. The land uses were grouped into major categories using the Australian Land Use Model (ALUM) classification and tabulated by area.
Results
General
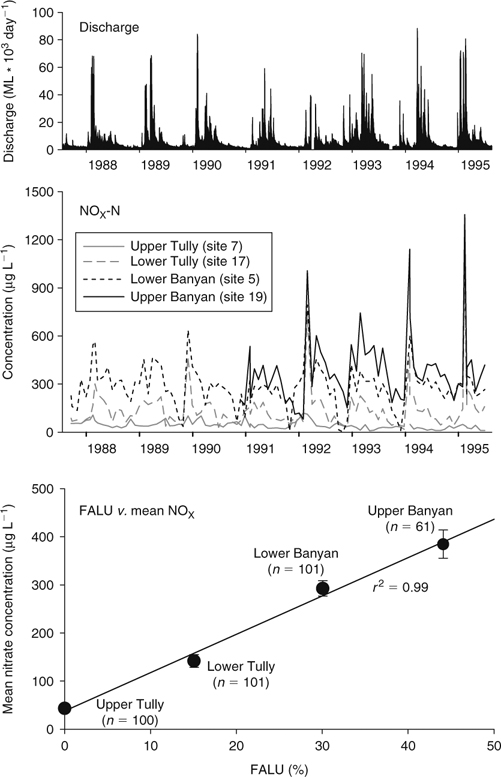
The major land-use categories and associated sampling sites, the proportion of land-use categories per sampling site, and the sampling counts in the Tully, Murray and Hull River catchments are given for each of the different sampling programs (Table 1, Fig. 1). Discharge patterns in the Tully River at Euramo from 1987 to 1995, covering monthly subcatchment sampling by the AIMS–BSES program, demonstrate multiple discharge peaks of short duration in each wet season (November–May), reducing in the dry season (June–October) (Fig. 2, top graph). The Tully River flows all year.
|
Relationships between nitrate and FALU
The mean annual concentrations of nitrate from four sites with varying agricultural influence are plotted from 1987 to 1995 (Fig. 2, middle graph). For consistency, only monthly data from 1987 to 1995 at the Lower Tully site (site 17, Fig. 1; AIMS–BSES Study 1) are compared with the monthly data for the other three sites (sites 7, 19 and 20; AIMS–BSES Study 2). At the beginning of each wet season, a spike in nitrate concentrations was usually observed, even with just monthly sampling. Lower nitrate concentrations were observed through the dry season in the absence of substantive, mobilising rainfall.
Each year, this seasonal pattern is reflected at all four sites, although to a lesser degree at the upper Tully site (site 7, Tully Gorge). However, progressively higher nitrate concentrations are clearly observed in the series of line plots, from the upper Tully River (bottom curve with 0% FALU above the site) to the lower Tully (15% FALU), lower Banyan Creek (30% FALU) and upper Banyan (top curve with 44% FALU) (Fig. 2, middle graph). These spatial differences in nitrate concentrations appear to be largely driven by the positive relationship with FALU (Fig. 2, bottom graph; r2 = 0.99, P < 0.005). Only monthly data at the Lower Tully site from 1987 to 1995 are used, to be consistent with this overall comparison.
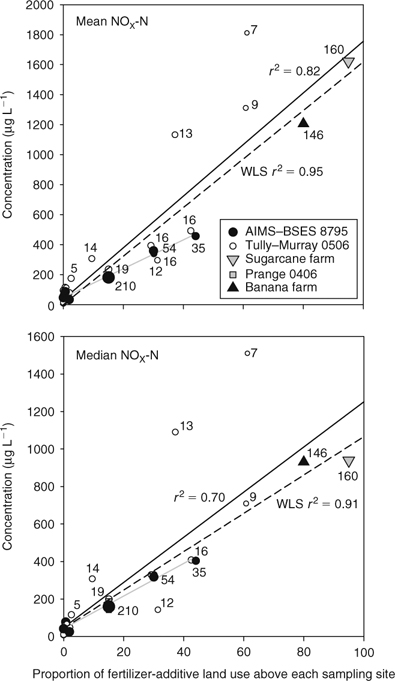
We regressed wet-season mean and median nitrate (NOX-N) concentrations and the proportion of FALU above each water-sampling site for all five sampling series (Fig. 3, top and bottom graphs; Table 1, Series 1–5). Least-squares (LS) linear regressions showed a reasonably good fit between rising nitrate concentrations and increasing percentage FALU (mean, r2 = 0.82, P < 0.001; median, r2 = 0.70, P < 0.001). A weighted least-squares(WLS) regression, in which the number of samples was used as the weighting variable, showed a better visual fit between the two variables, with higher correlation coefficients (mean, r2 = 0.95, P < 0.001; median, r2 = 0.91, P < 0.001). The weighting in this latter regression is a measure of statistical confidence in the means or medians of the sampled sites.
|
Relationships between other nutrients and FALU
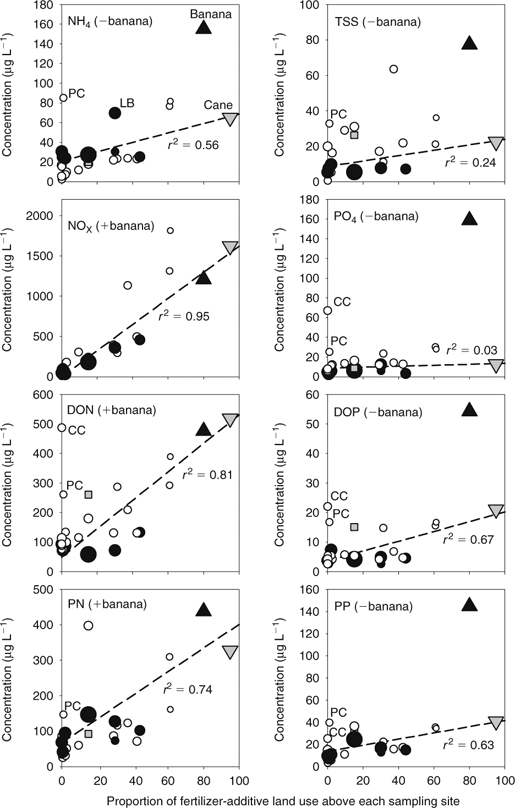
Finally, we regressed the wet-season mean concentrations of all N-nutrient and P-nutrient forms (except nitrate) and TSS concentrations and the proportion of FALU above each water-sampling site for all five sampling series (Fig. 4; Table 2). In contrast to nitrate, the WLS regressions showed that FALU was considerably weaker in predicting the mean concentrations of other N and P forms and TSS. The r2 values ranged from 0.03 (PO4) to 0.81 (DON). We excluded the banana farm site data from the WLS regression lines for NH4, TSS, PO4, DOP and PP because runoff concentrations from this farm site were obviously higher than those from the sugarcane plot.
|

|
Discussion
The spike in nitrate concentrations at the beginning of each wet season represents the ‘first flush’, when high levels of nitrate that have accumulated in the near-surface soils during the dry season are readily flushed out by the first significant rainfalls of the season (Fig. 2, middle graph). These concentration effects, as a result of flushing of nutrients through the soil profile (Webb and Walling 1985), are progressively diminished through the course of the wet season as N stocks become exhausted. During flood events in the Tully River, nitrate concentrations rise with increasing discharge to a broad peak between 10 000 and 40 000 mL day–1, beyond which higher discharge leads to falling nitrate concentrations (Mitchell et al. 2007). Wallace et al. (2009) showed that over-bank floods in the Tully River occurred at discharges greater than 40 000 mL day–1 and that these floodwaters had low concentrations of nitrate, but relatively high concentrations of DON. Hence, it appears that dilution of nitrate commences at a discharge of ~10 000 mL day–1, whereas beyond 40 000 mL day–1 further reduction occurs when the waters flood over onto the broader coastal plain. These additional losses from surface waters presumably result from plant uptake, denitrification (Weier 1994, 1999) and leaching to soils and groundwater (Thorburn et al. 2003; Stewart et al. 2006).
Our regressions of nutrient concentrations with FALU show a very strong relationship with nitrate, but weaker or non-existent correlation with other nutrient forms (Figs 2–4). One reason for the differences in the predictive power of FALU for nitrate and other nutrient forms is that nitrate and ammonia (the latter of which is thereafter mostly converted by nitrification to nitrate) are the nutrient forms most readily leached from the applied N fertiliser used by sugarcane and banana growers (Weier 1994). These fertilisers are mostly urea and high-analysis NPK (J. Pulsford, pers. comm., 2000). Typically, N fertiliser is applied to sugarcane crops in the spring, soon after planting, but before the summer wet season to reduce fertiliser run-off (Selim et al. 2000; Ng Lee Kwong et al. 2002). The concentrations of other N-nutrient forms increased with rising FALU, 11-fold for DON and 6-fold for PN (Fig. 4). For TSS and the P-nutrient forms, small increases were observed with rising FALU percentage at most sites, including the sugarcane farm, though not as much as the increases observed at the banana farm.
Our results demonstrate that nitrate concentrations are strongly correlated with FALU, for both the monthly-sampled, AIMS–BSES data sets covering the whole year and for the wet-season data of all sampling series. The increase factor in the mean nitrate concentration from 0% FALU (Upper Tully site, 46 μg L–1) to 100% FALU (1618 μg L–1) is 35-fold (Fig. 3). For median wet-season concentrations (0% FALU, 41 μg L–1; 100% FALU, 1065 μg L–1), the increase factor is 26-fold. Given that the Upper Tully site has considerable disturbance upstream, including Koombooloomba Dam, several roads and ongoing tourism activities such as rafting, it is likely that these increase factors would be even higher if more pristine rainforest sites from north Queensland were used for the 0% FALU site in the analysis. Brodie and Mitchell (2006) documented considerably lower nitrate concentrations in a larger study of pristine streams in north Queensland involving mostly wet-season sampling (mean 37 μg L–1; median 19 μg L–1; n = 695). Moreover, the proportional contribution of DIN (mostly nitrate) from sugarcane and banana land use is estimated to be 85% in the Tully River catchment (Brodie et al. 2007b) and 84.5% in the Tully basin (Armour et al. 2009).
The results of the present study strongly indicate that most of the nitrate in these catchment streams is derived from N fertiliser and not from any other source. The most logical point source of nutrients in the Tully catchment is the Tully Sewerage Treatment Plant (STP), which drains into Banyan Creek, just above site 20 (lower Banyan), but below site 19 (upper Banyan). However, although STP inputs appear to affect ammonia and phosphate concentrations at the lower Banyan Creek site (Table 2), the effect on nitrate appears minimal by comparison with farm run-off. On the basis of our FALU analysis, we suggest that the clearing of natural forest in these catchments and the conversion to fertilised land use has increased wet-season nitrate exports, at the farm gate, by at least 26–35-fold (median and mean respectively). Armour et al. (2009) reported a DIN ‘delivery ratio’ referred to here as an ‘export ratio’ of 5.8-fold higher for sugarcane land in the Tully–Murray basin than would be expected on area alone. The DIN export ratio of 5.8 was calculated by dividing the percentage of DIN contributed by sugarcane by the percentage area of sugarcane in the catchment. Using this calculation method and their reported data, the forest areas of this basin (71.2% of total area) have a DIN export ratio of just 0.13-fold than expected on area. Dividing the export ratio for sugarcane by the export ratio for forest in the Tully basin gives a multiple of 46-fold, similar to our range of increase. Applying the same formula to data from the neighbouring Johnstone catchment where a 6-year study was conducted (Hunter and Walton 2008), the export ratios given for nitrate were 5.0-fold for sugarcane and 7.5-fold for bananas compared with 0.16-fold for forest, leading to multiples of 31-fold and 47-fold respectively. Hence, compared with natural forest, ~26–47-fold more nitrate is exported from fertilised land.
There are several uncertainties with our analysis. First, the samples were collected over a long time period, during which changes in land use and fertiliser application rates occurred. Within the overall 13-year AIMS–BSES sampling period to 2000, sugarcane and banana cropping expanded by 30% and 50%, respectively, although only approximately half of this change is estimated to have occurred during the initial 7-year period (1987–1995) (Mitchell et al. 2007). Since 2000, no expansion of sugarcane has occurred in the Tully–Murray–Hull catchments (Australian Sugar Year Book, volumes 58–65, 1999–2006), although any further expansion of the banana industry is unknown. The fertiliser application rate on sugarcane has declined by 25% since 2000, whereas the banana application rate has declined by 40% since 1995 (Kroon 2008), with probable further declines during the overall 20-year period of sampling (1987–2007).
Second, the separate LS regression for nitrate at the AIMS–BSES sites is of a slightly lower slope than the regression lines for the whole data collection (Fig. 3). This slope difference could imply a change in nitrate concentrations between the earlier and later data sets (1987–1995 and 2005–2007, respectively), potentially because of differences in upstream land uses, differences in laboratory analyses and/or better predictive regression curves. The estimates of farmland use above the sugarcane and banana farms collection sites (95% and 80%, respectively) were only educated guesses. If the true farmland areas sampled were effectively 100%, the overall regression line slopes would be depressed lower. The QLUMP version used here had land-use classifications made between 1999 and 2003. Most of the recent agricultural expansion occurred between 1987 and 1999, although only a small increase in nitrate concentrations was observed during this period, under low-flow conditions (Mitchell et al. 2001). The mean nitrate concentrations at the Euramo site (#17) varied inconsistently between the various studies (Table 2), so it seems unlikely that small differences in nitrate analyses between the two laboratories could account for the differences in earlier and later data sets.
Finally, the true relationship may be better defined by an upwardly rising quadratic curve because downstream nitrate concentrations will be affected by in-stream processes, such as uptake by vegetation, denitrification and transport to groundwater. Further reductions occur over the coastal plain during bank overflows (Wallace et al. 2009). These factors raise the issue of scaling of the subcatchment areas sampled and the extrapolation of measurements from small areas to the whole catchment. Our sampling areas varied from plot scale (1.5–14 ha) to catchment scale (Euramo, site 17, 148 000 ha), that is, a size range over five orders of magnitude (Table 1). A plot of the nitrate concentrations and the sizes of the sampled areas would have a negative slope, driven by these two end points. Because of losses associated with in-stream processes, the surface, nutrient delivery ratio from farms and other sources to the mouth of the Tully River will be less than 100%. Indeed, the likely rising quadratic curve of increasing nitrate concentrations with FALU (Fig. 3) effectively represents the nitrate input curve. In contrast, the nitrate export curve must be somewhat lower than the input curve because of in-stream losses. We do not know the extent of these in-stream losses over the whole catchment, but suspect that they are low (Thorburn et al. 2005) because the Tully River is a relatively short, rapidly flowing river, particularly during the wet season. Armour et al. (2009) assumed a loss of just 1.8%, only from denitrification. Using their loads for DIN, estimated using the ANNEX (Annual Nutrient Export) catchment nutrient-budget model for the whole Tully–Murray basin, the DIN delivery ratio is calculated to be 98%. Hence, if in-stream losses are small, the true nitrate export may still be defined by an upwardly rising quadratic curve, although slightly lower than the input curve.
The mean FALU-determined concentration of nitrate may be checked against load estimates made for the Tully River. The mean nitrate (NOX) load, adjusted to a mean annual discharge of 3 137 000 mL, was calculated as 513 tonnes at Euramo, based on the nutrient concentrations for each year of the AIMS–BSES sampling study (1987–2000) (Mitchell et al. 2007). Allowing for the 15% sugarcane area that lies below the Euramo sampling site, the total nitrate (NOX) load for the Tully River catchment is estimated to be ~590 tonnes. Assuming that 85% of the annual DIN load for the Tully River catchment is sourced from fertilised agriculture in this catchment (Brodie et al. 2007b; Armour et al. 2009), the estimated annual export of nitrate from sugarcane and bananas in the Tully River catchment is ~502 tonnes per year. Annual export can also be estimated using the mean 100% FALU-determined concentration of nitrate determined for the wet season (1618 μg L–1) and by extrapolation for the dry season (~800 mg L–1; Mitchell et al. 2007). Using a mean dry-season (June–November) discharge of 22% of the total annual flow (Mitchell et al. 2007) and the 98% DIN delivery ratio (above), an annual export of 442 tonnes of nitrate is estimated for sugarcane and bananas. The similarity of these two independent estimates provides confidence in our annual nitrate load estimates for sugarcane and banana land uses in the Tully River catchment.
The FALU–nitrate relationship could potentially be used to monitor mitigation efforts because the slope of the FALU–nitrate regression should reduce with declining fertiliser inputs. In our study, the best correlation was observed with the monthly, 7-year AIMS–BSES sampling program. This probably reflects high sample confidence at all sites, even if averaged over changing agricultural conditions. This confidence was enhanced by duplicate analytical samples and intermittent sample replicates. Second, sampling from all sites on the same day (or next day on occasion) helped to equalise environmental factors across all sites. Monthly sampling would have missed several critical storm events, but all sites were at least equally balanced in their sampling efforts. Hence, the use of this relationship to test a decline in fertiliser-N inputs requires a rigorous sampling program, ideally over an extended period of time with near-equal sample numbers collected almost simultaneously at each site.
The present study has highlighted the very large increase in stream nitrate concentrations that may result from the conversion of natural forest to fertilised land. In all river catchments, human disturbance generally increases the loss of nutrients and sediments in proportion to the scale of the disturbance. Relatively small disturbances, such as selective forestry, lead to a noticeable increase in the run-off of nutrients and sediments (Bormann et al. 1969; Douglas et al. 1992), whereas partial or whole replacement with plantation forests increases these losses further (Malmer 1996; Bubb et al. 2000). Much higher levels of disturbance, such as deforestation and land clearing, lead to considerably higher losses of nutrients and sediments (Likens et al. 1969; Lal 1996; Walling 1999). In addition, the predominant form of N export from cleared areas changes from DON to DIN (Harris 2001). However, the highest losses of nutrients are observed from land uses in which nutrient inputs are added to the land, such as where fertiliser is applied to cropping and horticultural areas (Tilman 1999; Filoso et al. 2004). Nitrate run-off has increased dramatically worldwide with increasing use of N-based fertiliser in agriculture (Addiscott et al. 1991; Randall and Mulla 2001). The results of our study strongly confirm that fertilised land use leads to the highest losses of dissolved inorganic N of any extensive, rural land use.
If the FALU–nitrate relationship represents the nitrate input curve in this catchment, we must presume that the nitrate export curve will be lower. Armour et al. (2009) assumed minimal denitrification in their high DIN delivery ratio (98%), but did not include in-stream losses from uptake by stream or bank vegetation, net transfer to groundwater and further losses on the coastal plain during bank overflows. The magnitude of nitrate trapping and losses within the catchment remains the critical question to resolve before we can define the nitrate export curve. Further investigations towards this end are recommended, along with more plot-scale studies in other areas and on other land uses. Notwithstanding these limitations, the FALU–nitrate relationship may provide relevant input data for catchment nutrient-budget models, such as ANNEX.
Acknowledgements
We wish to thank AIMS and BSES for their enduring vision to enable and continue this long sampling program, and DERM for their continuing, helpful provision of gauging data over many years. We especially thank the BSES and ACTFR staff members and Joelle Prange for collecting and processing samples, under sometimes very difficult weather conditions. We further thank AIMS staff of the Analytical Services Group and the staff of the ACTFR laboratory for analysing the very many water samples. We also thank Greg Nelson-White and Ines Lehmann (Internship) for their help in the preparation of the GIS maps. We acknowledge support from the Coastal Catchment Initiative, funded by the Department of the Environment, Water, Heritage and the Arts, through Terrain NRM. Finally, many thanks are given to Frederieke Kroon for her helpful advice and editing suggestions.
Armour, J. , Hateley, L. R. , and Pitt, G. L. (2009). Catchment modelling of sediment, nitrogen and phosphorus nutrient loads with SedNet/ANNEX in the Tully–Murray basin. Marine and Freshwater Research 60, 1091–1096.
Bainbridge, Z. T. , Brodie, J. E. , Faithful, J. W. , Sydes, D. A. , and Lewis, S. E. (2009). Identifying the land-based sources of suspended sediments, nutrients and pesticides discharged to the Great Barrier Reef from the Tully–Murray Basin, Queensland, Australia. Marine and Freshwater Research 60, 1081–1090.
Brodie, J. E. , De’ath, G. , Devlin, M. , Furnas, M. , and Wright, M. (2007a). Spatial and temporal patterns of near-surface chlorophyll a in the Great Barrier Reef lagoon. Marine and Freshwater Research 58, 342–353.
| Crossref | GoogleScholarGoogle Scholar | CAS |
Bubb, K. A. , Yu, B. , Cakurs, U. , and Costantini, A. (2000). Impacts of site preparation techniques on runoff, soil and nitrogen losses during the establishment phase in hoop pine plantations of southeast Queensland. Australian Forestry 63, 239–245.
Faithful, J. , and Finlayson, W. (2005). Water quality assessment for sustainable agriculture in the wet tropics – a community-assisted approach. Marine Pollution Bulletin 51, 99–112.
| Crossref | GoogleScholarGoogle Scholar | CAS | PubMed |
Filoso, S. , Martinelli, L. A. , Williams, M. R. , Lara, L. B. , Krusche, A. , Ballester, M. V. , Victoria, R. , and de Camargo, P. B. (2004). Land use and nitrogen export in the Piracicaba River basin, southeast Brazil. Biogeochemistry 65, 275–294.
| Crossref | GoogleScholarGoogle Scholar |
Harris, G. P. (2001). Biogeochemistry of nitrogen and phosphorus in Australian catchments, rivers and estuaries: effects of land use and flow regulation and comparisons with global patterns. Marine and Freshwater Research 52, 139–149.
| Crossref | GoogleScholarGoogle Scholar | CAS |
Lal, R. (1996). Deforestation and land-use effects on soil degradation and rehabilitation in western Nigeria. III. Runoff, soil erosion and nutrient loss. Land Degradation and Development 7, 99–119.
| Crossref | GoogleScholarGoogle Scholar |
Randall, G. W. , and Mulla, D. J. (2001). Nitrate nitrogen in surface waters as influenced by climatic conditions and agricultural practices. Journal of Environmental Quality 30, 337–344.
| CAS | PubMed |
Stewart, L. K. , Charlesworth, P. B. , Bristow, K. L. , and Thorburn, P. J. (2006). Estimating deep drainage and nitrate leaching from the root zone under sugarcane using APSIM-SWIM. Agricultural Water Management 81, 315–334.
| Crossref | GoogleScholarGoogle Scholar |
Tilman, D. (1999). Global environmental impacts of agricultural expansion: the need for sustainable and efficient practices. Proceedings of the National Academy of Sciences, USA 96, 5995–6000.
| Crossref | GoogleScholarGoogle Scholar | CAS |
Wallace, J. , Stewart, L. , Hawdon, A. , Keen, R. , Karim, F. , and Kemei, J. (2009). Flood water quality and marine sediment and nutrient loads from the Tully and Murray catchments in north Queensland, Australia. Marine and Freshwater Research 60, 1123–1131.

Walling, D. E. (1999). Linking land use, erosion and sediment yields in river basins. Hydrobiologia 410, 223–240.
| Crossref | GoogleScholarGoogle Scholar |
Webb, B. W. , and Walling, D. E. (1985). Nitrate behaviour in streamflow from a grassland catchment in Devon, UK. Water Research 19, 1005–1016.
| Crossref | GoogleScholarGoogle Scholar | CAS |
Weier, K. L. (1994). Nitrogen use and losses in agriculture in subtropical Australia. Fertilizer Research 39, 245–257.
| Crossref | GoogleScholarGoogle Scholar |
Weier, K. L. (1999). The quality of groundwater beneath Australian sugarcane fields. Australian Sugarcane 3, 26–27.
Wickham, J. D. , and Wade, T. G. (2002). Watershed level risk of nitrogen and phosphorus export. Computers and Electronics in Agriculture 37, 15–24.
| Crossref | GoogleScholarGoogle Scholar |
Young, W. J. , Marston, F. M. , and Davis, J. R. (1996). Nutrient exports and land use in Australian catchments. Journal of Environmental Management 47, 165–183.
| Crossref | GoogleScholarGoogle Scholar |