

Heteroagglomeration of nanosilver with colloidal SiO2 and clay
Sébastien Maillette A , Caroline Peyrot A , Tapas Purkait B , Muhammad Iqbal B , Jonathan G. C. Veinot B and Kevin J. Wilkinson A CA Biophysical Environmental Chemistry Group, Department of Chemistry, University of Montreal, CP 6128 Succursale Centre-ville, Montreal, QC H3C 3J7, Canada.
B Department of Chemistry, University of Alberta, Edmonton, AB T6G 2G2, Canada.
C Corresponding author. Email: kj.wilkinson@umontreal.ca
Environmental Chemistry 14(1) 1-8 https://doi.org/10.1071/EN16070
Submitted: 25 March 2016 Accepted: 13 July 2016 Published: 15 August 2016
Journal Compilation © CSIRO Publishing 2017 Open Access CC BY-NC-ND
Environmental context. The fate of nanomaterials in the environment is related to their colloidal stability. Although numerous studies have examined their homoagglomeration, their low concentration and the presence of high concentrations of natural particles implies that heteroagglomeration rather than homoagglomeration is likely to occur under natural conditions. In this paper, two state-of-the art analytical techniques were used to identify the conditions under which nanosilver was most likely to form heteroagglomerates in natural waters.
Abstract. The environmental risk of nanomaterials will depend on their persistence, mobility, toxicity and bioaccumulation. Each of these parameters is related to their fate (especially dissolution, agglomeration). The goal of this paper was to understand the heteroagglomeration of silver nanoparticles in natural waters. Two small silver nanoparticles (nAg, ~3 nm; polyacrylic acid- and citrate-stabilised) were covalently labelled with a fluorescent dye and then mixed with colloidal silicon oxides (SiO2, ~18.5 nm) or clays (~550 nm SWy-2 montmorillonite). Homo- and heteroagglomeration of the nAg were first studied in controlled synthetic waters that were representative of natural fresh waters (50 μg Ag L–1; pH 7.0; ionic strength 10–7 to 10–1 M Ca) by following the sizes of the nAg by fluorescence correlation spectroscopy. The polyacrylic acid-coated nanosilver was extremely stable under all conditions, including in the presence of other colloids and at high ionic strengths. However, the citrate-coated nanosilver formed heteroaggregates in presence of both colloidal SiO2 and clay particles. Nanoparticle surface properties appeared to play a key role in controlling the physicochemical stability of the nAg. For example, the polyacrylic acid stabilized nAg-remained extremely stable in the water column, even under conditions for which surrounding colloidal particles were agglomerating. Finally, enhanced dark-field microscopy was then used to further characterise the heteroagglomeration of a citrate-coated nAg with suspensions of colloidal clay, colloidal SiO2 or natural (river) water.
Additional keywords: agglomeration, dark-field microscopy, fluorescence correlation spectroscopy, hyperspectral imaging, silver nanoparticle.
Introduction
The use of nanomaterials is constantly increasing in consumer products, leading to an increased environmental risk that is strongly related to their fate (dissolution, agglomeration, etc.). Several studies have evaluated the homoagglomeration of nanosilver (nAg) in natural waters,[1–8] providing valuable information on the important factors affecting nanoparticle stability. Generally speaking, increased ionic strength and water hardness will increase agglomeration,[3,5,7,8] organic matter content has been observed to both increase and decrease agglomeration,[3,6,9] and the nature of the particle coating plays a critical role in particle stability.[1,5,7,8] Nevertheless, owing to analytical constraints, most studies have been performed at fairly high particle concentrations, especially when compared with the sub-part-per-billion levels that are expected in natural waters.[10,11] In addition, natural waters contain a large variety of colloidal particles[9] at concentrations that are usually orders of magnitude higher than the nanoparticles, i.e. from ~10 μg L–1 (marine environments) to 10 g L–1 (rivers).[12] Because both agglomeration and dissolution depend on particle concentration,[13] it is critical to understand particle fate for the low concentrations and low nanoparticle : colloid ratios that are likely to be found in natural waters. Based on the above, nanoparticles are more likely to interact with natural colloids or organic matter (i.e. heteroagglomeration) than with other similar nanoparticles (i.e. homoagglomeration).[14–18] Indeed, it was suggested recently that the heteroagglomeration of nAg was responsible for a decrease in its microbial activity.[19] Therefore, the goal of the present study was to evaluate the importance of heteroagglomeration in natural systems by focussing on low nanoparticle to colloid ratios (1 : 200) and nanoparticle concentrations that may be found in natural waters. We have focussed on nanosilver, although we believe that the conclusions can likely be generalised to other particles with similar surface properties (as opposed to all nAg).
Most of the available literature on heteroagglomeration has employed dynamic light scattering (DLS) and transmission electron microscopy (TEM),[17,19–21] often using fairly high concentrations of nanoparticles (which will increase the number of particle–particle contacts) and high nanoparticle : colloid ratios. Among the exceptions, attachment efficiencies have been elegantly determined by combining laser diffraction and a Smoluchowski-based aggregation model; however, this approach is only able to model a simplified version of the heteroagglomeration process.[22,23] Emerging techniques such as fluorescence correlation spectroscopy (FCS)[24,25] or enhanced dark-field microscopy with hyperspectral imaging (HSI) analysis[26] offer the possibility of discriminating the nanoparticles with a high sensitivity, even within complex environmental matrices. In FCS, fluorescence intensity fluctuations are used to measure the diffusion of labelled molecules or particles through an optically defined confocal volume (10–15 L)[24] (only nanoparticles are labelled and followed). Diffusion coefficients are determined by fitting an experimentally determined autocorrelation function with a 3D Gaussian model[24,25,27] and the hydrodynamic diameters of the labelled particles are calculated from the diffusion coefficients using the Stokes–Einstein equation.[25,27–29] Enhanced dark-field microscopy with HSI is a non-invasive technique that measures the light scattered by particles, including nanoparticles.[26,30,31] The measured spectral signature of the scattered light (determined on a pixel by pixel basis) can be used to determine the nature, size and shape of the particles, and spectral signatures can be used to map nanoparticles in a given sample.
Materials and methods
Particles
Two different types of ultrasmall (nominally <10 nm) silver nanoparticles were studied. Polyacrylic acid-coated nanosilver (nAg-PAA) was purchased from Sciventions (Toronto, Canada) whereas a citrate-coated nanosilver (nAg-cit) was produced in-house. The nAg were covalently labelled with a fluorescent dye to allow their detection at low concentrations using FCS (labelling protocols and particle characterisation after labelling are provided in the Supplementary material). The nAg-PAA was labelled on the carboxylic acid functional groups with Alexa Fluor 488® whereas the nAg-cit was labelled on the particle surface using rhodamine red. For a limited number of experiments, a larger nAg (nominally 22 nm) was purchased from Nanocomposix (San Diego, USA; AGCB20). Quantification of the stock solutions of labelled silver nanoparticles was performed using flame atomic absorption spectroscopy after digestion in concentrated HNO3.
A 25 % (w/w) dispersion of colloidal SiO2 was obtained from US Research Nanomaterials Inc. (Houston, USA). Clay particles (SWy-2: Na-rich, montmorillonite) were purchased from the Clay Minerals Society (Chantilly, USA).[17] The colloidal clay dispersion was prepared by adding a large excess of montmorillonite to Milli-Q water, shaking rigorously and then allowing the large particles and aggregates to sediment (4 months). The concentration of colloidal clay in the supernatant was determined by gravimetric analysis by first drying it for 24 h at 37 °C and then placing it in a desiccator for 24 h. Hydrodynamic diameters of the colloids were measured using DLS at a concentration of 100 mg L–1 whereas the initial sizes of silver nanoparticles were determined by TEM (Supplementary material).
Sample preparation
Synthetic media used in the experiments were prepared by diluting stock solutions of the colloids and nanoparticles into a pH- and ionic strength-adjusted medium and then letting the samples equilibrate overnight (16 h). pH was re-adjusted, if necessary, by adding small quantities of 0.1 M HNO3 or 0.1 M NaOH. Ionic strength was adjusted using calcium nitrate tetrahydrate (99 %, Sigma–Aldrich). Unless otherwise noted, nanoparticle samples had a concentration of 50 μg Ag L–1 and colloidal suspensions were used at 100 mg L–1.
For experiments using natural waters, water from the Des Prairies River was sampled on 13 April 2015 and filtered over 0.45-µm sterile nylon membrane filters (Fisherbrand, 09–719D) in order to remove the large particles. The major characteristics of the water (major ions, organic carbon content, pH) are provided in the Supplementary material (Table S1).
Fluorescence correlation spectroscopy
FCS measurements were performed on a Leica TCS SP5 confocal microscope using a 63× objective. Rhodamine 123 (5, 10 nM) was freshly prepared before measurements and used to calibrate the confocal volume based on its known diffusion coefficient of 4.40 × 10⁻¹⁰ m2 s–1.[32] Calibration was repeated every six samples. Each sample was measured 10 times using a 100-s acquisition time. Data from the 10 measurements were combined in order to determine a single value of the diffusion coefficient using a 3D Gaussian model (ISS Inc., Champagne, USA; Vista 3.0). Means and standard deviations were determined from independently prepared triplicate samples.
Enhanced dark-field microscopy with hyperspectral analysis
The use of hyperspectral imagery with enhanced dark-field microscopy has been shown to be a useful technique for identifying nanomaterials, especially nAg and nAu, in complex matrices.[33] Under dark-field conditions, the nanoparticles are significantly brighter compared with a classical optical microscope. Their scattered light is detected on a pixel by pixel basis, providing both spatial and spectral data (under conditions employed here, pixels were ~160 × 160 nm). A visible–near-infrared spectrophotometer (Cytoviva Hyperspectral Imaging system, Auburn, AL) integrated onto a dark-field transmission optical microscope (Olympus BX43) was used in order to characterise the heteroagglomerates. Images were collected with an Andor Ixon3 camera using a 100× objective and processed using ENVI 4.8 software (purchased through Cytoviva) using the following steps: (1) correction of specimen spectra for lamp effects; (2) collection of spectra from pure samples (nAg, SiO2, clay) to establish spectral libraries; (3) determination and localisation of nanoparticles and colloids in samples using a spectral angle mapper (SAM) classification algorithm (SAM = 0.25). This value of SAM was set in order to identify nAg particles even if there were fairly important changes to their spectra. In contrast to the FCS experiments, nanoparticle concentrations were increased to 1 mg L–1 to facilitate their detection (added colloids remained at 100 mg L–1). Following overnight equilibration, 5 µL of aqueous sample was placed on a microscope slide under a coverslip for observation.
Electrophoretic mobility and dynamic light scattering
Electrophoretic mobility (EPM) and DLS measurements were performed using a Mobius light-scattering instrument (Wyatt Technology, Santa Barbara, USA). DLS measurements were used to characterise hydrodynamic diameters of the natural colloids whereas electrophoretic mobilities were measured for both the nanoparticles and colloids. Phase-analysis light scattering was used to determine electrophoretic mobilities using an acquisition time of 15 s, an electric field frequency of 10.0 Hz and a voltage amplitude of 2.5 V. For DLS, the acquisition time was 5 s (repeated 3 times). Samples were measured in triplicate at a fixed temperature of 20 °C. Light scattering was performed using 100 mg L–1 of the colloidal particles and 5 mg L–1 of the nAg. Dynamics 7.2.4 software (Wyatt Technology, Santa Barbara, USA) was used for data acquisition and data treatment.
Results and discussion
Particle labelling
In order to isolate the signal of the nanoparticle from that of the natural colloids, it was first necessary to covalently label the nAg using a method that was as minimally perturbing as possible (Fig. S3). Because FCS is a single-molecule detection technique, only a small amount of fluorescent dye was required on the nanoparticle surface. A covalent label was used in order to ensure that the fluorescent label could not easily be desorbed from the nAg surface (Fig. S6). Physical diameters and electrophoretic mobilities were determined on the natural colloids (Table 1; Figs S1, S2) and the labelled nAg and non-labelled nAg (Table 1; Figs S4, S5, S7, S8). No significant differences were observed between the properties of labelled and non-labelled particles.
|
Heteroagglomeration of the nAg-cit
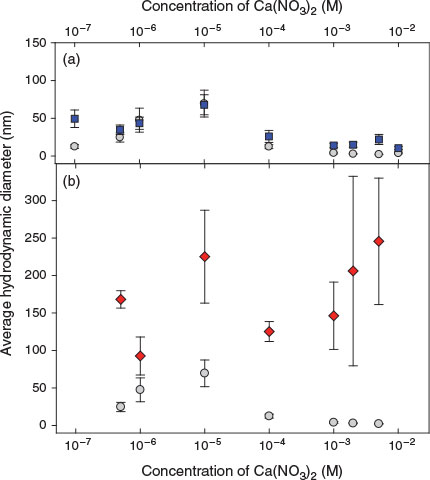
Average hydrodynamic diameters of the nAg-cit (50 μg Ag L–1) were measured by FCS over a wide range of added Ca concentrations, in the presence or absence of 100 mg L–1 of colloidal SiO2 or clay particles (Fig. 1). Recall that the colloidal particles are not measured by FCS unless they interact with a fluorescent nAg. Therefore, any increase in diameter indicates either homoagglomeration of the nAg or heteroagglomeration of the nAg with a colloidal particle. Indeed, at pH 7.0, in the absence of the colloidal particles (homoagglomeration; grey circles, Fig. 1), the sizes of nAg-cit increased as Ca increased from 10–7 to 10–5 M. Above 10–5 M Ca, the average diameter of the nAg decreased, but this was likely due to increased sedimentation of the largest nAg (as observed by a decrease in the overall fluorescent signal; Fig. S9a). Indeed, the overall fluorescence intensity in the nanoparticle suspensions decreased by 63 % as the ionic strength increased from 10–7 to 10–2 M Ca.
|
When 100 mg L–1 of colloidal SiO2 was added to the nAg (blue squares, Fig. 1a), a similar result was observed. Generally, average particle sizes were slightly larger in the presence of SiO2 (significant differences observed for all Ca concentrations except for 10–6 and 10–5 M; Student t-test, P < 0.05). When the larger clay particles were added to similar suspensions of nAg, clear and significant increases (Student t-test, significant at P < 0.05 for all Ca concentrations) to the particle sizes were observed, although because of the larger polydispersity of the clay colloids, larger error bars were also associated with the sizes of the heteroagglomerates. Note that in both heterosystems, the average hydrodynamic diameter of the nAg did not attain the size of a single colloidal particle (Table 1), strong evidence that some of the nAg did not react with the colloids. Indeed, other data treatment algorithms allowing multiple populations of particle sizes were unable to distinguish between unagglomerated and heteroagglomerated nAg, probably owing to the large polydispersity of the colloidal system. In summary, in the absence of colloidal particles, there was evidence for limited particle (homo)agglomeration, even at the low particle concentrations of 50 μg Ag L–1; however, for all values of water hardness, larger nAg diameters (i.e. smaller diffusion coefficients for the fluorescent nAg) were observed when colloidal particles were added to the waters.
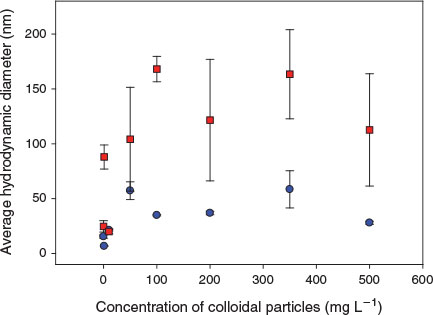
In order to confirm the importance of the natural colloids on heteroagglomeration, the size of the fluorescent nAg was followed for a single hardness ([Ca] = 5 × 10⁻⁷ M) but for an increasing concentration of colloidal particles (Fig. 2). Measured sizes of the nAg increased when both colloidal SiO2 (blue circles) and colloidal clay (red squares) were added. For example, the average hydrodynamic diameters of the nAg-cit increased from 3.5 nm (absence of colloids) to 57 nm in the presence of 50 mg L–1 SiO2 and 104 nm in the presence of 50 mg L–1 of the clays. Average sizes did not appear to vary further for increasing additions of either of the colloidal particles above 50 mg L–1, likely owing to the low nanoparticle to colloid ratios that would have been present (e.g. ~1 nAg for 27 SiO2; estimates based on particle densities and the Stokes–Einstein equation).[34]
|
Heteroagglomeration of the nAg-PAA
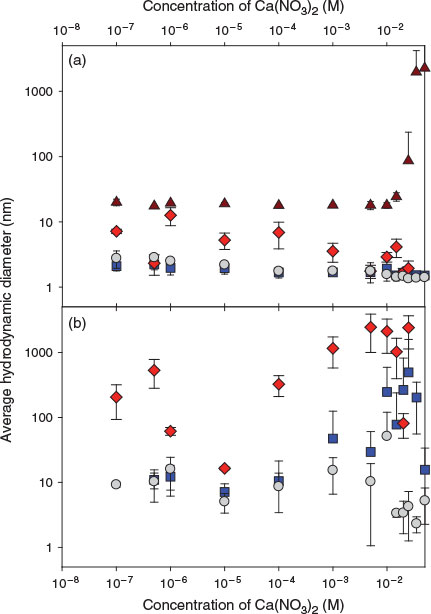
The stability of a second (labelled) nAg (nAg-PAA) was examined over a large range of added Ca concentrations, in the presence or absence of 100 mg L–1 of SiO2 or 100 mg L–1 of clay particles. As above, hydrodynamic diameters were determined for 50 μg Ag L–1 of the labelled nAg-PAA. In contrast to the nAg-cit, no increase in hydrodynamic diameter was observed across the entire range of examined Ca concentrations (10–7–0.3 M Ca; grey circles, Fig. 3a). Furthermore, in the presence of colloidal SiO2, no decrease in nanoparticle stability was observed (blue squares, Fig. 3a), even though there was visible agglomeration (homoagglomeration) and sedimentation of the SiO2 (brown triangles, Fig. 3a) above 10–2 M Ca.[18] In other words, under these conditions, homoagglomeration of the colloidal SiO2 was independent of any (lack of) heteroagglomeration of the nAg. Even at extremely high (and no longer environmentally relevant) Ca concentrations, where significant screening of the particle charge would occur, the nanoparticles were predominantly found as isolated nanoparticles. Similar results were observed at pH 5.0 even though the protonation of the carboxylic groups should have weakened the electrostatic repulsion among the particles (Fig. S10). Although we have no other literature data on these specific nAg-PAA, the observations are consistent with data obtained for empty PAA shells (allospheres) from the same manufacturer, where it was shown that they were extremely stable over a wide range of ionic strengths (20–1000 mM) and pH (5.0–8.0).[35,36]
|
Although average nanoparticle sizes did not increase across the entire range of Ca concentrations, Fig. 3a was analysed under the assumption of a single particle size. In FCS, more polydisperse systems can also be examined using a minor component analysis, which focuses on the tail of the particle size distributions.[37] Although these data are necessarily less accurate owing the smaller numbers of analysed particles, analysis indicated that a small proportion of the nanoparticles (<5 %) was significantly larger in the presence of both the SiO2 (blue squares, Fig. 3b) and the colloidal clay (red diamonds, Fig. 3b) compared with their absence (grey circles, Fig. 3b). These results suggest that for a small fraction of the nAg, some heteroagglomeration was occurring, but that it was not quantitatively important and only observed at extremely high Ca concentrations (>10–2 M) in the presence of high colloidal SiO2 concentrations (100 mg L–1). In this case, minor component analysis also showed that a quantitatively small interaction was occurring with the colloidal clay particles, because a small proportion of the nAg-PAA was much larger than the results observed for the suspensions without clays. Nonetheless, for this nanoparticle, most of the particles were highly stabilised, at pH 5.0 or 7.0, across a wide range of ionic strengths.
Dark-field microscopy
In order to confirm that heteroagglomeration was occurring among the nAg-cit and the colloidal particles, further analysis was performed using dark-field microscopy using HSI.[26,38,39] Although dark-field microscopy is a powerful technique for the pixel-by-pixel localisation of nanoparticles of the noble metals, the small particles employed above were below the detection limits of the instrument. Therefore, a larger (hydrodynamic diameter of 22 ± 2 nm), commercially available, citrate-coated nAg was employed for dark-field analysis (Fig. 4a). Numerous spectra (each corresponding to a single pixel of ~160 × 160 nm) were obtained (Fig. 4b, c, library 1). As seen previously,[38,40] the distinct, fairly narrow spectral peaks of the Ag result from an enhancement of the scattered light due to its plasmonic resonance, which has been shown to shift to longer wavelengths (i.e. red shift, Fig. 4c) with increasing particle size.[26,31] The observation of numerous colours and numerous maxima in the spectra is highly indicative of a range of particle sizes (i.e. polydisperse sample). Dark-field images and hyperspectral libraries were also obtained for the clay colloids alone (Fig. 4d, e, library 2) and for nAg in the presence of the clay colloids (Fig. 4f, g, library 3). In the latter case, narrow spectral peaks, strongly indicative of the nAg, could again be observed; however, when the spectral library for the nAg (library 1) was used in order to map nanoparticles in the colloidal mixtures at 1 mM (Fig. 4h) or 50 mM Ca (Fig. 4i), only a few nAg could be identified. The presence of peaks that were clearly nAg, but that could not be identified using the conservative values of SAM (0.25) is a strong indication that the optical properties of the nAg changed owing to an interaction with the colloidal montmorillonite (Figs S11, S12). A similar result was observed for nAg-cit in the presence of SiO2, except that even fewer points corresponding to the nAg could be identified following the mixing of the two particle types (Fig. S13). Nonetheless, results from the dark-field microscopy clearly indicated that interactions were taking place between the nAg and the colloids: (i) spectra were clearly different and usually red-shifted with respect to spectra obtained in the absence of the colloids; (ii) spectra in the presence of the (polydisperse) clays indicated far greater variation of the wavelength of the peak maxima (Fig. 4g) than was observed in the presence of the SiO2 (Fig. S13e); (iii) when the spectral libraries from the mixture supernatants (library 3) were used to map the nAg, particles appeared to closely co-exist with the colloidal clays (Fig. 4h, i).

|
Natural waters
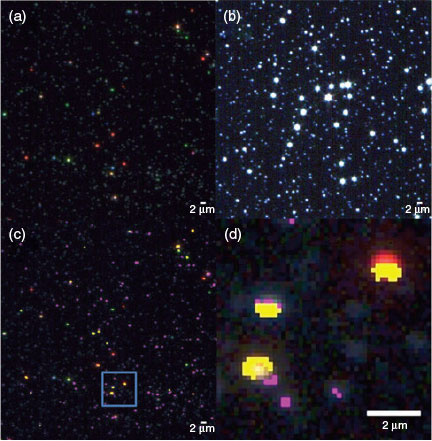
Finally, a small volume of the larger nAg-cit was spiked into a filtered (0.45-µm) water sample taken from the Des Prairies River (Laval, Quebec). For 50 µg L–1 of fluorescently labelled nAg-cit, nanoparticle sizes obtained in the natural waters were clearly larger than those obtained in Milli-Q water (Table 2, Fig. S14), a result that could be attributed to either homo- or heteroagglomeration of the nAg-cit. However, when 1 mg L–1 of the nAg-cit was added to the natural water (Fig. 5a), it was possible to identify the particles either by image enhancement (Fig. 5b) or by using the spectral library that was generated previously from the nAg in the supernatant of the colloidal montmorillonite (i.e. library 3). As above, nAg was often found in contact with the colloidal particles in the natural samples (Fig. 5c, d). The observations of the larger sizes (FCS) and the nAg–natural colloid interactions (dark-field microscopy) strongly indicate that heteroagglomeration rather than simply homoagglomeration was occurring in the natural water.
|
|
Conclusions
The environmental risk posed by nanomaterials is strongly linked to their agglomeration and dissolution in the environment, which will directly affect their mobility and bioavailability. For low nanoparticle concentrations and low nanoparticle-to-colloid ratios, heteroagglomeration rather than homoaggomeration is most likely to control particle fate. Nanoparticle sizes were generally larger in the presence of natural colloids, resulting from the interaction of multiple particle types, which could potentially lead to their sedimentation in receptor environments.[15,16,18,41] Nonetheless, as shown above, the particle coatings of these novel materials played a key role in determining their physicochemical stability.[1,5,7,8] For the PAA coating, nAg remained extremely stable in the water column, even in the presence of substantial agglomeration of the surrounding colloidal particles. Although the role of the chemical reactivity of the nanoparticles (e.g. sulfidation, adsorption of natural organic matter) was not studied here, these transformations will also clearly play a role in modulating their interactions with the colloidal particles and will need to be studied further.[42] Although the analytical techniques used here had some limitations, mainly due to the high heterogeneity of the complex systems, their ability to follow the nanoparticle label is an advantage over non-specific techniques such as DLS. Although it would be extremely desirable to determine heteroagglomeration sticking coefficients using FCS, these measurements are noisier than those obtained in DLS, owing to the single-particle nature of the measurements. Nonetheless, measurements of average particle sizes showed that, under the conditions of the study, not all of the nanoparticles underwent heteroagglomeration, even under conditions where there was destabilisation of the natural colloidal particles. For the low concentrations of nAg examined here, homoagglomeration was extremely limited and unlikely to be relevant in natural systems. It is clear that nanoparticle behaviour and fate cannot be understood without taking into account the roles of many of the important natural components of the natural systems.
Supplementary material
Characterisation of the colloidal suspensions, labelling and characterisation of nAg, losses of fluorescent nanoparticles over time, heteroagglomeration at pH 5, additional images acquired by dark-field microscopy, and raw FCS data for the nAg in the river water are available from the journal online (see http://www.publish.csiro.au/?act=view_file&file_id=EN16070_AC.pdf).
Acknowledgements
Funding was provided by the Natural Sciences and Engineering Research Council of Canada, the Fonds de Recherche du Québec – Nature et Technologies and Environment Canada.
References
[1] J. M. Zook, M. D. Halter, D. Cleveland, S. E. Long, Disentangling the effects of polymer coatings on silver nanoparticle agglomeration, dissolution, and toxicity to determine mechanisms of nanotoxicity. J. Nanopart. Res. 2012, 14, 1165.| Disentangling the effects of polymer coatings on silver nanoparticle agglomeration, dissolution, and toxicity to determine mechanisms of nanotoxicity.Crossref | GoogleScholarGoogle Scholar |
[2] S. Elzey, V. H. Grassian, Agglomeration, isolation and dissolution of commercially manufactured silver nanoparticles in aqueous environments. J. Nanopart. Res. 2010, 12, 1945.
| Agglomeration, isolation and dissolution of commercially manufactured silver nanoparticles in aqueous environments.Crossref | GoogleScholarGoogle Scholar | 1:CAS:528:DC%2BC3cXmsFOru7g%3D&md5=392ed0c5a344bc8e46bdca4fc970b22cCAS |
[3] M. Baalousha, Y. Nur, I. Roemer, M. Tejamaya, J. R. Lead, Effect of monovalent and divalent cations, anions and fulvic acid on aggregation of citrate-coated silver nanoparticles. Sci. Total Environ. 2013, 454–455, 119.
| Effect of monovalent and divalent cations, anions and fulvic acid on aggregation of citrate-coated silver nanoparticles.Crossref | GoogleScholarGoogle Scholar | 23542485PubMed |
[4] A. Bradford, R. D. Handy, J. W. Readman, A. Atfield, M. Muehling, Impact of silver nanoparticle contamination on the genetic diversity of natural bacterial assemblages in estuarine sediments. Environ. Sci. Technol. 2009, 43, 4530.
| Impact of silver nanoparticle contamination on the genetic diversity of natural bacterial assemblages in estuarine sediments.Crossref | GoogleScholarGoogle Scholar | 1:CAS:528:DC%2BD1MXlt1SgurY%3D&md5=aaaecb16162abf8ddee02d6089f43c86CAS | 19603673PubMed |
[5] A. M. El Badawy, K. G. Scheckel, M. Suidan, T. Tolaymat, The impact of stabilization mechanism on the aggregation kinetics of silver nanoparticles. Sci. Total Environ. 2012, 429, 325.
| The impact of stabilization mechanism on the aggregation kinetics of silver nanoparticles.Crossref | GoogleScholarGoogle Scholar | 1:CAS:528:DC%2BC38Xos1Cnu7g%3D&md5=2bebfde47f29c7b8dd63773a9940e46eCAS | 22578844PubMed |
[6] O. Furman, S. Usenko, B. L. T. Lau, Relative importance of the humic and fulvic fractions of natural organic matter in the aggregation and deposition of silver nanoparticles. Environ. Sci. Technol. 2013, 47, 1349.
| 1:CAS:528:DC%2BC3sXkt12itw%3D%3D&md5=3a104ab0347ab4967022769dc64578b6CAS | 23298221PubMed |
[7] X. Li, J. J. Lenhart, Aggregation and dissolution of silver nanoparticles in natural surface water. Environ. Sci. Technol. 2012, 46, 5378.
| Aggregation and dissolution of silver nanoparticles in natural surface water.Crossref | GoogleScholarGoogle Scholar | 1:CAS:528:DC%2BC38XlsFemsLk%3D&md5=eb7ad48da17a9df59ab79a06b0cdfc8aCAS | 22502776PubMed |
[8] X. Li, J. J. Lenhart, H. W. Walker, Aggregation kinetics and dissolution of coated silver nanoparticles. Langmuir 2012, 28, 1095.
| Aggregation kinetics and dissolution of coated silver nanoparticles.Crossref | GoogleScholarGoogle Scholar | 1:CAS:528:DC%2BC3MXhsF2lsLvL&md5=85dc2b2df8de56622c6ee69e2b7067d1CAS | 22149007PubMed |
[9] J. Buffle, K. J. Wilkinson, S. Stoll, M. Filella, J. W. Zhang, A generalized description of aquatic colloidal interactions: the three-colloidal-component approach. Environ. Sci. Technol. 1998, 32, 2887.
| A generalized description of aquatic colloidal interactions: the three-colloidal-component approach.Crossref | GoogleScholarGoogle Scholar | 1:CAS:528:DyaK1cXlsVyqt7w%3D&md5=55f16ae7b3402ddbec23175c1de9f2f4CAS |
[10] L. Li, G. Hartmann, M. Doblinger, M. Schuster, Quantification of nanoscale silver particles removal and release from municipal wastewater treatment plants in Germany. Environ. Sci. Technol. 2013, 47, 7317.
| 1:CAS:528:DC%2BC3sXptFentL8%3D&md5=2792a89e735acdbdab9d1e20685dcedaCAS | 23750458PubMed |
[11] H. F. Krug, Nanosafety research – are we on the right track?. Angew. Chem. Int. Ed. 2014, 53, 12304.
| 1:CAS:528:DC%2BC2cXhvVGksLzP&md5=00cb139b2840c6c0bbb1654e1c80493eCAS |
[12] J. Buffle, H. P. v. Leeuwen, Environmental Particles, Vol. 1 1992 (Lewis Publishers, Inc.).
[13] M. Hadioui, S. Leclerc, K. J. Wilkinson, Multimethod quantification of Ag+ release from nanosilver. Talanta 2013, 105, 15.
| Multimethod quantification of Ag+ release from nanosilver.Crossref | GoogleScholarGoogle Scholar | 1:CAS:528:DC%2BC3sXmt1WjurY%3D&md5=9c11d8234f3a624fedb9c720adcabcdbCAS | 23597981PubMed |
[14] I. G. Droppo, G. G. Leppard, S. N. Liss, T. G. Milligan, Flocculation in Natural and Engineered Environmental Systems 2005 (CRC Press: New York, NY).
[15] Y. Tian, B. Gao, C. Silvera-Batista, K. J. Ziegler, Transport of engineered nanoparticles in saturated porous media. J. Nanopart. Res. 2010, 12, 2371.
| Transport of engineered nanoparticles in saturated porous media.Crossref | GoogleScholarGoogle Scholar | 1:CAS:528:DC%2BC3cXhtVCju7%2FI&md5=fcee0d94a7780f6046218142b73430eeCAS |
[16] M. Therezien, A. Thill, M. R. Wiesner, Importance of heterogeneous aggregation for NP fate in natural and engineered systems. Sci. Total Environ. 2014, 485–486, 309.
| Importance of heterogeneous aggregation for NP fate in natural and engineered systems.Crossref | GoogleScholarGoogle Scholar | 24727597PubMed |
[17] D. Zhou, A. I. Abdel-Fattah, A. A. Keller, Clay particles destabilize engineered nanoparticles in aqueous environments. Environ. Sci. Technol. 2012, 46, 7520.
| Clay particles destabilize engineered nanoparticles in aqueous environments.Crossref | GoogleScholarGoogle Scholar | 1:CAS:528:DC%2BC38XovFartLc%3D&md5=78e3b8c01cfb998c3ca856d7ca482f50CAS | 22721423PubMed |
[18] J. Labille, C. Harns, J. Y. Bottero, J. A. Brant, Heteroaggregation of titanium dioxide nanoparticles with natural clay colloids. Environ. Sci. Technol. 2015, 49, 6608.
| Heteroaggregation of titanium dioxide nanoparticles with natural clay colloids.Crossref | GoogleScholarGoogle Scholar | 1:CAS:528:DC%2BC2MXntFSgsbw%3D&md5=0d0f21796e208052e9ddcd077ddb33ccCAS | 25913600PubMed |
[19] H. Khanh An, J. M. McCaffery, K. L. Chen, Heteroaggregation reduces antimicrobial activity of silver nanoparticles: evidence for nanoparticle–cell proximity effects. Environ. Sci. Technol. Letters 2014, 1, 361.
[20] J. Zhao, F. Liu, Z. Wang, X. Cao, B. Xing, Heteroaggregation of graphene oxide with minerals in aqueous phase. Environ. Sci. Technol. 2015, 49, 2849.
| 1:CAS:528:DC%2BC2MXhsVCgur0%3D&md5=cba2e26031cae0808d93a647fe57e639CAS | 25614925PubMed |
[21] H. An Khanh, J. M. McCaffery, K. L. Chen, Heteroaggregation of multiwalled carbon nanotubes and hematite nanoparticles: rates and mechanisms. Environ. Sci. Technol. 2012, 46, 5912.
| Heteroaggregation of multiwalled carbon nanotubes and hematite nanoparticles: rates and mechanisms.Crossref | GoogleScholarGoogle Scholar |
[22] A. Praetorius, J. Labille, M. Scheringer, A. Thill, K. Hungerbühler, J.-Y. Bottero, Heteroaggregation of titanium dioxide nanoparticles with model natural colloids under environmentally relevant conditions. Environ. Sci. Technol. 2014, 48, 10690.
| Heteroaggregation of titanium dioxide nanoparticles with model natural colloids under environmentally relevant conditions.Crossref | GoogleScholarGoogle Scholar | 1:CAS:528:DC%2BC2cXhtlKms7bM&md5=54f7bc2dddc1fcb58210b446567ab094CAS | 25127331PubMed |
[23] J. Labille, C. Harns, J. -Y. Bottero, J. Brant, Heteroaggregation of titanium dioxide nanoparticles with natural clay colloids. Environ. Sci. Technol. 2015, 49, 6608.
| Heteroaggregation of titanium dioxide nanoparticles with natural clay colloids.Crossref | GoogleScholarGoogle Scholar | 1:CAS:528:DC%2BC2MXntFSgsbw%3D&md5=0d0f21796e208052e9ddcd077ddb33ccCAS | 25913600PubMed |
[24] K. Starchev, K. J. Wilkinson, J. Buffle, Application of FCS to the study of environmental systems, in Fluorescence Correlation Spectroscopy. Theory and Applications (Eds R. Rigler, E. L. Elson) 2001, Vol. 5, pp. 251–275 (Springer: Berlin).
[25] A. Pramanik, J. Widengren, Fluorescence correlation spectroscopy (FCS), in Encyclopedia of Molecular Cell Biology and Molecular Medicine (Ed. R. A. Meyers) 2004, pp. 461–500 (Wiley-VCH).
[26] G. A. Roth, S. Tahiliani, N. M. Neu-Baker, S. A. Brenner, Hyperspectral microscopy as an analytical tool for nanomaterials. Wiley Interdisciplinary Reviews: Nanomedicine and Nanobiotechnology 7, 565.
[27] T.-O. Peulen, K. J. Wilkinson, Diffusion of nanoparticles in a biofilm. Environ. Sci. Technol. 2011, 45, 3367.
| Diffusion of nanoparticles in a biofilm.Crossref | GoogleScholarGoogle Scholar | 1:CAS:528:DC%2BC3MXjvVehsrY%3D&md5=f49c8f408f5864cc6dc19489bedcd41aCAS | 21434601PubMed |
[28] A. Tcherniak, A. Prakash, J. T. Mayo, V. L. Colvin, S. Link, Fluorescence correlation spectroscopy of magnetite nanocrystal diffusion. J. Phys. Chem. C 2009, 113, 844.
| Fluorescence correlation spectroscopy of magnetite nanocrystal diffusion.Crossref | GoogleScholarGoogle Scholar | 1:CAS:528:DC%2BD1MXps1Ol&md5=9df422faf88491ece89dc20a229c07f2CAS |
[29] H. Holthoff, A. Schmitt, Fernandez Barbero, A.; Borkovec, M.; Cabrerizo Vilchez, M. A.; Schurtenberger, P.; Hidalgo Alvarez, R., Measurement of absolute coagulation rate constants for colloidal particles: comparison of single and multiparticle light-scattering techniques. J. Colloid Interface Sci. 1997, 192, 463.
| Fernandez Barbero, A.; Borkovec, M.; Cabrerizo Vilchez, M. A.; Schurtenberger, P.; Hidalgo Alvarez, R., Measurement of absolute coagulation rate constants for colloidal particles: comparison of single and multiparticle light-scattering techniques.Crossref | GoogleScholarGoogle Scholar | 1:CAS:528:DyaK2sXmtFGksLw%3D&md5=cccb2986ec7793a774875201e5467697CAS | 9367570PubMed |
[30] S. Patskovsky, E. Bergeron, D. Rioux, M. Simard, M. Meunier, Hyperspectral reflected light microscopy of plasmonic Au/Ag alloy nanoparticles incubated as multiplex chromatic biomarkers with cancer cells. Analyst 2014, 139, 5247.
| Hyperspectral reflected light microscopy of plasmonic Au/Ag alloy nanoparticles incubated as multiplex chromatic biomarkers with cancer cells.Crossref | GoogleScholarGoogle Scholar | 1:CAS:528:DC%2BC2cXht1amsbjF&md5=cec82ec9ae5b405ddfb9730f01ac7bbfCAS | 25133743PubMed |
[31] M. Mortimer, A. Gogos, N. Bartolome, A. Kahru, T. D. Bucheli, V. I. Slaveykova, Potential of hyperspectral imaging microscopy for semi-quantitative analysis of nanoparticle uptake by protozoa. Environ. Sci. Technol. 2014, 48, 8760.
| Potential of hyperspectral imaging microscopy for semi-quantitative analysis of nanoparticle uptake by protozoa.Crossref | GoogleScholarGoogle Scholar | 1:CAS:528:DC%2BC2cXhtFSrtrjF&md5=18f33ce18a3277619e2967da8b7f9c79CAS | 25000358PubMed |
[32] P. O. Gendron, F. Avaltroni, K. J. Wilkinson, Diffusion coefficients of several rhodamine derivatives as determined by pulsed field gradient–nuclear magnetic resonance and fluorescence correlation spectroscopy. J. Fluoresc. 2008, 18, 1093.
| Diffusion coefficients of several rhodamine derivatives as determined by pulsed field gradient–nuclear magnetic resonance and fluorescence correlation spectroscopy.Crossref | GoogleScholarGoogle Scholar | 1:CAS:528:DC%2BD1cXhsVWjt7rN&md5=f6d18f404c95890a69b9e253de8df0d0CAS | 18431548PubMed |
[33] A. R. Badireddy, M. R. Wiesner, J. Liu, Detection, characterization, and abundance of engineered nanoparticles in complex waters by hyperspectral imagery with enhanced dark-field microscopy. Environ. Sci. Technol. 2012, 46, 10081.
| 1:CAS:528:DC%2BC38Xht1ajsrzE&md5=6e24630db32c8abad981be4737ba50d0CAS | 22906208PubMed |
[34] X. Liu, M. Atwater, J. Wang, Q. Huo, Extinction coefficient of gold nanoparticles with different sizes and different capping ligands. Colloids Surf. B Biointerfaces 2007, 58, 3.
| Extinction coefficient of gold nanoparticles with different sizes and different capping ligands.Crossref | GoogleScholarGoogle Scholar | 1:CAS:528:DC%2BD2sXlvVOksr0%3D&md5=31f2bbf6c64fdcaef4bb4b3f2c6b09adCAS | 16997536PubMed |
[35] L. Diaz, C. Peyrot, K. J. Wilkinson, Characterization of polymeric nanomaterials using analytical ultracentrifugation. Environ. Sci. Technol. 2015, 49, 7302.
| Characterization of polymeric nanomaterials using analytical ultracentrifugation.Crossref | GoogleScholarGoogle Scholar | 1:CAS:528:DC%2BC2MXosFGksrs%3D&md5=d13a510c7b72fef83506a2a58f9c515fCAS | 25988704PubMed |
[36] A. R. Petosa, C. Oehl, F. Rajput, N. Tufenkji, Mobility of nanosized cerium dioxide and polymeric capsules in quartz and loamy sands saturated with model and natural groundwaters. Water Res. 2013, 47, 5889.
| Mobility of nanosized cerium dioxide and polymeric capsules in quartz and loamy sands saturated with model and natural groundwaters.Crossref | GoogleScholarGoogle Scholar | 1:CAS:528:DC%2BC3sXht1SjtLbK&md5=248af5ed77d3d665099c8efe8f7dc8c5CAS | 23916155PubMed |
[37] R. F. Domingos, C. Peyrot, K. J. Wilkinson, Aggregation of titanium dioxide nanoparticles: role of calcium and phosphate. Environ. Chem. 2010, 7, 61.
| Aggregation of titanium dioxide nanoparticles: role of calcium and phosphate.Crossref | GoogleScholarGoogle Scholar | 1:CAS:528:DC%2BC3cXjt12jtLg%3D&md5=4e1441b0aa8939112841612f2216fd4eCAS |
[38] S. Leclerc, K. J. Wilkinson, Bioaccumulation of nanosilver by Chlamydomonas reinhardtii – nanoparticle or the free ion?. Environ. Sci. Technol. 2014, 48, 358.
| Bioaccumulation of nanosilver by Chlamydomonas reinhardtii – nanoparticle or the free ion?.Crossref | GoogleScholarGoogle Scholar | 1:CAS:528:DC%2BC3sXhvV2mtL%2FO&md5=7fd03d15999d7461cf35ccbc5a4e1fbeCAS | 24320028PubMed |
[39] H. Weinkauf, B. F. Brehm-Stecher, Enhanced dark field microscopy for rapid artifact-free detection of nanoparticle binding to Candida albicans cells and hyphae. Biotechnol. J. 2009, 4, 871.
| Enhanced dark field microscopy for rapid artifact-free detection of nanoparticle binding to Candida albicans cells and hyphae.Crossref | GoogleScholarGoogle Scholar | 1:CAS:528:DC%2BD1MXos1aqsLY%3D&md5=32ea5a23acbd265d2a76b4796777c3b0CAS | 19492326PubMed |
[40] C. Sönnichsen, B. M. Reinhard, J. Liphardt, A. P. Alivisatos, A molecular ruler based on plasmon coupling of single gold and silver nanoparticles. Nat. Biotechnol. 2005, 23, 741.
| A molecular ruler based on plasmon coupling of single gold and silver nanoparticles.Crossref | GoogleScholarGoogle Scholar | 15908940PubMed |
[41] J. T. K. Quik, D. van de Meent, A. A. Koelmans, Simplifying modeling of nanoparticle aggregation–sedimentation behavior in environmental systems: a theoretical analysis. Water Res. 2014, 62, 193.
| Simplifying modeling of nanoparticle aggregation–sedimentation behavior in environmental systems: a theoretical analysis.Crossref | GoogleScholarGoogle Scholar | 1:CAS:528:DC%2BC2cXht1WktL3P&md5=99e28f3a878cfc5068fac3bb1d1db81dCAS |
[42] A. C. Johnson, M. D. Jurgens, A. J. Lawlor, I. Cisowska, R. J. Williams, Particulate and colloidal silver in sewage effluent and sludge discharged from British wastewater treatment plants. Chemosphere 2014, 112, 49.
| Particulate and colloidal silver in sewage effluent and sludge discharged from British wastewater treatment plants.Crossref | GoogleScholarGoogle Scholar | 1:CAS:528:DC%2BC2cXhtFyqsbnK&md5=86744717bdb29837a292dc24558e703bCAS | 25048887PubMed |