

Genomic prediction for targeted populations of environments in oat (Avena sativa)
Pablo Sandro A , Madhav Bhatta A B , Alisha Bower C , Sarah Carlson C , Jean-Luc Jannink D , David J. Waring D , Clay Birkett D , Kevin Smith E , Jochum Wiersma E , Melanie Caffe F , Jonathan Kleinjan F , Michael S. McMullen G , Lydia English C and Lucia Gutierrez A *
A
B
C
D
E
F
G
Abstract
Long-term multi-environment trials (METs) could improve genomic prediction models for plant breeding programs by better representing the target population of environments (TPE). However, METs are generally highly unbalanced because genotypes are routinely dropped from trials after a few years. Furthermore, in the presence of genotype × environment interaction (GEI), selection of the environments to include in a prediction set becomes critical to represent specific TPEs.
The goals of this study were to compare strategies for modelling GEI in genomic prediction, using large METs from oat (Avena sativa L.) breeding programs in the Midwest United States, and to develop a variety decision tool for farmers and plant breeders.
The performance of genotypes in TPEs was predicted by using different strategies for handling GEI in genomic prediction models including systematic and/or random GEI components. These strategies were also used to build the variety decision tool for farmers.
Genomic prediction for unknown genotypes, locations and years within TPEs had moderate to high predictive ability, accuracy and reliability. Modelling GEI was beneficial in small, but not in large, mega-environments. The latest 3 years were highly predictive of performance in an upcoming year for most years but not for years with unusual weather patterns. High predictive ability, accuracy and reliability were obtained when large datasets were used in TPEs.
Deployment of historical datasets can be accomplished through meaningful delineation and prediction for TPEs.
We have shown the performance of a simple modelling strategy for handling prediction for TPEs when deploying large historical datasets.
Keywords: genomic best linear unbiased predictions (GBLUP), genomic prediction, genomic selection, genotype by environment interaction (GEI), genotypic performance, multi-environment trials (METs), targeted populations of environments (TPE), unbalanced dataset.
Introduction
The phenotype of an individual plant is determined by its genotype, the environment, and genotype × environment interaction (GEI; van Eeuwijk 2006). Multi-environment trials (METs) are routinely conducted in plant breeding to capture GEI (Smith et al. 2001; Piepho et al. 2008) and to estimate (or predict) genotypic performance. Furthermore, plant breeders aim to produce varieties that are best suited for their specific target population of environments (TPE), that is, any set of fields and future seasons in which the varieties may grow (Atlin et al. 2011). Therefore, TPE and genotypic characterisation in those environments are critical for performance evaluation and prediction (Yan 2015). The traditional approach for characterising GEI uses a simplification by grouping locations with similar rankings of genotypes, reducing the variability within a group (i.e. no ranking-crossover GEI; Crossa and Cornelius 1997; Yan et al. 2007; Burgueño et al. 2008). Groupings of environments on the basis of GEI are often referred to as mega-environments (MEs, Braun et al. 1997; Gauch and Zobel 1997; Yan 2015). The ME is useful in guiding decision-making for TPEs, helping the management of breeding goals and environments by leveraging relevant information to improve the prediction of the performance of genotypes.
Different strategies have been employed to characterise GEI in general, including mixed models (Piepho 2000; Verbyla et al. 2003; Malosetti et al. 2004; van Eeuwijk et al. 2005; Boer et al. 2007; Mathews et al. 2008; Lado et al. 2016) and the use of environmental covariates in factorial and partial least squares regression (Vargas et al. 1999; Rebollo et al. 2023). Mixed models can also deal with the unbalanced structure of most METs where new genotypes are added every year and only the highest performing genotypes, relevant varieties and long-term checks are retained (Dawson et al. 2013). With the widespread availability of genomic data, genomic prediction models (Meuwissen et al. 2001) have become an important tool for predicting the genomic estimated breeding values or genotypic values of individuals for economically relevant traits. It is only natural then that mixed models have been extended to account for GEI in genomic prediction by modelling a variance–covariance matrix between environments based on the genotypic correlation among environments (Piepho 1998; Burgueño et al. 2012; Malosetti et al. 2016; Lado et al. 2016; Bhatta et al. 2020) or based on environmental covariates (Jarquín et al. 2014). Some of these modelling approaches include the use of mixed models such as genomic best linear unbiased prediction (GBLUP; Bernardo 1996). In this strategy, a set of genotypes with genomic and phenotypic information is used to train a model that can predict un-phenotyped individuals by borrowing information from relatives through a genomic-estimated relationship matrix (Meuwissen et al. 2001; Heffner et al. 2009). However, a model is only as good as the data used to generate it, and multiple years and locations within a TPE are required to obtain accurate predictions.
Several studies have tapped into the large historical MET datasets available for many crops (Dawson et al. 2013; Lado et al. 2016; Ward et al. 2019; Bhatta et al. 2020). However, a clear strategy for predicting a specific TPE, locations and year-to-year variation is still needed. In this study, we compared strategies for modelling GEI in genomic prediction by using large historical MET datasets from oat breeding programs in the Midwest of the United States. Specifically, our goals were to evaluate strategies for predicting the performance of genotypes in TPEs; to evaluate the predictive ability for random GEIs such as genotype × year interactions; and to develop the concept for a variety decision tool that farmers and plant breeders can use to aid in the selection of candidate genotypes for their area.
Materials and methods
Plant material, multi-environment trial data and genomic information
This study used grain yield from MET historical data of 5220 oat genotypes that were grown from 1997 to 2021 in 59 locations across nine states (Illinois, Indiana, Iowa, Michigan, Minnesota, New York, North Dakota, South Dakota, Wisconsin) in the Midwest United States (Supplementary Table S1). This dataset was compiled from different types of plant breeding trials including preliminary yield trials (PYT, F7), or stage 1, advanced yield trials (AYT, F8), or stage 2, elite yield trials (EYT, F9+), or stage 3, early maturity trials (ET) and late maturity trials (LT); several collaborative nurseries including the uniform early oat performance nursery (UEOPN), uniform mid-season oat performance nursery (UMPON), and Midwest collaborative nursery (MCON); and a few large experiments including the mega-environmental design (MED) and Metabolomics (META) studies. Genotypes were evaluated on partially replicated or augmented experimental designs (MCON, META), or with different number of replications in alpha latices (AYT, PYT, MED), or with a randomised complete block design (EYT, ET, LT, UEOPN, UMOPN), depending on the experiment type (available at T3/Oat database, https://oat.triticeaetoolbox.org). This dataset, typical of plant breeding evaluations, is highly unbalanced because not all genotypes were evaluated across all combinations of locations and years.
The study also used the genotypic data from the ‘GBS POGI’ genotype protocol (available at https://oat.triticeaetoolbox.org/breeders_toolbox/protocol/8) from T3/Oat database (available at https://oat.triticeaetoolbox.org), consisting of 1189 genotypes with genotyping-by-sequencing derived single-nucleotide polymorphisms (SNPs). After filtering for a minor allele frequency >0.05 and missing data <20%, there were 3034 high-quality SNPs.
Phenotypic data analyses for GGE biplot and ME delineation
Given the high level of sparsity in the dataset and the fact that proper two-step models tend to perform similarly to single-step models but are less computationally intensive and do not have as many convergence problems (Piepho et al. 2012), a two-step approach was used for obtaining best linear unbiased estimates (BLUEs) of grain yield for each genotype at each location for GEI characterisation. In the first step, genotypic BLUEs for grain yield were obtained after controlling for multiple experiments within a location–year combination using linear mixed models, with experiment within location–year combination modelled as random effects. In the second step, genotypic BLUEs for grain yield in each location–year combination were modelled using the following linear mixed model in the asreml-r (Butler et al. 2020) package of R statistical software (R Development Core Team 2017):
where yij is the genotypic BLUE for grain yield of the ith genotype in the jth environment (i.e. location–year combination), μ is the overall mean or intercept, gi is the effect of the ith genotype, ej is the effect of the jth environment, geij is the effect of the interaction of the ith genotype evaluated in the jth environment with ge ~ N(0,∑), and εij is the residual error with ε ~ N(0,R). Here, ∑ is the variance–covariance matrix of the GEI, with where ∑G(g×g) is the realised additive relationship matrix estimated with the molecular markers using the VanRaden (2008) method in the package AGHmatrix (Amadeu et al. 2016) in R statistical software, and ∑E(e×e) is the genotypic variance–covariance matrix among environments modelled as a factor analytic of order 1 (FA1); R([g×e]×[g×e]) is the variance–covariance matrix of residuals and was modelled as a diagonal matrix with the reciprocals of the standard error of the BLUEs for each genotype in each environment to account for the heterogeneity in the precision of mean estimates in the two-step model following Piepho et al. (2012). However, not all genotypes were used in this second step because of the high level of sparsity. Therefore, a subset of 2000 genotypes that had been evaluated in at least four environments was included in the second step. This ended up accounting for ~82% of all data information. Of this subset, 401 genotypes had phenotypic and genotypic information. Variance components were estimated from a modification of Model 1, where genotype × environment was modelled fully by genotype × location × year interaction (see Table S2 for a full description of the model).
Mega-environments were then delineated by GGE (genotype + GEI) biplot analysis from the grain yield BLUEs for each location using the package GGEplot (Dumble et al. 2017) in R statistical software. Basically, a singular value decomposition of the genotypic main effect and GEI matrix was conducted (Yan et al. 2000; Yan and Tinker 2006) and then it was graphically represented in a biplot (Gabriel 1971; Yan and Tinker 2006). A GGE2 biplot was used for this representation. Winning genotypes were then used to delineate MEs from the GGE2 model (Yan and Tinker 2006). For this analysis a modification of Model 1 was used (see Table S2 for details).
Genomic prediction models
Genomic predictions were accomplished using small modifications from the general GBLUP model described in Model 1 with a full description of all of the prediction strategies in Table S2. When no explicit GEI was modelled, the general model was denoted GBLUPM following the nomenclature of Lado et al. (2016). On the other hand, when GEI (geij) was modelled with , with some type of variance–covariance structure for ∑E, the model was denoted as GBLUPG×E following the Burgueño et al. (2012) model and the nomenclature of Lado et al. (2016). GBLUPG×E assumes known environments where the variance–covariance relationship matrix can be estimated.
Genomic prediction cross-validation schemes
Several cross-validation schemes were implemented to address different prediction goals and scenarios. In all the cross-validation scenarios, a portion of the phenotypic dataset is masked, the remaining data are used to predict their performance, and the predictive ability, or correlation between the predicted and observed values, is estimated. One of the interesting prediction scenarios is the prediction of the performance of genotypes that have not yet been evaluated in any environment. Burgueño et al. (2012) called this strategy a CV1. We used the CV1 strategy with a 10-fold cross-validation scheme. Each iteration of the 10-fold cross-validation consists of (1) randomly splitting the dataset into 10 subsets; (2) using nine of the subsets to predict the remaining subset; (3) repeating the previous step multiple times for predicting the remaining nine subsets; and (4) estimating the correlation between observed and predicted values for the full set. The CV1 strategy was used for an overall prediction of the dataset and for predicting the performance in each ME using 100 iterations.
Another prediction scenario consisted of the leave-one-environment-out prediction strategy that Jarquín et al. (2017) called CV0. In this case, all of the phenotypic data for an environment at a time are masked and data from the remaining environments used for the prediction of the new environment. We evaluated six different scenarios with the CV0 approach. First, within MEs the GBLUPM model was used to predict the new or masked location (CV0LOC|M). With this strategy, we assume that GEI within MEs is very low and that locations can be properly grouped in MEs even before new performance data are available. Second, within MEs the GBLUPG×E model was used to predict the new or masked locations (CV0LOC|GEI). This situation assumes that the GEI within MEs, although small, is known and can be used to model the variance–covariance structure. Our next scenarios consisted of the leave-one-year-out strategy within each ME. For these scenarios, we used the GBLUPM model assuming unknown genotype × year relationships. We then predicted either each year within a location (CV0Y|LOC), or each year within an ME (CV0Y|ME). The predictions by location were performed only for the three largest locations in each ME (i.e. Minot ND, Wayland NY and West Lafayette IN for ME1; Crookston MN, Ithaca NY and Morris MN for ME2; and Brookings SD, Madison WI and Urbana IL for ME3; see Table S1). Using only the largest locations may create an upward bias in predictive ability due to the population size effect. On the other hand, in the predictions for the whole ME, both genotype × year and genotype × location will affect the predictive ability. Although year-to-year variability is random and years cannot be reproduced, an understanding of the stability of the predictions from year to year can be valuable in the decision process of choosing genotypes. Finally, we used overall predictions (instead of by ME) for the CV0LOC|M and CV0Y|ME scenarios. All of these models and strategies are fully described in Table S2, and in all cases, predictive ability was evaluated as the correlation between predicted and observed genotypic values.
A third prediction scenario was the use of different numbers of previous years to predict the current year. We use a sliding-window approach where we consider periods of 3, 5, 10, 15, and 20 years to predict the genotypic performance, moving one year at a time in the range between 1997 and 2021 (i.e. we use 1997, 1998 and 1999 to predict the year 2000). We used a modification of Model 1 to account for the year, location and interactions. A full description of this model is presented in Table S2. The predictive ability was evaluated as the correlation between predicted and observed genotypic values for each year.
For all of the genomic predictions with cross-validations, a subset of 401 oat genotypes of the 5220 with 3034 high-quality GBS-derived SNP markers (minor allele frequency >0.05 and missing data <20%) was used. Additionally, predictions for specific MEs were only performed for ME1–ME3 because ME4 consists of a single location and therefore no cross-validation schemes were evaluated for this ME.
Genomic prediction model for variety decision tool
We also predicted the performance of all 1180 genotypes for which marker information was available for the variety decision tool. Genotypes had a large range of phenotypic information available in the dataset, ranging from no phenotypic evaluation to evaluation in 53 environments. The GBLUPM model was used for this purpose in the asreml-r package of R statistical software. Prediction error variance (PEV), accuracy and reliability were estimated for each genotype following Gezan (2020). PEV was estimated as the squared standard error of the genotypic effects () as follows:
Accuracy (h) was estimated as the correlation between true and predicted ( effects:
Reliability (r) was estimated as the squared accuracy:
The variety decision tool has two goals: to serve farmers and to serve oat breeders in the Midwest US. The identification of superior oat genotypes for each TPE can aid oat breeders in the identification of release candidates for a specific region or in the identification of parents for future crosses. On the other hand, by filtering the dataset to genotypes that have been released (i.e. varieties) and that are available for sale in the Midwest (surveyed in November 2020), the decision tool can aid farmers in the identification of superior varieties for their local environment. Therefore, both the top 10 genotypes and the top 10 varieties were identified for each TPE. The variety decision tool is hosted on a web server by the Practical Farmers of Iowa (https://decide.practicalfarmers.org/).
Results
Phenotypic data summary
This study evaluated 5220 genotypes for grain yield across 59 locations in 25 years resulting in 665 location–year (environment) combinations. BLUEs for grain yield ranged from 74.9 to 798 g m−2 with a median of 416 g m−2 across locations (Table S1), and substantial GEI was found (Fig. 1).
Genotype × environment interaction characterisation and mega-environment (ME) delineation for a historical dataset for grain yield of oat genotypes evaluated in 59 locations in nine states in the Midwest United States from 1997 to 2021: (a) GGE biplot for grain yield showing grouping of the 59 locations into four MEs; (b) smoothed map of the four oat MEs for grain yield; (c) variance decomposition of the phenotypic variation for grain yield; (d) pie chart of the variance decomposition of the phenotypic variation for grain yield.
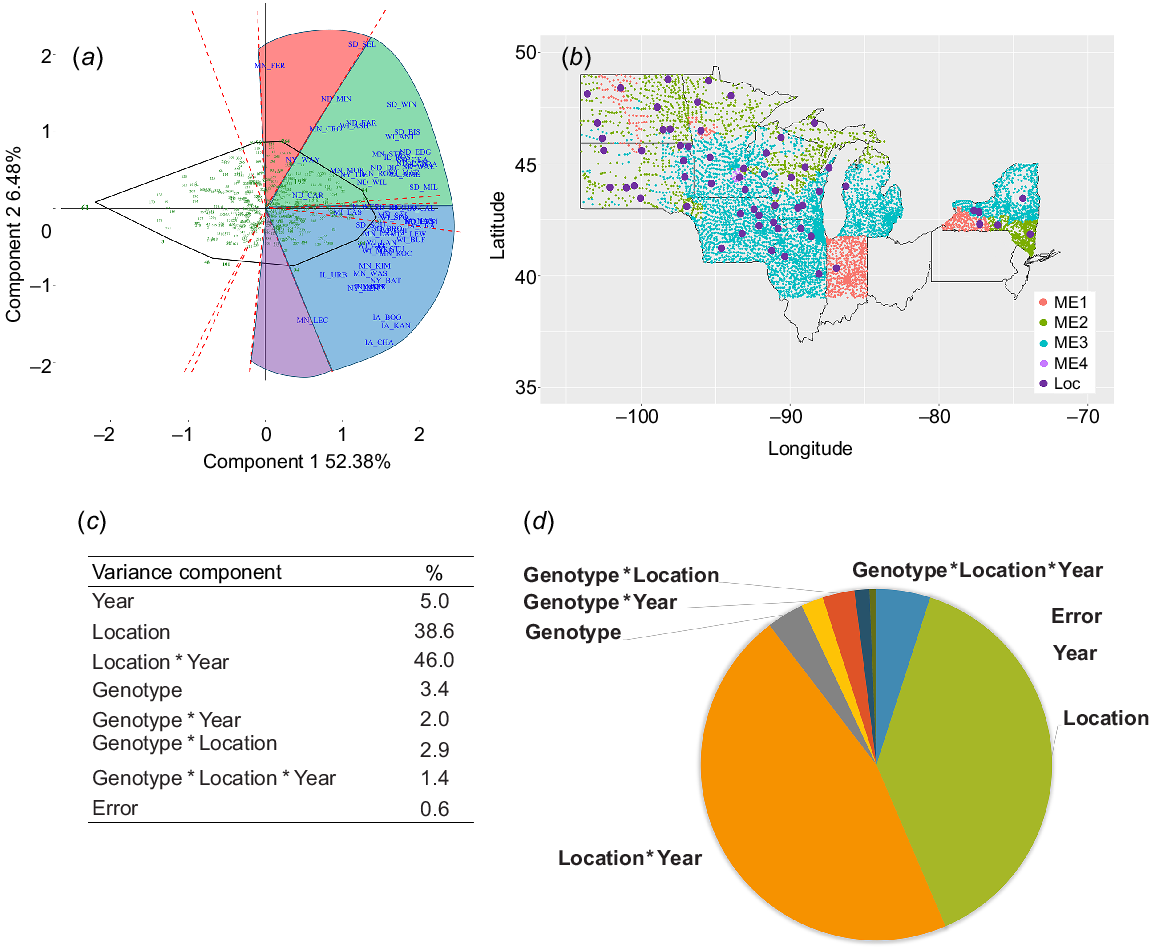
GEI characterisation
Mega-environment delineation using GGE biplot analysis of grain yield BLUEs for each of the 59 locations explained 58.7% of the observed phenotypic variation (Fig. 1a). Four MEs were identified based on the winning genotypes on the genotypic polygon (Fig. 1a, b). ME3a and ME3b had different winning genotypes but similar overall ranking of the genotypes and were merged into a single ME3 for further analysis. The percentage of the variance explained by the GEI was 1.85 times higher than the genotypic variance (Fig. 1c, d).
Genomic prediction with different cross-validation strategies
The predictive ability for grain yield for un-phenotyped genotypes in the 10-fold CV1 strategy within MEs ranged from 0.45 (ME1) to 0.65 (ME3) with an overall (all MEs combined) predictive ability of 0.57 (Fig. 2, Table S3). When using CV0 for leave-one-location-out within ME with the GBLUPM modelling approach (CV0LOC|ME), ME2 and ME3 had the highest predictive ability with an average of 0.55 (range 0.20–0.89 for ME2 and 0.16–0.82 for ME3, Fig. 2), followed by ME1 with an average of 0.28 (range 0.15–0.51). When using the GBLUPG×E modelling approach in CV0 for leave-one-location-out (CV0LOC|GEI), ME3 had the highest predictive ability with an average of 0.55 (range 0.14–0.87, Fig. 2), followed by ME2 with an average of 0.47 (range 0.23–0.85) and ME1 with an average of 0.36 (range 0.19–0.32).
Predictive ability within and across mega-environments (MEs) for different cross-validation strategies for an oat dataset consisting of genotypes evaluated in 59 locations in the Midwest United States over 25 years. CV1 used a 10-fold cross-validation strategy for predicting the performance of genotypes that have not been evaluated in any environment within an ME (ME1–ME3) or overall. CV0LOC|M used leave-one-location-out with an average GBLUP modelling approach (GBLUPM) within each ME. CV0LOC|GEI used leave-one-location-out with a GEI GBLUP modelling approach (GBLUPG×E) within each ME. CV0Y|LOC used leave-one-year-out with a GBLUPM modelling approach within each location. CV0Y|ME used leave-one-year-out with a GBLUPM modelling approach within each ME. The predictive ability was estimated as the correlation between predicted and observed values.
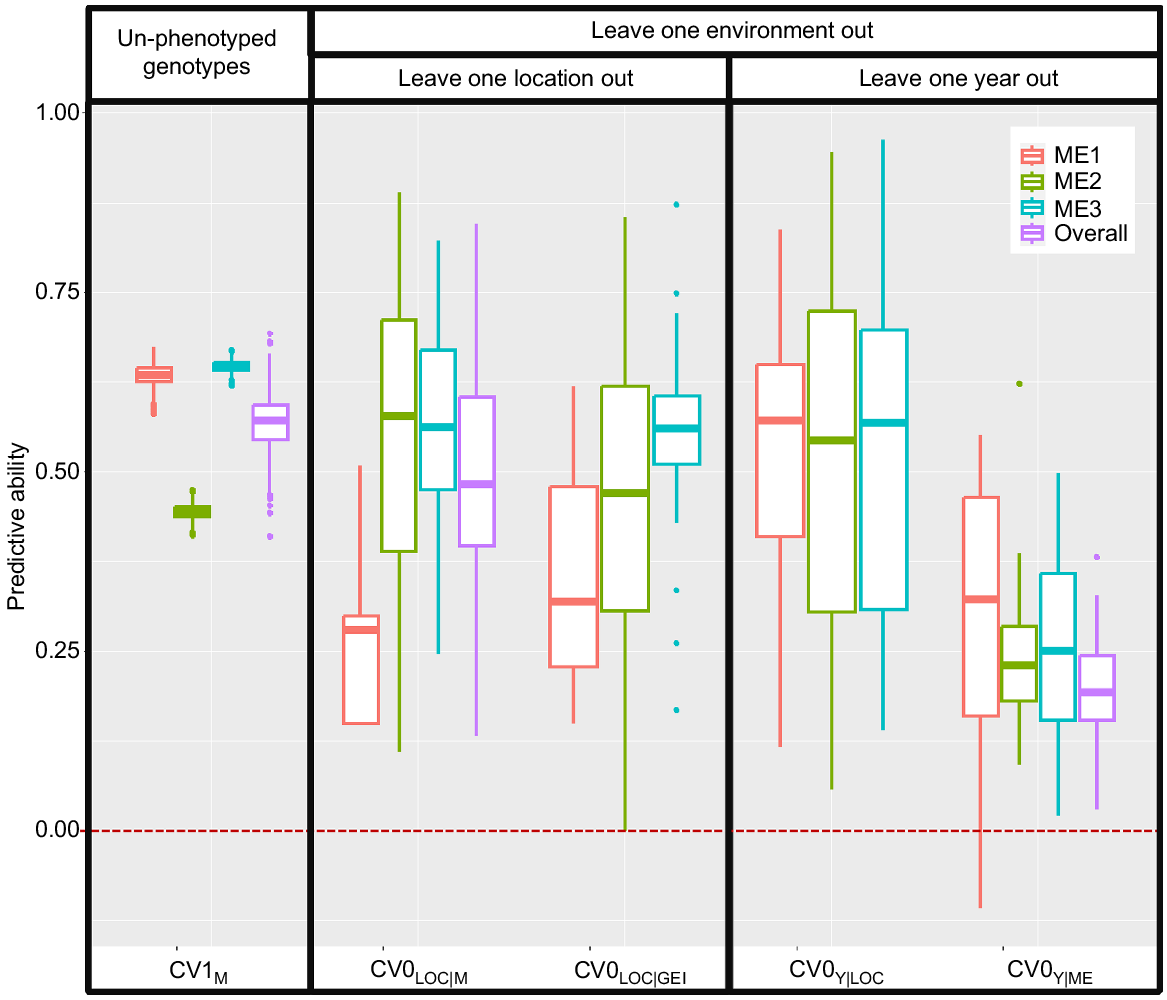
The predictive ability for CV0 for the leave-one-year-out model was 0.29 for ME1 (range 0.20–0.55, Fig. 2), 0.29 for ME2 (range 0.10–0.62) and 0.25 for ME3 (range 0.12–0.50) when predicting years within ME (CV0Y|ME, Fig. 2). When predicting for locations within MEs (CV0Y|LOC) we obtained higher predictive values with a wide range of variation: 0.52 (0.10–0.83) for ME1, 0.51 (0.05–0.95) for ME2, and 0.53 (0.20–0.96) for ME3.
Non-repeatable GEI and years
When using the previous years to predict the next year, predictive abilities using 3, 5, 10, 15 and 20 years were similar in most cases. The overall predictive ability using the most recent 3 years was highest in 45% of the years and within 20% of the highest predictive ability in 20% of the years (Fig. 3). The three most recent years had highest or within the highest predictive ability in 75% (65% highest, 10% not different) of the years for ME1, in 75% (50% highest, 25% not different) of the years for ME2, and in 80% (40% highest, 40% not different) of the years for ME3. The predictive ability using >3 years tended to be better when the general predictive ability was low, such as in 2005, 2013 and 2021, possibly associated with an unusual weather or stress year.
Predictive ability using previous 3, 5, 10, 15 or 20 years to predict the current year across (overall) or within mega-environments (ME1, ME2, ME3) for an oat dataset where genotypes were evaluated in 59 locations in the Midwest United States over 25 years: (a) overall predictions, and predictions for (b) ME1, (c) ME2 and (d) ME3.

Genomic prediction for the variety decision tool
Although the accuracy and reliability of released varieties were higher than those of the advanced breeding lines or general genotypes, the actual predicted values were lower (Tables 1 and 2). None of the 10 genotypes differed >2% from the top-yielding genotype in the overall and ME2 predictions of genotypes (Table 1); meanwhile, the first six or four genotypes were within 2% of the top-performing genotype in ME1 and ME2, respectively. On the other hand, there were six commercial varieties with <2% difference from the top-performing variety in the overall predictions, four in ME1, and two in ME2 and ME3 (Table 2).
| Genotype | Ranking | BLUP (g m−2) | PEV | Accuracy (h) | Reliability (r) | Genotype | Ranking | BLUP (g m−2) | PEV | Accuracy (h) | Reliability (r) | |
|---|---|---|---|---|---|---|---|---|---|---|---|---|
| Overall | ME1 | |||||||||||
| WIX10627.3 | 1 | 531 | 491 | 0.69 | 0.47 | SD111922 | 1 | 554 | 178 | 0.90 | 0.81 | |
| SD150012 | 2 | 531 | 200 | 0.89 | 0.78 | SD111946 | 2 | 553 | 178 | 0.90 | 0.81 | |
| SD150081 | 3 | 528 | 263 | 0.85 | 0.72 | SD111931 | 3 | 552 | 178 | 0.90 | 0.81 | |
| MN11139 | 4 | 526 | 146 | 0.92 | 0.84 | SD111939 | 4 | 552 | 176 | 0.90 | 0.81 | |
| MN11140 | 5 | 526 | 152 | 0.91 | 0.84 | SD081108 | 5 | 550 | 172 | 0.90 | 0.81 | |
| SD120640 | 6 | 525 | 170 | 0.90 | 0.82 | HAYDEN | 6 | 549 | 175 | 0.90 | 0.81 | |
| WIX10679.1 | 7 | 524 | 336 | 0.80 | 0.64 | SD111753 | 7 | 535 | 245 | 0.86 | 0.74 | |
| SD150112 | 8 | 524 | 308 | 0.82 | 0.67 | SD111736 | 8 | 534 | 245 | 0.86 | 0.74 | |
| MN11231 | 9 | 523 | 165 | 0.91 | 0.82 | NATTY | 9 | 530 | 246 | 0.86 | 0.74 | |
| MNBT1021.1 | 10 | 523 | 156 | 0.91 | 0.83 | SD081107 | 10 | 530 | 230 | 0.87 | 0.75 | |
| ME2 | ME3 | |||||||||||
| SD081577 | 1 | 512 | 226 | 0.87 | 0.76 | SD120638 | 1 | 488 | 221 | 0.87 | 0.76 | |
| SD081563 | 2 | 509 | 225 | 0.87 | 0.76 | SD120640 | 2 | 482 | 223 | 0.87 | 0.76 | |
| MN05119 | 3 | 508 | 224 | 0.87 | 0.76 | IL10.9867 | 3 | 480 | 228 | 0.87 | 0.75 | |
| MN11211 | 4 | 507 | 381 | 0.77 | 0.59 | SD150112 | 4 | 478 | 323 | 0.81 | 0.65 | |
| MN10209 | 5 | 506 | 289 | 0.83 | 0.69 | SD150012 | 5 | 477 | 247 | 0.86 | 0.73 | |
| OA1250.2 | 6 | 506 | 352 | 0.79 | 0.62 | SD150081 | 6 | 476 | 331 | 0.80 | 0.64 | |
| MN06108 | 7 | 503 | 442 | 0.72 | 0.52 | WIX10627.3 | 7 | 474 | 603 | 0.59 | 0.35 | |
| MN07204 | 8 | 503 | 292 | 0.83 | 0.69 | SD141130 | 8 | 474 | 296 | 0.83 | 0.68 | |
| WIX10199.6 | 9 | 502 | 454 | 0.72 | 0.51 | MN11140 | 9 | 474 | 185 | 0.89 | 0.80 | |
| SD081949 | 10 | 502 | 243 | 0.86 | 0.74 | WIX10679.1 | 10 | 474 | 371 | 0.78 | 0.60 | |
Genotype name, ranking, predicted value for grain yield (best linear unbiased prediction, BLUP), predictor error variance (PEV), accuracy (h) and reliability (r) are shown for each genotype. Predictions are across all environments (Overall model), and for mega-environments ME1, ME2 and ME3.
| Genotype | Ranking | BLUP (g m−2) | PEV | Accuracy (h) | Reliability (r) | Genotype | Ranking | BLUP (g m−2) | PEV | Accuracy (h) | Reliability (r) | |
|---|---|---|---|---|---|---|---|---|---|---|---|---|
| Overall | ME1 | |||||||||||
| DEON | 1 | 488 | 68 | 0.96 | 0.93 | AAC ROSKENS | 1 | 501 | 313 | 0.81 | 0.66 | |
| CDC MINSTREL | 2 | 486 | 177 | 0.90 | 0.81 | CDC MINSTREL | 2 | 499 | 187 | 0.89 | 0.80 | |
| ESKER2020 | 3 | 483 | 89 | 0.95 | 0.90 | AC PINNACLE | 3 | 499 | 181 | 0.90 | 0.81 | |
| AC PINNACLE | 4 | 481 | 167 | 0.91 | 0.82 | AAC BULLET | 4 | 498 | 333 | 0.80 | 0.64 | |
| HAYDEN | 5 | 479 | 62 | 0.97 | 0.93 | NEWBURG | 5 | 486 | 121 | 0.93 | 0.87 | |
| NATTY | 6 | 479 | 78 | 0.96 | 0.92 | SOURIS | 6 | 483 | 120 | 0.93 | 0.87 | |
| AAC ROSKENS | 7 | 477 | 219 | 0.87 | 0.76 | DEON | 7 | 482 | 168 | 0.90 | 0.82 | |
| RON | 8 | 469 | 83 | 0.95 | 0.91 | AAC OAKLIN | 8 | 482 | 306 | 0.82 | 0.67 | |
| GOLIATH | 9 | 468 | 79 | 0.96 | 0.91 | AAC ALMONTE | 9 | 481 | 305 | 0.82 | 0.67 | |
| NEWBURG | 10 | 467 | 61 | 0.97 | 0.93 | HAYDEN | 10 | 480 | 117 | 0.93 | 0.87 | |
| ME2 | ME3 | |||||||||||
| HAYDEN | 1 | 549 | 175 | 0.90 | 0.81 | ESKER2020 | 1 | 436 | 116 | 0.94 | 0.88 | |
| NATTY | 2 | 530 | 246 | 0.86 | 0.74 | DEON | 2 | 430 | 82 | 0.96 | 0.91 | |
| EXCEL | 3 | 515 | 253 | 0.85 | 0.73 | NATTY | 3 | 425 | 98 | 0.95 | 0.89 | |
| HORSEPOWER | 4 | 512 | 222 | 0.87 | 0.76 | HAYDEN | 4 | 415 | 76 | 0.96 | 0.92 | |
| SOURIS | 5 | 507 | 152 | 0.91 | 0.84 | GOLIATH | 5 | 415 | 97 | 0.95 | 0.90 | |
| NEWBURG | 6 | 506 | 183 | 0.90 | 0.80 | RON | 6 | 413 | 106 | 0.94 | 0.89 | |
| GOLIATH | 7 | 504 | 201 | 0.89 | 0.78 | CDC MINSTREL | 7 | 408 | 201 | 0.89 | 0.78 | |
| SHELBY427 | 8 | 502 | 228 | 0.87 | 0.75 | BETAGENE | 8 | 407 | 96 | 0.95 | 0.90 | |
| ROCKFORD | 9 | 502 | 258 | 0.85 | 0.72 | SHELBY427 | 9 | 404 | 66 | 0.96 | 0.93 | |
| CORRAL | 10 | 501 | 361 | 0.78 | 0.61 | EXCEL | 10 | 404 | 102 | 0.94 | 0.89 | |
Genotype name, ranking, predicted value for grain yield (best linear unbiased prediction, BLUP), predictor error variance (PEV), accuracy (h) and reliability (r) are shown for each genotype. Predictions across all environments (Overall model), and for mega-environments ME1, ME2 and ME3.
Discussion
Genomic prediction success and strategies
In oat, genomic prediction models have been used to assess prediction accuracy showing potential to improve disease resistance (Haikka et al. 2020a), seed quality (Campbell et al. 2021; Hu et al. 2021), grain yield (Haikka et al. 2020b), nutritional compounds and other metabolites (Brzozowski et al. 2022a, 2022b, 2023), and other quantitative traits (Asoro et al. 2011), as well as testing optimisation (González-Barrios et al. 2019). Our study has looked at other aspects of genomic prediction including the prediction for specific TPEs, and we have achieved relatively high predictive abilities of ~0.45–0.65 for new genotypes and 0.15–0.89 for new environments for a trait as complex as grain yield.
Deploying big data in genomic selection for predicting for the TPE
Genotype × environment interactions create many challenges for breeding programs, some of which are easier to deal with than others (Piepho et al. 2008). Under GEI, the efficiency of the prediction relies on the representativity of the tested environments and how they are used for the construction of the training population (Haile et al. 2020; Atanda et al. 2022; Jarquin 2022). Genomic selection can take advantage of large historical datasets by connecting the phenotypic information from different genotypes through borrowing of information from relatives and thus controlling the sparsity (Bernardo 2010; Dawson et al. 2013; Lado et al. 2016; Monteverde et al. 2018) and producing higher predictive ability (Endelman et al. 2014; González-Barrios et al. 2019; Hoefler et al. 2020; Atanda et al. 2021a, 2021b). Therefore, the use of big data consisting of large historical datasets where individual genotypes, or their relatives, have been evaluated can substantially improve the identification of superior individuals that will perform better in the TPE.
Large MET historical datasets have their own constraints (i.e. sparsity and breeding structure) that need to be addressed in order to make efficient use of the available databases. How best to handle the level of sparsity is an ongoing area of research given that genotypes are not missing at random in the dataset because poorer performing genotypes are dropped every year (Aguate et al. 2019; Hartung and Piepho 2021; Wang et al. 2023). Other relevant limitations for the use of large datasets are due to the complexity of the data, the statistical models, and the requirement of great computational power (Atanda et al. 2021b). This study utilised a highly unbalanced dataset from several different METs across 25 years to investigate the use of a mixed model approach in characterising GEI, identifying MEs associated with the TPEs, and determining the potential of genomic selection of grain yield. Overall, the results obtained in the study show the high predictive abilities of large-scale historical data in genomic prediction.
The management of GEI and information leverage is determined by the size and overlap of the ME and TPE areas. MEs can be defined based on the breeding program necessities, adopting different spatial scales (i.e. at a regional scale, González-Barrios et al. 2019; country-wide scale, Crespo-Herrera et al. 2021; or worldwide, Braun et al. 1997). We used defined MEs by providing a broad idea of the GEI in the Midwest region of the United States. Although the TPE might be smaller or larger than the MEs, using the ME definition can be beneficial. For example, the use of information from other locations can still aid in the prediction for TPEs that are smaller than the MEs by increasing the number of evaluations in environments with low GEI. On the other hand, in the case where the TPEs are larger than the MEs or go beyond the limits of a single ME, the use ME units will allow, for example, tailoring of the MET evaluations to account for the variation that exists between MEs in the TPE, and the breeder will need to decide on the release strategies for this case. Furthermore, this work is focused on the use of the groups of locations defined as a TPE instead of predicting locations per se. The shift from a specific location to a TPE is grounded in the fact that performance of farmers’ fields will rarely coincide with the evaluations that breeders perform in research stations; therefore, a focus on predicting individual locations might not be useful for the goal of the breeding program unless it is used as an intermediate step in the prediction process. We were able to predict all MEs with a high level of predictive ability. Furthermore, we tested a situation where GEI within MEs was not modelled (CV0LOC|M) and a situation where GEI within ME was modelled using a variance–covariance matrix that accounts for genetic correlations between locations (CV0LOC|GEI). The use of the known correlation structure did not improve the predictive ability reported in other studies (Lado et al. 2016). There could be multiple reasons for this, including the level of GEI within the ME, an artifact due to the population size, or the level of unbalance in the population (Bassi et al. 2016; Lado et al. 2018; Berro et al. 2019), or just the fact that specific location-to-location GEI becomes less relevant when the number of locations is very large. Although the mean predictive ability did not improve with modelling the GEI, the variability in the predictive ability for each location decreased with the GBLUPG×E model. Arguments can be made that the correlation between environments cannot be known for new locations or for farmers’ fields, and therefore, they should not be used in the prediction models. However, if the focus remains on the overall predictions within MEs, modelling the correlation is just another modelling tool that can be deployed, especially when large historical datasets are used where the estimation of those correlations might be more relevant. Another opportunity to improve predictions when no previous information is available is by incorporating environmental covariates explaining the genotypic performance in the ME (Bustos-Korts et al. 2016; van Eeuwijk et al. 2016; Monteverde et al. 2019; Neyhart et al. 2022; Rebollo et al. 2023). An advantage of the use of environmental covariates is that they may help to fine-tune the limits and boundaries of the ME through the definition of growing zones and modelling the crop growth (Heslot et al. 2013; Bustos-Korts et al. 2016, 2021; Monteverde et al. 2019). Although we did not use environmental covariates in this study, high–medium predictive abilities were obtained. However, we believe that the future use of environmental covariates could improve the predictive ability of these models and help in the delineation of MEs.
Although we obtained high levels of predictive ability for all MEs, the performance of genotypes was easier to predict in some MEs than in others. For example, ME1 had consistently low predictive ability (i.e. <0.4); this was expected because the number of locations within the ME was only five. This ME was the only one that benefited from modelling the genetic correlations among locations using the GBLUPG×E model, where predictive ability increased from 0.27 to 0.36. This is also an artifact of the low number of locations, where the specific pairwise correlations have a larger impact than in the case of the other MEs with dozens of locations, where specific location-to-location interactions are overall less relevant.
Non-repeatable GEI and years
Year-to-year variation is known to explain an important part of the GEI variation in METs and, more importantly, for being nonreproducible. Furthermore, because many plant breeding programs rely on the evaluation of individuals in a small sample of years, genotypes with positive genotype × year interactions in testing years can be advanced when they would not necessarily have a superior performance in average years for the region. Therefore, datasets with more years may reduce the bias associated with the unbalance in METs, improve the variance component estimation (Aguate et al. 2019; Hartung and Piepho 2021), and improve the actual genotypic predictions (Oakey et al. 2016). Our results suggest that increasing the number of years beyond the last 3 years will not improve the predictive ability of the upcoming unknown year. This could be partially explained by the higher connectivity in the genotypic pool between consecutive years. Some years had a low predictive ability regardless of the set of years used in the prediction model. These are years with unusual weather patterns and some abiotic stresses. The odd performance in those years will be very difficult to predict regardless of the amount of previous information we use or have available. ME1 had 20% of years with a predictive ability <0.1, whereas ME3 had only 5% of years with low predictive ability. This can be partially explained by the population size and the frequency of climatic stresses present in the ME.
We also evaluated the predictive ability for specific years within the ME (CV0Y|ME) and for specific years within locations (CV0Y|LOC). The predictions for specific locations were higher (0.20–0.90) than the predictions for the whole ME (0.10–0.60). Multiple factors can explain these findings. The locations used to test the year-to-year variability had more data points and specifically more years than the average location in any given ME. Additionally, predictions for specific locations might not be as relevant as predictions for the ME, as previously discussed. Finally, predictions for the ME include both genotype × year and genotype × location interactions, and although in many cases genotype × year interactions are larger than genotype × location, in our case, they were of the same magnitude. Although in a breeding program we are not able to replicate a year or predict the type of year that will come next, evaluation of the predictions is relevant for understanding the stability in the predictions that can be expected from year to year in real future evaluations.
Variety decision tools and prospects
To the best of our knowledge, ours is the first study to deliver a variety decision tool for farmers in the Midwestern United States based on the farm’s location. There is a limited list of genotypes that are relevant to farmers, and those are genotypes that have been released as a cultivar and are currently commercially available. These genotypes are usually connected in METs because they were tested as advanced breeding lines and, later, most probably continued to be tested in regional trials. However, because there is no unified variety testing system in the United States, the list of varieties to be tested in each state is tailored and therefore differs from the lists to be tested in other states. The reports are then usually provided on a location-by-location basis, or in some cases, a state-wide recommendation is provided. How years are dealt in those reports is also state-specific but most of the states do not report any information beyond 3 years of data. This reporting system creates difficulties at several levels. For example, it is hard for farmers to decide which data to rely on for selecting the best performing varieties for their specific farm. This is especially challenging for farmers close to state borders or far from the specific, sparse testing locations for their state. Furthermore, there is no reason for limiting the flow of information across state borders. The use of MEs to delineate TPEs and the grouping of locations improves the accuracy of predictions and allows the distribution of resources in a more efficient way than by location-state evaluation sheets. This helps to create more efficient delivery of higher quality information to farmers. Finally, being able to include the information from advanced breeding lines is also key to improving the prediction of the future released varieties. This can be seen, for example, in the higher accuracy and reliability values for varieties than for advanced breeding genotypes, which may not have as many relatives in the dataset. This is also reflected in the mean differences between experimental genotypes and varieties, where varieties are >2% apart. This decision tool is being created as a first exploratory strategy. It represents an improvement over state reports, but further development would improve the predictions. For example, a very simple strategy was used to delineate the borders of the MEs, but environmental covariates could be used to refine these delineations further following the work of Rebollo et al. (2023) and Bustos-Korts et al. (2021). Additionally, environmental covariates could be used to improve the actual predictions. In summary, the strategy used in this study will assist in developing a tool for selecting the top-ranking genotypes in specific locations, using a zip-code-based system in the Midwest region, via the deployment of the genomic selection model in each TPE. Similar strategies could be expanded to other crops in any region around the world.
Data availability
All data are publicly available in T3/Oats database, and data used in this study were from 1 May 2023.
Declaration of funding
This project was partially funded through multiple competitive Federal awards from the from the United States Department of Agriculture, National Institute of Food and Agriculture, including the USDA-SARE 2018-LNC18-400, by the Hatch Act Formula Fund WISO1984 and WIS03002, the USDA-AFRI-NIFA-OREI 2020-51300-32379 and 2023-51300-40916, and the USDA-AFRI-NIFA 2022-68013-36439 (WheatCAP).
Acknowledgements
We thank the USDA-ARS Small Grain Genotyping Center, Fargo, North Dakota, for its genotyping service. The authors also thank two anonymous reviewers and the editor for thoughtful comments that improved the manuscript.
References
Aguate F, Crossa J, Balzarini M (2019) Effect of missing values on variance component estimates in multienvironment trials. Crop Science 59(2), 508-517.
| Crossref | Google Scholar |
Amadeu RR, Cellon C, Olmstead JW, Garcia AAF, Resende MFR, Jr., Muñoz PR (2016) AGHmatrix: R package to construct relationship matrices for autotetraploid and diploid species: a blueberry example. The Plant Genome 9(3), plantgenome2016.01.0009.
| Crossref | Google Scholar |
Asoro FG, Newell MA, Beavis WD, Scott MP, Jannink J-L (2011) Accuracy and training population design for genomic selection on quantitative traits in elite North American oats. The Plant Genome 4(2), plantgenome2011.02.0007.
| Crossref | Google Scholar |
Atanda SA, Olsen M, Burgueño J, Crossa J, Dzidzienyo D, Beyene Y, Gowda M, Dreher K, Zhang X, Prasanna BM, Tongoona P, Danquah EY, Olaoye G, Robbins KR (2021a) Maximizing efficiency of genomic selection in CIMMYT’s tropical maize breeding program. Theoretical and Applied Genetics 134(1), 279-294.
| Crossref | Google Scholar | PubMed |
Atanda SA, Olsen M, Crossa J, Burgueño J, Rincent R, Dzidzienyo D, Beyene Y, Gowda M, Dreher K, Boddupalli PM, Tongoona P, Danquah EY, Olaoye G, Robbins KR (2021b) Scalable sparse testing genomic selection strategy for early yield testing stage. Frontiers in Plant Science 12, 658978.
| Crossref | Google Scholar | PubMed |
Atanda SA, Govindan V, Singh R, Robbins KR, Crossa J, Bentley AR (2022) Sparse testing using genomic prediction improves selection for breeding targets in elite spring wheat. Theoretical and Applied Genetics 135(6), 1939-1950.
| Crossref | Google Scholar | PubMed |
Atlin GN, Kleinknecht K, Singh KP, Piepho HP (2011) Managing genotype × environment interaction in plant breeding programs: a selection theory approach. Journal of the Indian Society of Agricultural Statistics 65(2), 237-247.
| Google Scholar |
Bassi FM, Bentley AR, Charmet G, Ortiz R, Crossa J (2016) Breeding schemes for the implementation of genomic selection in wheat (Triticum spp.). Plant Science 242, 23-36.
| Crossref | Google Scholar | PubMed |
Bernardo R (1996) Best linear unbiased prediction of maize single-cross performance. Crop Science 36(1), 50-56.
| Crossref | Google Scholar |
Berro I, Lado B, Nalin RS, Quincke M, Gutiérrez L (2019) Training population optimization for genomic selection. The Plant Genome 12(3), 190028.
| Crossref | Google Scholar |
Bhatta M, Gutierrez L, Cammarota L, Cardozo F, Germán S, Gómez-Guerrero B, Pardo MF, Lanaro V, Sayas M, Castro AJ (2020) Multi-trait genomic prediction model increased the predictive ability for agronomic and malting quality traits in barley (Hordeum vulgare L.). G3 Genes|Genomes|Genetics 10(3), 1113-1124.
| Crossref | Google Scholar | PubMed |
Boer MP, Wright D, Feng L, Podlich DW, Luo L, Cooper M, van Eeuwijk FA (2007) A mixed-model quantitative trait loci (QTL) analysis for multiple-environment trial data using environmental covariables for QTL-by-environment interactions, with an example in maize. Genetics 177(3), 1801-1813.
| Crossref | Google Scholar | PubMed |
Brzozowski LJ, Campbell MT, Hu H, Caffe M, Gutiérrez L, Smith KP, Sorrells ME, Gore MA, Jannink J-L (2022a) Generalizable approaches for genomic prediction of metabolites in plants. The Plant Genome 15(2), e20205.
| Crossref | Google Scholar | PubMed |
Brzozowski LJ, Hu H, Campbell MT, Broeckling CD, Caffe M, Gutiérrez L, Smith KP, Sorrells ME, Gore MA, Jannink J-L (2022b) Selection for seed size has uneven effects on specialized metabolite abundance in oat (Avena sativa L.). G3 Genes|Genomes|Genetics 12(3), jkab419.
| Crossref | Google Scholar |
Brzozowski LJ, Campbell MT, Hu H, Yao L, Caffe M, Gutiérrez L, Smith KP, Sorrells ME, Gore MA, Jannink J-L (2023) Genomic prediction of seed nutritional traits in biparental families of oat (Avena sativa). The Plant Genome 16(4), e20370.
| Crossref | Google Scholar | PubMed |
Burgueño J, Crossa J, Cornelius PL, Yang R-C (2008) Using factor analytic models for joining environments and genotypes without crossover genotype × environment interaction. Crop Science 48(4), 1291-1305.
| Crossref | Google Scholar |
Burgueño J, de los Campos G, Weigel K, Crossa J (2012) Genomic prediction of breeding values when modeling genotype × environment interaction using pedigree and dense molecular markers. Crop Science 52(2), 707-719.
| Crossref | Google Scholar |
Bustos-Korts D, Malosetti M, Chapman S, van Eeuwijk F (2016) Modelling of genotype by environment interaction and prediction of complex traits across multiple environments as a synthesis of crop growth modelling, genetics and statistics. In ‘Crop systems biology: narrowing the gaps between crop modelling and genetics’. (Eds X Yin, P Struik) pp. 55–82. (Springer)
Bustos-Korts D, Boer MP, Chenu K, Zheng B, Chapman S, van Eeuwijk FA (2021) Genotype-specific P-spline response surfaces assist interpretation of regional wheat adaptation to climate change. in silico Plants 3(2), diab018.
| Crossref | Google Scholar |
Campbell MT, Hu H, Yeats TH, Brzozowski LJ, Caffe-Treml M, Gutiérrez L, Smith KP, Sorrells ME, Gore MA, Jannink J-L (2021) Improving genomic prediction for seed quality traits in oat (Avena sativa L.) using trait-specific relationship matrices. Frontiers in Genetics 12, 643733.
| Crossref | Google Scholar | PubMed |
Crespo-Herrera LA, Crossa J, Huerta-Espino J, Mondal S, Velu G, Juliana P, et al. (2021) Target population of environments for wheat breeding in India: definition, prediction and genetic gains. Frontiers in Plant Science 12, 638520.
| Crossref | Google Scholar | PubMed |
Crossa J, Cornelius PL (1997) Sites regression and shifted multiplicative model clustering of cultivar trial sites under heterogeneity of error variances. Crop Science 37(2), 406-415.
| Crossref | Google Scholar |
Dawson JC, Endelman JB, Heslot N, Crossa J, Poland J, Dreisigacker S, Manès Y, Sorrells ME, Jannink J-L (2013) The use of unbalanced historical data for genomic selection in an international wheat breeding program. Field Crops Research 154, 12-22.
| Crossref | Google Scholar |
Dumble S, Bernal EF, Villardon PG (2017) GGEBiplots: GGE Biplots with ‘ggplot2.’ R Package Version 0.1, 1. Available at https://CRAN.R-project.org/package=GGEBiplots
Endelman JB, Atlin GN, Beyene Y, Semagn K, Zhang X, Sorrells ME, Jannink J-L (2014) Optimal design of preliminary yield trials with genome-wide markers. Crop Science 54(1), 48-59.
| Crossref | Google Scholar |
Gabriel KR (1971) The biplot graphic display of matrices with application to principal component analysis. Biometrika 58(3), 453-467.
| Crossref | Google Scholar |
Gauch HG, Jr., Zobel RW (1997) Identifying mega-environments and targeting genotypes. Crop Science 37(2), 311-326.
| Crossref | Google Scholar |
Gezan S (2020) Linear mixed models: obtaining estimates of random effects with ASReml-R. Asreml-r Blog. Available at https://vsni.co.uk/case-studies/calculating-accuracy-of-random-effect-estimates-with-ASReml-R
González-Barrios P, Díaz-García L, Gutiérrez L (2019) Mega-environmental design: using genotype × environment interaction to optimize resources for cultivar testing. Crop Science 59(5), 1899-1915.
| Crossref | Google Scholar |
Haikka H, Manninen O, Hautsalo J, Pietilä L, Jalli M, Veteläinen M (2020a) Genome-wide association study and genomic prediction for Fusarium graminearum resistance traits in nordic oat (Avena sativa L.). Agronomy 10(2), 174.
| Crossref | Google Scholar |
Haikka H, Knürr T, Manninen O, Pietilä L, Isolahti M, Teperi E, et al. (2020b) Genomic prediction of grain yield in commercial Finnish oat (Avena sativa) and barley (Hordeum vulgare) breeding programmes. Plant Breeding 139(3), 550-561.
| Crossref | Google Scholar |
Haile TA, Heidecker T, Wright D, Neupane S, Ramsay L, Vandenberg A, Bett KE (2020) Genomic selection for lentil breeding: empirical evidence. The Plant Genome 13(1), e20002.
| Crossref | Google Scholar | PubMed |
Hartung J, Piepho H-P (2021) Effect of missing values in multi-environmental trials on variance component estimates. Crop Science 61(6), 4087-4097.
| Crossref | Google Scholar |
Heffner EL, Sorrells ME, Jannink J-L (2009) Genomic selection for crop improvement. Crop Science 49(1), 1-12.
| Crossref | Google Scholar |
Heslot N, Rutkoski J, Poland J, Jannink J-L, Sorrells ME (2013) Impact of marker ascertainment bias on genomic selection accuracy and estimates of genetic diversity. PLoS ONE 8(9), e74612.
| Crossref | Google Scholar | PubMed |
Hoefler R, Gonzalez-Barrios P, Bhatta M, Berro I, Nalin RS, Borges A, Covarrubias E, Diaz- Garcia L, Gutierrez L (2020) Do spatial designs outperform classic experimental designs? Journal of Agricultural, Biological and Environmental Statistics 25, 523-552.
| Crossref | Google Scholar |
Hu H, Campbell MT, Yeats TH, et al. (2021) Multi-omics prediction of oat agronomic and seed nutritional traits across environments and in distantly related populations. Theoretical and Applied Genetics 134, 4043-4054.
| Crossref | Google Scholar |
Jarquín D, Crossa J, Lacaze X, Du Cheyron P, Daucourt J, Lorgeou J, Piraux F, Guerreiro L, Pérez P, Calus M, Burgueño J, de los Campos G (2014) A reaction norm model for genomic selection using high-dimensional genomic and environmental data. Theoretical and Applied Genetics 127, 595-607.
| Crossref | Google Scholar | PubMed |
Jarquín D, Lemes da Silva C, Gaynor RC, Poland J, Fritz A, Howard R, Battenfield S, Crossa J (2017) Increasing genomic-enabled prediction accuracy by modeling genotype × environment interactions in Kansas wheat. The Plant Genome 10(2), plantgenome2016.12.0130.
| Crossref | Google Scholar |
Lado B, Barrios PG, Quincke M, Silva P, Gutiérrez L (2016) Modeling genotype × environment interaction for genomic selection with unbalanced data from a wheat breeding program. Crop Science 56(5), 2165-2179.
| Crossref | Google Scholar |
Lado B, Vázquez D, Quincke M, Silva P, Aguilar I, Gutiérrez L (2018) Resource allocation optimization with multi-trait genomic prediction for bread wheat (Triticum aestivum L.) baking quality. Theoretical and Applied Genetics 131, 2719-2731.
| Crossref | Google Scholar | PubMed |
Malosetti M, Voltas J, Romagosa I, Ullrich SE, Van Eeuwijk FA (2004) Mixed models including environmental covariables for studying QTL by environment interaction. Euphytica 137, 139-145.
| Crossref | Google Scholar |
Malosetti M, Bustos-Korts D, Boer MP, van Eeuwijk FA (2016) Predicting responses in multiple environments: issues in relation to genotype × environment interactions. Crop Science 56(5), 2210-2222.
| Crossref | Google Scholar |
Mathews KL, Malosetti M, Chapman S, McIntyre L, Reynolds M, Shorter R, Van Eeuwijk F (2008) Multi-environment QTL mixed models for drought stress adaptation in wheat. Theoretical and Applied Genetics 117, 1077-1091.
| Crossref | Google Scholar | PubMed |
Meuwissen THE, Hayes BJ, Goddard ME (2001) Prediction of total genetic value using genome-wide dense marker maps. Genetics 157(4), 1819-1829.
| Crossref | Google Scholar | PubMed |
Monteverde E, Rosas JE, Blanco P, Pérez de Vida F, Bonnecarrère V, Quero G, Gutierrez L, McCouch S (2018) Multienvironment models increase prediction accuracy of complex traits in advanced breeding lines of rice. Crop Science 58(4), 1519-1530.
| Crossref | Google Scholar |
Monteverde E, Gutierrez L, Blanco P, Pérez de Vida F, Rosas JE, Bonnecarrère V, Quero G, McCouch S (2019) Integrating molecular markers and environmental covariates to interpret genotype by environment interaction in rice (Oryza sativa L.) grown in subtropical areas. G3 Genes|Genomes|Genetics 9(5), 1519-1531.
| Crossref | Google Scholar |
Neyhart JL, Silverstein KAT, Smith KP (2022) Accurate predictions of barley phenotypes using genomewide markers and environmental covariates. Crop Science 62(5), 1821-1833.
| Crossref | Google Scholar |
Oakey H, Cullis B, Thompson R, Comadran J, Halpin C, Waugh R (2016) Genomic selection in multi-environment crop trials. G3: Genes, Genomes, Genetics 6(5), 1313-1326.
| Google Scholar |
Piepho H-P (1998) Empirical best linear unbiased prediction in cultivar trials using factor-analytic variance-covariance structures. Theoretical and Applied Genetics 97(1–2), 195-201.
| Crossref | Google Scholar |
Piepho H-P (2000) A mixed-model approach to mapping quantitative trait loci in barley on the basis of multiple environment data. Genetics 156(4), 2043-2050.
| Crossref | Google Scholar | PubMed |
Piepho HP, Möhring J, Melchinger AE, Büchse A (2008) BLUP for phenotypic selection in plant breeding and variety testing. Euphytica 161(1–2), 209-228.
| Crossref | Google Scholar |
Piepho H-P, Möhring J, Schulz-Streeck T, Ogutu JO (2012) A stage-wise approach for the analysis of multi-environment trials. Biometrical Journal 54(6), 844-860.
| Crossref | Google Scholar | PubMed |
Rebollo I, Aguilar I, Pérez de Vida F, Molina F, Gutiérrez L, Rosas JE (2023) Genotype by environment interaction characterization and its modeling with random regression to climatic variables in two rice breeding populations. Crop Science 63(4), 2220-2240.
| Crossref | Google Scholar |
Smith A, Cullis B, Thompson R (2001) Analyzing variety by environment data using multiplicative mixed models and adjustments for spatial field trend. Biometrics 57(4), 1138-1147.
| Crossref | Google Scholar | PubMed |
van Eeuwijk FA, Malosetti M, Yin X, Struik PC, Stam P (2005) Statistical models for genotype by environment data: from conventional ANOVA models to eco-physiological QTL models. Australian Journal of Agricultural Research 56(9), 883-894.
| Crossref | Google Scholar |
van Eeuwijk FA, Bustos-Korts DV, Malosetti M (2016) What should students in plant breeding know about the statistical aspects of genotype × environment interactions? Crop Science 56(5), 2119-2140.
| Crossref | Google Scholar |
VanRaden PM (2008) Efficient methods to compute genomic predictions. Journal of Dairy Science 91(11), 4414-4423.
| Crossref | Google Scholar | PubMed |
Vargas M, Crossa J, van Eeuwijk FA, Ramírez ME, Sayre K (1999) Using partial least squares regression, factorial regression, and AMMI models for interpreting genotype × environment interaction. Crop Science 39(4), 955-967.
| Crossref | Google Scholar |
Verbyla AP, Eckermann PJ, Thompson R, Cullis BR (2003) The analysis of quantitative trait loci in multi-environment trials using a multiplicative mixed model. Australian Journal of Agricultural Research 54(12), 1395-1408.
| Crossref | Google Scholar |
Wang T-C, Casadebaig P, Chen T-W (2023) More than 1000 genotypes are required to derive robust relationships between yield, yield stability and physiological parameters: a computational study on wheat crop. Theoretical and Applied Genetics 136(3), 34.
| Crossref | Google Scholar | PubMed |
Ward BP, Brown-Guedira G, Kolb FL, Van Sanford DA, Tyagi P, Sneller CH, Griffey CA (2019) Genome-wide association studies for yield-related traits in soft red winter wheat grown in Virginia. PLoS ONE 14(2), e0208217.
| Crossref | Google Scholar | PubMed |
Yan W (2015) Mega-environment analysis and test location evaluation based on unbalanced multiyear data. Crop Science 55(1), 113-122.
| Crossref | Google Scholar |
Yan W, Tinker NA (2006) Biplot analysis of multi-environment trial data: principles and applications. Canadian Journal of Plant Science 86(3), 623-645.
| Crossref | Google Scholar |
Yan W, Hunt LA, Sheng Q, Szlavnics Z (2000) Cultivar evaluation and mega-environment investigation based on the GGE biplot. Crop Science 40(3), 597-605.
| Crossref | Google Scholar |
Yan W, Kang MS, Ma B, Woods S, Cornelius PL (2007) GGE biplot vs. AMMI analysis of genotype-by-environment data. Crop Science 47(2), 643-653.
| Crossref | Google Scholar |