

Extinction debt varies in two threatened Mediterranean-type woodland communities undergoing rapid urbanisation
William M. Fowler A B * , Rachel J. Standish B , Neal J. Enright B and Joseph B. Fontaine B
A Parks and Wildlife Service, Department of Biodiversity, Conservation and Attractions, PO Box 1266, Mandurah, WA 6210, Australia.
B Environmental and Conservation Sciences, Murdoch University, 90 South Street, Murdoch, WA 6150, Australia.
Australian Journal of Botany - https://doi.org/10.1071/BT22134
Submitted: 4 December 2022 Accepted: 29 June 2023 Published online: 25 July 2023
© 2023 The Author(s) (or their employer(s)). Published by CSIRO Publishing. This is an open access article distributed under the Creative Commons Attribution-NonCommercial-NoDerivatives 4.0 International License (CC BY-NC-ND)
Abstract
Context: Extinction debt, the time-delayed species loss response to fragmentation associated with habitat clearance, is a conservation concern for management of biological diversity globally. Extinction debt is well defined but difficult to measure owing to the long-term data needed to measure species loss, particularly for communities of long-lived species.
Aims: We aimed to estimate extinction debt for two adjacent threatened communities with contrasting soil fertility in south-western Australia: banksia and tuart woodlands. Further, we assessed what species functional traits are associated with extinction risk.
Methods: Using contemporary (2016) and historical (1992) data on vegetation richness, and patch characteristics dating back to the time of European colonisation (1829), we examined 60 woodland patches using three methods to detect and quantify extinction debt.
Key results: We found evidence of extinction debt in banksia woodland, but not in tuart woodland. We estimated the extinction debt for banksia woodlands as a future average loss of 28% or ~13 species per patch.
Conclusions: Our study demonstrated a delay of species loss consistent with extinction debt in one of two vegetation communities. Despite sharing species and traits, these vegetation communities have responded differently to landscape change over the same timescale and within the same landscape.
Implications: Understanding how vegetation communities, and functional trait types, respond to time-delayed impacts helps land managers to prioritise intervention efforts to pre-empt species decline and extinction through species conservation, and ecological restoration of remnant vegetation patches.
Keywords: banksia woodland, extinction debt, habitat fragmentation, habitat loss, mediterranean, plant traits, species–area relationship, tuart woodland, urbanisation.
Introduction
Earth’s species are in the midst of the greatest recent documented global extinction event (IPBES 2019). Consequences of extinction extend far beyond species loss, impacting ecosystem function and services, with flow-on effects for human societies, including viability and well-being (IPBES 2019). Biodiversity decline is generally attributed to habitat loss, climate change and competition from invasive species (Thomas et al. 2004; Ewers and Didham 2006; Sax and Gaines 2008). However, in most instances species losses occur gradually in response to these impacts, and these inherent time lags mean that losses are under-estimated, until local or complete extinction of species occurs.
Habitat loss and subsequent fragmentation often occur faster than the demographic processes which drive the population dynamics of many species. Demographic processes (e.g. individual longevity and presence of persistent seed banks) determine the continued persistence of species, with loss of species proceeding over a prolonged period via slow demographic decline. The mismatch between timescales of habitat loss and species’ responses can mask the full impacts of habitat loss and fragmentation until decades or centuries later. This lag time has been termed ‘extinction debt’ (Tilman et al. 1994) and is defined as the lag time between habitat fragmentation and the loss of species where a viable population is no longer able to persist in a patch of a given size (Tilman et al. 1994; Hanski and Ovaskainen 2002). For example, populations of long-lived species may persist in a patch for 100s of years, but if there is limited or no recruitment of new individuals, the population will eventually become extinct. Thus, remnant fragments in a recently cleared (i.e. decades to a century) landscape are more likely to be carrying a high extinction debt (Hanski and Ovaskainen 2002), particularly for plant or animal communities characterised by long-lived species. Testing for extinction debt, and increasing understanding of the processes leading to extinction, offers an opportunity to anticipate future extinctions and act to prevent their occurrence.
Land use transformation of wildlands to mixed agricultural, rural, and urban landscapes generates a patchwork of native remnant vegetation and is the major contributor to extinction debt. Remnant patches are often of high conservation value (Ives et al. 2016; Kendal et al. 2017). It is generally accepted that many ecological processes are altered as a result of fragmentation, however, the long-term effects of these impacts are, for the most part, unclear (Hobbs and Yates 2003; Haddad et al. 2015). Altered disturbance regimes and climate change may also act in combination to degrade a patch (e.g. fire, trampling, grazing). But how they contribute to extinction debt remains uncertain.
Urbanisation is overtaking other forms of land use as the primary cause of fragmentation globally, with the potential for species extinctions from urban development a growing concern worldwide (Hahs et al. 2009). Cities in biodiversity hotspots support disproportionate numbers of species, many of which are threatened (Ives et al. 2016). Through the 21st century, cities will continue to expand, increasing from 55% of global population to a projected 68% by 2050, an increase of 2.5 billion people (United Nations 2018). The path to urbanisation is highly dynamic, involving land use change and fragmentation; contemporary landscapes that may appear similar in their current state may have had different pathways (e.g. when, where and how much vegetation was cleared over time) to reach this state (Ramalho and Hobbs 2012). As such, vegetation structure and composition are potentially influenced by these differing histories, leading to different possible species loss trajectories; for example, a fragment urbanised from an agricultural landscape may respond differently to a patch urbanised from a landscape of native vegetation. Despite the potential impact on biodiversity, there are few studies that have measured extinction debt in urbanised fragments (du Toit et al. 2016; Figueiredo et al. 2019).
Measuring extinction debt is an attractive proposition, as being able to predict future species losses is a powerful tool for prioritising management and allocation of scarce conservation resources (Wearn et al. 2012). However, extinction debts are difficult to quantify due to the long timescales involved, and the inherent complexity of ecological systems (e.g. different species, or regions respond differently to impacts, due to differences in biogeography, ecology, history etc.) (Hobbs and Yates 2003). There are three common approaches to evaluating extinction debt (Kuussaari et al. 2009). The most common method uses contemporary species richness and historical and contemporary patch characteristics, usually patch area. A stronger correlation with historical landscape metrics than contemporary landscape metrics indicates the presence of an extinction debt (e.g. historical, not contemporary, patch area is a stronger predictor of species richness). A second method categorises habitat patches into stable and regressive patches based on the percentage area lost. Species area relationships are built for stable patches which are then used to predict species richness for regressive patches, the difference between predicted and observed being the extinction debt. A third method uses two or more timepoints of richness and landscape data to calculate historical and contemporary species area relationships, the difference between these then serves as an estimate of the magnitude of the extinction debt.
Given the considerable variation in plant species and their traits, it is plausible that the presence or absence of an extinction debt may be consistent with particular plant traits. For example, long-lived perennial woody species may be more likely to have large extinction debt compared with annual or short-lived species. Consistent with this assumption, Krauss et al. (2010) documented a large extinction debt for vascular plants, but not for butterflies. Species traits are fundamentally related to species level turnover rates – annual (high) vs perennial (low), resprouter (lower) vs non-resprouter (higher). As stated in Kuussaari et al. (2009) delayed extinctions are more likely to occur in species with lower compared to higher turnover rates.
Here, we measure extinction debt associated with urbanisation and growth of the city of Perth, Western Australia. Perth is a relatively young city (European colonisation in 1829) and has rapidly urbanised, with its current population of 2 million having more than doubled in the last 30 years (Ritchie et al. 2021). It is located in a highly biodiverse Mediterranean ecosystem type (MTE) region, with MTEs characterised by one of the highest extinction rates of plants globally (Myers et al. 2000; Humphreys et al. 2019). Most of the urban expansion has occurred through the clearing of native woodland vegetation of two types (banksia woodland and tuart woodland). In such a young city, and where long-lived woody species with low dispersal distances dominate (Hopper and Gioia 2004), the consequences of fragmentation on plant communities may not yet be fully realised; that is, there may be a large extinction debt.
By comparing an historical dataset with contemporary data, this study aimed to estimate extinction debt for the MTE woodlands of the Perth region using three methods based on historical and contemporary species richness and patch characteristics (i.e. patch size, patch size change, vegetation type), and to assess what traits may place species at greatest risk of extinction. We predict that traits that are indicative of a shorter lifespan (e.g. annual, non-resprouting perennial, herbaceous perennial) are associated with species at greater risk (Morris et al. 2008). We used three methods because using a range of methods enabled a greater chance of detecting extinction debt if it were present (Kuussaari et al. 2009), and consistency of findings among methods gave confidence in interpretation.
Methods
Study system
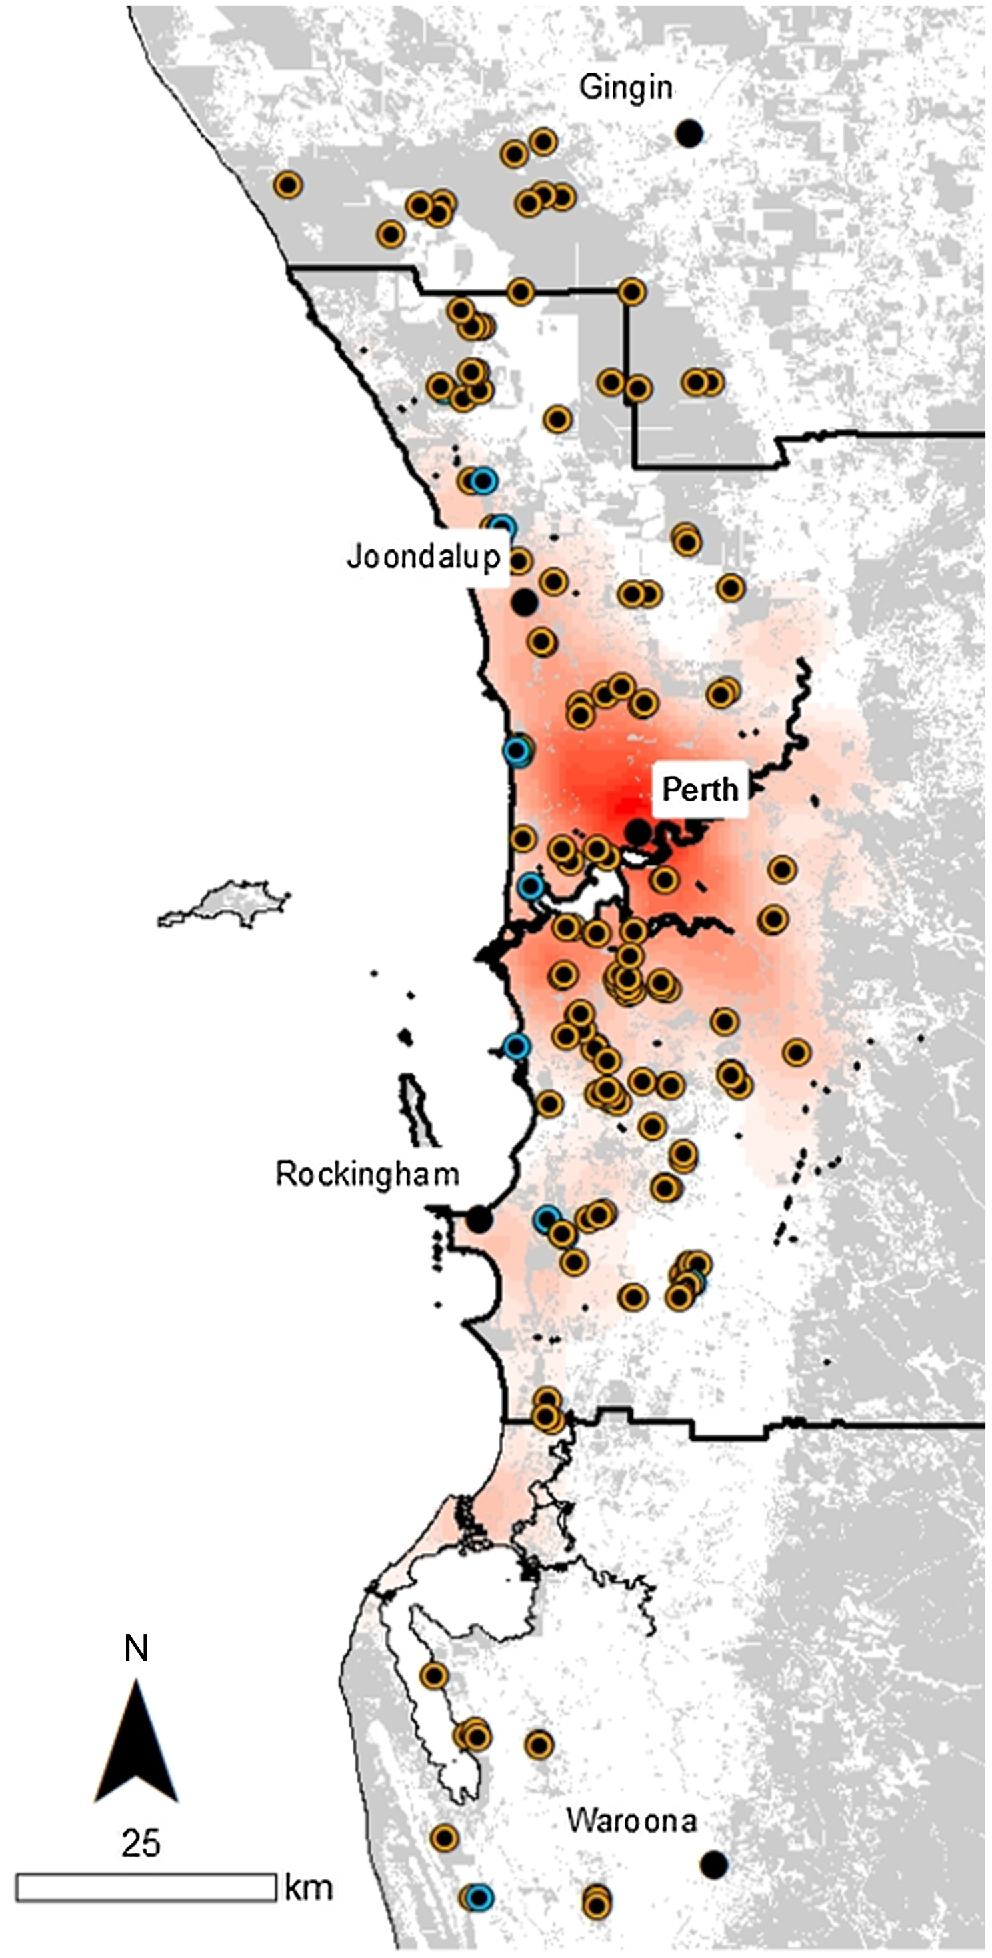
The study system includes banksia woodlands (with tree layer dominants Banksia attenuata and Banksia menziesii) and tuart (Eucalyptus gomphocephala) woodlands of the Swan Coastal Plain, south-west Western Australia. The study area stretches over 250 km from Gingin (latitude −31.35°, longitude 115.90°) in the north to Waroona in the south (−32.85°, 115.92°). The city of Perth (−31.95°, 115.86°) and its suburbs have been expanding in the middle portion, which is now largely urbanised, whereas to the north and south of the city, mixed land uses (e.g. market gardens, small farms) and native woodlands dominate (Fig. 1). The region has a Mediterranean-type climate with hot, dry summers and warm wet winters. The long-term average rainfall for Perth is 845 mm (1876–2016), which has declined by approximately 20% since the 1970s (884 mm 1876–1970, 716 mm 1971–2016) (Bureau of Meteorology 2022).
Locations of the 160 vegetation sample plots on the Swan Coastal plain around Perth, Western Australia; from Gingin in the north to Waroona in the south. Orange points indicate banksia woodland plots, and blue points indicate tuart woodland (some points obscured by other points). Grey areas indicate extant native vegetation, the solid black line indicates the greater Perth metropolitan area, and shades of red indicate human population densities (base data from data.wa.gov.au).
The greater Perth region has several of the pre-requisites required to measure extinction debt successfully. Spatially accurate vegetation data exists, extending back to first European colonisation in 1829. The two major native plant communities (banksia and tuart woodlands) differ in ways that likely influence the impact of urbanisation and subsequent responses including their substrate type, geographic extent and species and functional trait composition. Banksia woodlands have been more heavily impacted by urbanisation because their distribution was continuous and is currently fragmented, whereas tuart woodland distribution was inherently fragmented due to their strong association with disjunct patches of near-coastal calcareous soils (Hopkins et al. 1996; Commonwealth of Australia 2019) with urbanisation exacerbating this fragmentation. Given the younger soils on which tuart woodland occurs, and their higher nitrogen and phosphorus levels, this also lends itself to a dominance of shorter-lived species in the understory (Avolio et al. 2014), and thus potentially lower extinction debt (i.e. faster overall species responses to change). A comprehensive network of 125 permanent plots was established across the Perth metropolitan region in 1991–1993 (Gibson et al. 1994). The data on which this study is based includes data on plant species composition and richness collected when the plots were established, and contemporary data for the 125 original plots, plus 35 additional plots, measured in 2015–2018 (Fig. 1).
Background
European colonisation of Western Australia and establishment of the Swan River Colony (now Perth) in 1829 marked a notable change in the land use to that of the Noongar peoples who have occupied the region for at least 48 000 years (Turney et al. 2001). Landscape change happened in several distinct phases following European colonisation, from initial low intensity agricultural practices (~1830–1890), to broadscale farm-based crop and livestock production from the 1890s, which led to habitat fragmentation (Richards 1993). Urban expansion then proceeded more rapidly, with clearing of banksia woodland occurring at rates of approximately 12% per decade in the Greater Perth Metropolitan Area since the 1960s (Commonwealth of Australia 2016). In more recent decades, much of the cleared farmland in closer proximity to Perth has been converted to urban areas. With this urbanisation, there has been an increase of threats to remnant woodland patches, such as from weeds, disturbance, and disease.
Botanists have collected and described the plant species of south-west Western Australia since the late 1600s (Gibson 2014), yet vegetation communities were not described until the early 1900s (Diels 1906; Beard 2001) and not mapped in detail until the late 1970s (Beard 1979). A formal, comprehensive vegetation survey of the Swan Coastal Plain was conducted in the early 1990s (Gibson et al. 1994). It covered the southern Swan Coastal Plain (Gingin to Busselton) with species data from 509 100 m2 plots used to classify floristic communities of the region.
Historical data
We used a subset of the Gibson et al. (1994) data as the comparative historical dataset for this study. Plots (100 m2) in that study were established in 1991–1993 in remnant vegetation areas (hereafter permanent plots). Lists of all vascular plant species were compiled for each of the plots in early or late spring over consecutive years with most species vouchered in the state herbarium. All sites were marked with steel fence dropper posts and their GPS location recorded.
Contemporary data
Permanent plots (N = 125, from Gibson et al. 1994) were re-surveyed in spring 2015–2018. These 125 plots were distributed among 38 woodland patches (1–31 plots per patch) (Fig. 1). At some locations permanent plot markers were no longer present, and for these we followed the recommendation of Kapfer et al. (2017): using only those plots with adequate information to identify an approximate location (i.e. ~±10 m) in subsequent analyses. Approximated plot locations have been shown to provide similar results to exact remeasurements for showing changes over time (Kopecký and Macek 2015). Additional plots and those without sufficient relocation information (n = 35) were classed as new plots without historical information. These re-established plots were included to cover a broader range of patch sizes, for analyses where historical data was not utilised. Thus, there were 125 plots with relocation and 160 plots surveyed in total. Due to differences in flowering phenology, which influences probability of detection and identification (especially for annuals and geophytes), plots were assessed twice where possible (107 of 160), once in early spring and once in late spring.
Landscape data
ArcGIS 10.6 (ESRI 2018) was used to calculate the metrics of urbanisation and fragmentation in this study (Table 1), with much of the base data available from data.wa.gov.au, or otherwise generated by the authors. Landsat imagery was extracted using Google Earth Engine (Gorelick et al. 2017) for 1979 (Landsat 3, 60 m resolution), 1992 (Landsat 5, 30 m resolution) and 2016 (Landsat 8, 30 m resolution), 1979 being the oldest imagery available for patch size determination, with 1992 and 2016 being the mid-points of the historical and contemporary vegetation surveys, respectively. For this study we considered habitat fragmentation was by habitat clearing and included clearing for main roads due to their ecological impermeability. Fragments were processed via image reclassification in ArcGIS 10.6 to identify vegetation patches. Fragments were defined with a minimum gap of 20 m (any substrate) or separated by major roads (coinciding with the Landsat time point, as defined by the Western Australian Department of Main Roads), from which patch size was quantified. To determine pre-European landscape, historical habitat patches (within an assumed continuous vegetated landscape), were used to calculate patch size. Patches were further refined through removal of wetland-derived soil types that support wetland vegetation communities rather than banksia or tuart woodland.
| Exotic | Native | |||||||
|---|---|---|---|---|---|---|---|---|
| Total | Annual | Perennial | Woody | Non-woody | Resprouter | Non-resprouter | ||
| SL | LL | LL | SL | LL | SL | |||
| Tuart woodland | 58 | 136 | 20 | 115 | 49 | 82 | 79 | 56 |
| Banksia woodland | 86 | 420 | 39 | 374 | 166 | 238 | 246 | 159 |
Note: some traits could not be determined for all species, and therefore pairings may not sum to total.
SL, trait conferring shorter lifespan, LL, trait conferring longer lifespan.
Data analysis
We used three independent approaches to test for extinction debt. First, we used contemporary species richness data to test the relationship of species richness to remnant area (log10 richness and area) at different time points: 2016, 1992, 1979, and pre-European. This approach yielded an estimation of extinction debt by comparing the strength of the relationship between years, with a stronger relationship to historical area indicating evidence of an extinction debt (following Adriaens et al. (2006); hereafter Method 1). Second, we categorised the 58 banksia woodland patches by area lost, based on proportion of vegetation cover reduction between the historical and contemporary surveys. Stable and regressive vegetation patches were defined as less than 40% loss and greater than 40% loss from pre-European extent respectively (n = 9 stable and 49 regressive patches). Using all 146 banksia woodland plots, species–area relationships were created for the nine stable patches and used to predict species richness for 49 regressive patches, thus creating a quantitative estimate of extinction debt from the difference between predicted and observed by reversing the log transformation of predictions and subtracting predicted from observed richness (following Helm et al. (2006); hereafter Method 2). Third, we used historical and contemporary data on both patch area and species richness (following Cowlishaw (1999); hereafter Method 3). We calculated the species area relationship between historical habitat area and historical richness and used this relationship to calculate the predicted number of species for the contemporary area with the difference between predicted and contemporary species richness used as the extinction debt estimate.
Expanding on Method 1, the influence of plant traits on extinction debt was assessed by allocating species to binary trait groups for longevity (annual, perennial), woodiness (yes, no), and resprouting ability (yes, no), each of which provide proxies for lifespan. The number of species representing each trait group was used to generate trait−area relationships for each landscape year (pre-European, 1979, 1992 and 2016). We could not allocate taxa identified to genus level or above to all trait groups with certainty, where unallocated these were removed from the analysis (longevity n = 7, woodiness n = 16, resprouting ability n = 15). Extinction debts calculated from all three methods were assessed for significance using generalised linear mixed models (GLMM, package lme4, Bates et al. 2015, in R ver. 3.5.2, R Core Team 2020). Patch identity was represented as a random factor, and the results were visualised using ggplot2 (Wickham 2016). We used an alpha level of 0.05 and 95% confidence intervals not overlapping zero as evidence of an effect.
Results
We recorded a total of 733 vascular plant species (see Table 1 for species – trait summary) across 160 plots at 60 patches and two time periods (125 Gibson et al. (1994) plots and 35 new to this study). These plots encompass two threatened ecological communities: tuart woodland (14 plots) and banksia woodland (146 plots). In the 125 remeasured plots we found a species turnover of 49% in banksia woodlands vs 63% in tuart woodlands (stable species banksia woodland = 51% and tuart woodland = 36%). The 60 patches in 2016 correspond to 45 in 1992, and 29 in 1979. The total number of vegetation patches within the study area increased from 7739 in 1979 to 8791 in 1992, and 9267 in 2016. Extant vegetation represents 14% of pre-European vegetation, the result of clearing for agriculture and urbanisation.
Method 1: contemporary native richness and patch area
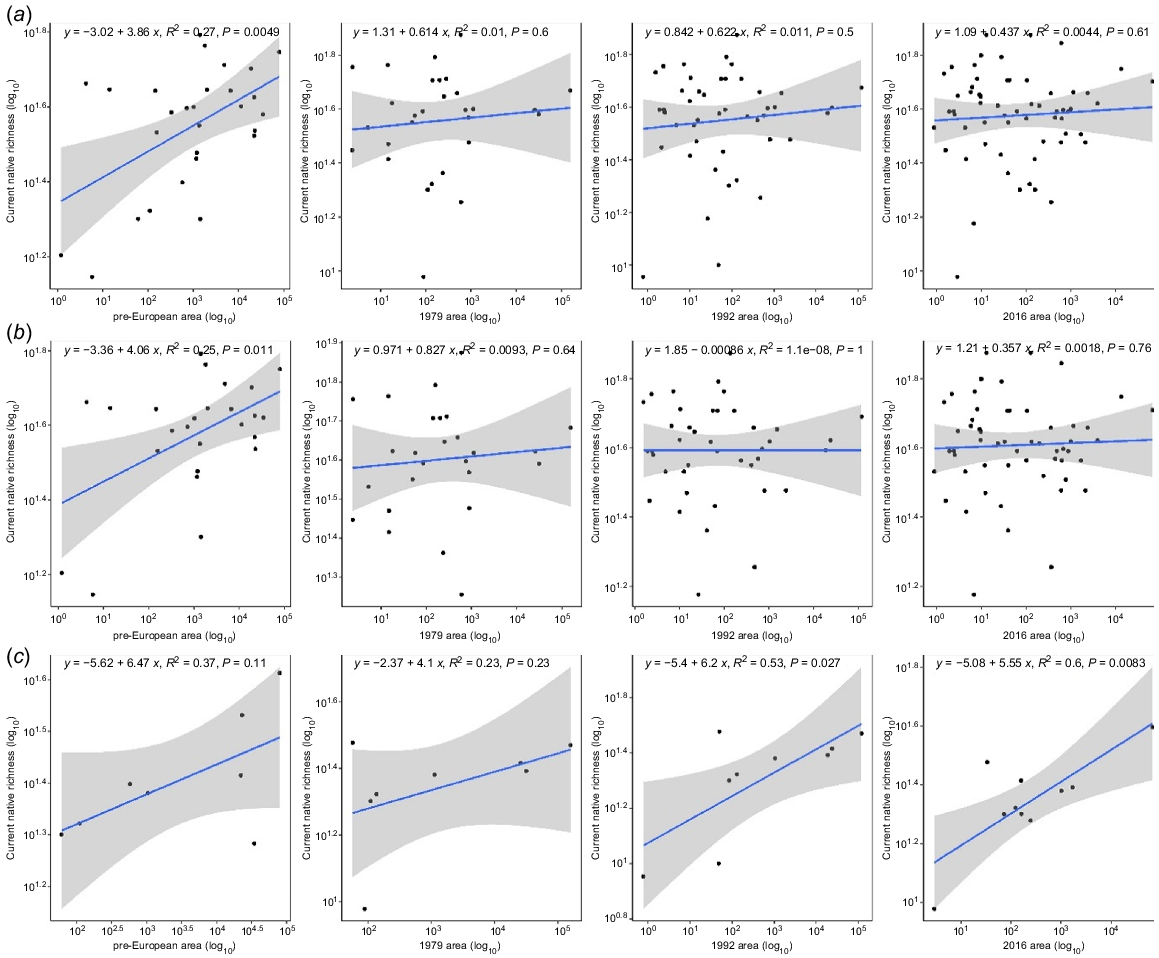
Results of regressions of log native richness and log areas through time (Fig. 2) and subsequent linear models showed differing trends by woodland type (Table 2). Combined data (banksia and tuart woodland combined) had a significant relationship between contemporary native richness and historical patch sizes only (2016: R2 = 0.0044 (P = 0.61), pre-European: R2 = 0.27 (P = 0.0049)). When data are split by vegetation type, banksia woodland showed a stronger relationship to pre-European area (2016: R2 = 0.0018 (P = 0.76), pre-European: R2 = 0.25 (P = 0.011), However, tuart woodland showed a stronger relationship to contemporary area (2016: R2 = 0.60 (P = 0.0083), pre-European: R2 = 0.37 (P = 0.11)). This suggests that banksia woodlands have likely incurred an extinction debt, whereas tuart woodlands showed no evidence of extinction debt with this method.
Species area–richness (log–log regression ± 95% confidence envelope) relationships across four time periods (2016, 1992, 1979, and pre-European for (a) all plots (n = 160), (b) banksia woodland plots only (n = 146), and (c) tuart woodland plots only (n = 14). The species–area relationship was strongest for pre-European in banksia woodland and in 2016 for tuart woodland.
| Overall | Banksia woodland | Tuart woodland | |||||||
|---|---|---|---|---|---|---|---|---|---|
| Estimate (s.e.) | t | P | Estimate (s.e.) | t | P | Estimate (s.e.) | t | P | |
| PE | 0.056 (0.020) | 2.84 | 0.01 | 0.051 (0.019) | 2.65 | 0.017 | 0.019 (0.052) | 0.37 | 0.72 |
| 1979 | 0.017 (0.028) | 0.59 | 0.57 | 0.0095 (0.018) | 0.53 | 0.61 | 0.060 (0.041) | 1.5 | 0.21 |
| 1992 | 0.014 (0.022) | 0.65 | 0.52 | 0.0011 (0.017) | 0.064 | 0.95 | 0.054 (0.029) | 1.9 | 0.094 |
| 2016 | 0.012 (0.019) | 0.62 | 0.54 | 0.0052 (0.015) | 0.34 | 0.74 | 0.12 (0.028) | 4.2 | 0.013 |
Significant estimates (P < 0.05) are in bold.
Method 2: testing for extinction debt using stable and regressive species groups and landscapes
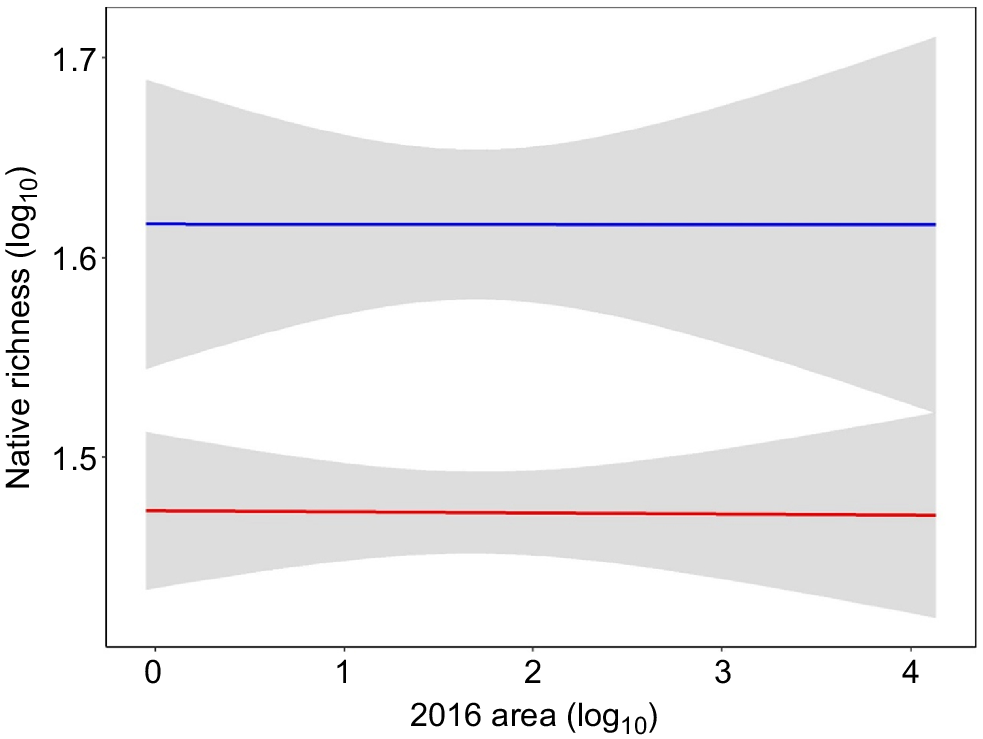
We used all 146 banksia woodland plots (58 fragments), equating to 49 regressive (>40% area loss, range = 49.8–99.9%, mean = 96.8%) and nine stable (<40% loss; range = 0–39.3, mean = 8.6%) banksia woodland patches for analysis. The stable banksia woodland species–area relationship, for which predictions were based, had an R2 of 0.23. The predicted extinction debt for regressive patches of banksia woodland was an average loss of 13 species per patch (range: +11 species to –45 species), corresponding to 28% of the average native richness recorded in the stable 100 m2 banksia woodland plot network (Fig. 3). This result of an average of 28% of the native species richness indicates that the community has been impacted by an extinction debt of this magnitude in fragments that have lost greater than 40% patch size and will likely suffer localised extinction of species in the future. Tuart woodland was excluded from assessment using this method due to the low number of patches (see Method 1).
Log10 observed (blue) and log10 predicted richness (red) with 95% confidence envelopes for banksia woodland for 49 regressive patches with >40% loss in patch size. Predicted richness is modelled from the species–area relationship of nine stable patches (<40% loss). Difference between the red and blue line indicates the predicted species loss/gain.
Method 3: historical and contemporary data – species area comparison
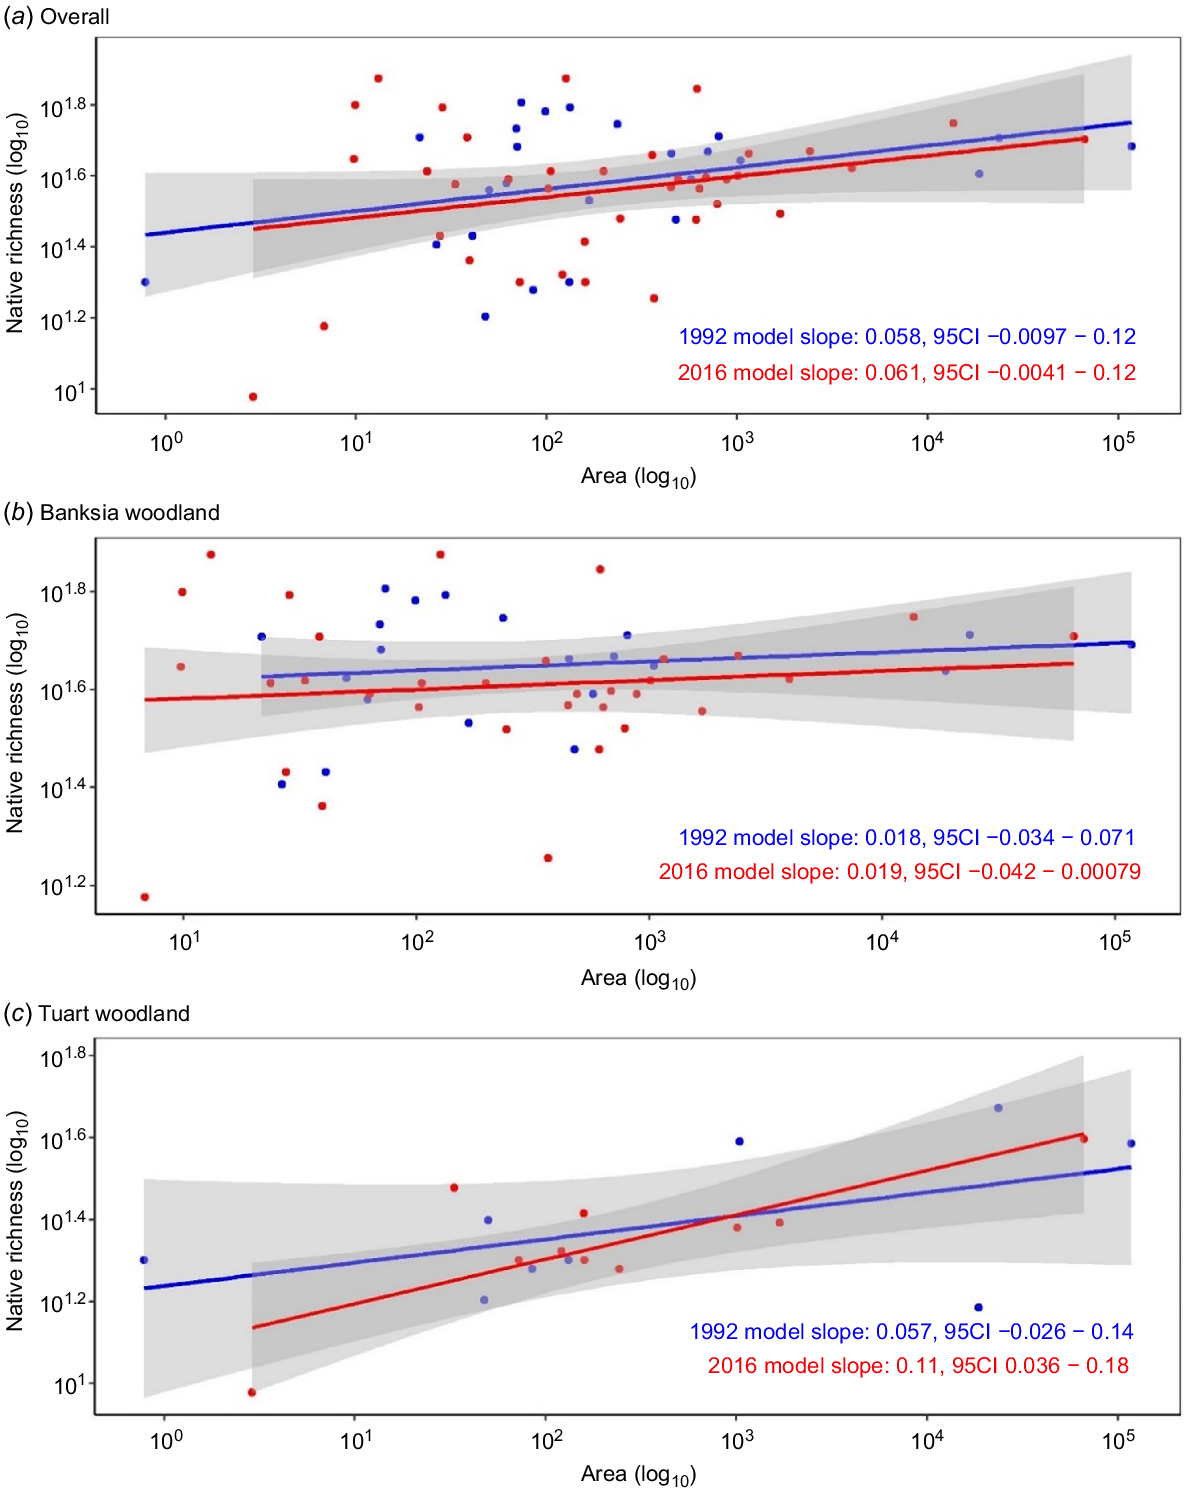
Historical and contemporary species–area relationships did not differ significantly by time period when pooled across vegetation types (Fig. 4a). When analysed by vegetation type, the same was true for banksia woodland (Fig. 4b) and tuart woodland (Fig. 4c). Given no effect of time period on species–area relationships, this method could not be used to estimate extinction debt.
Influence of traits on extinction debt
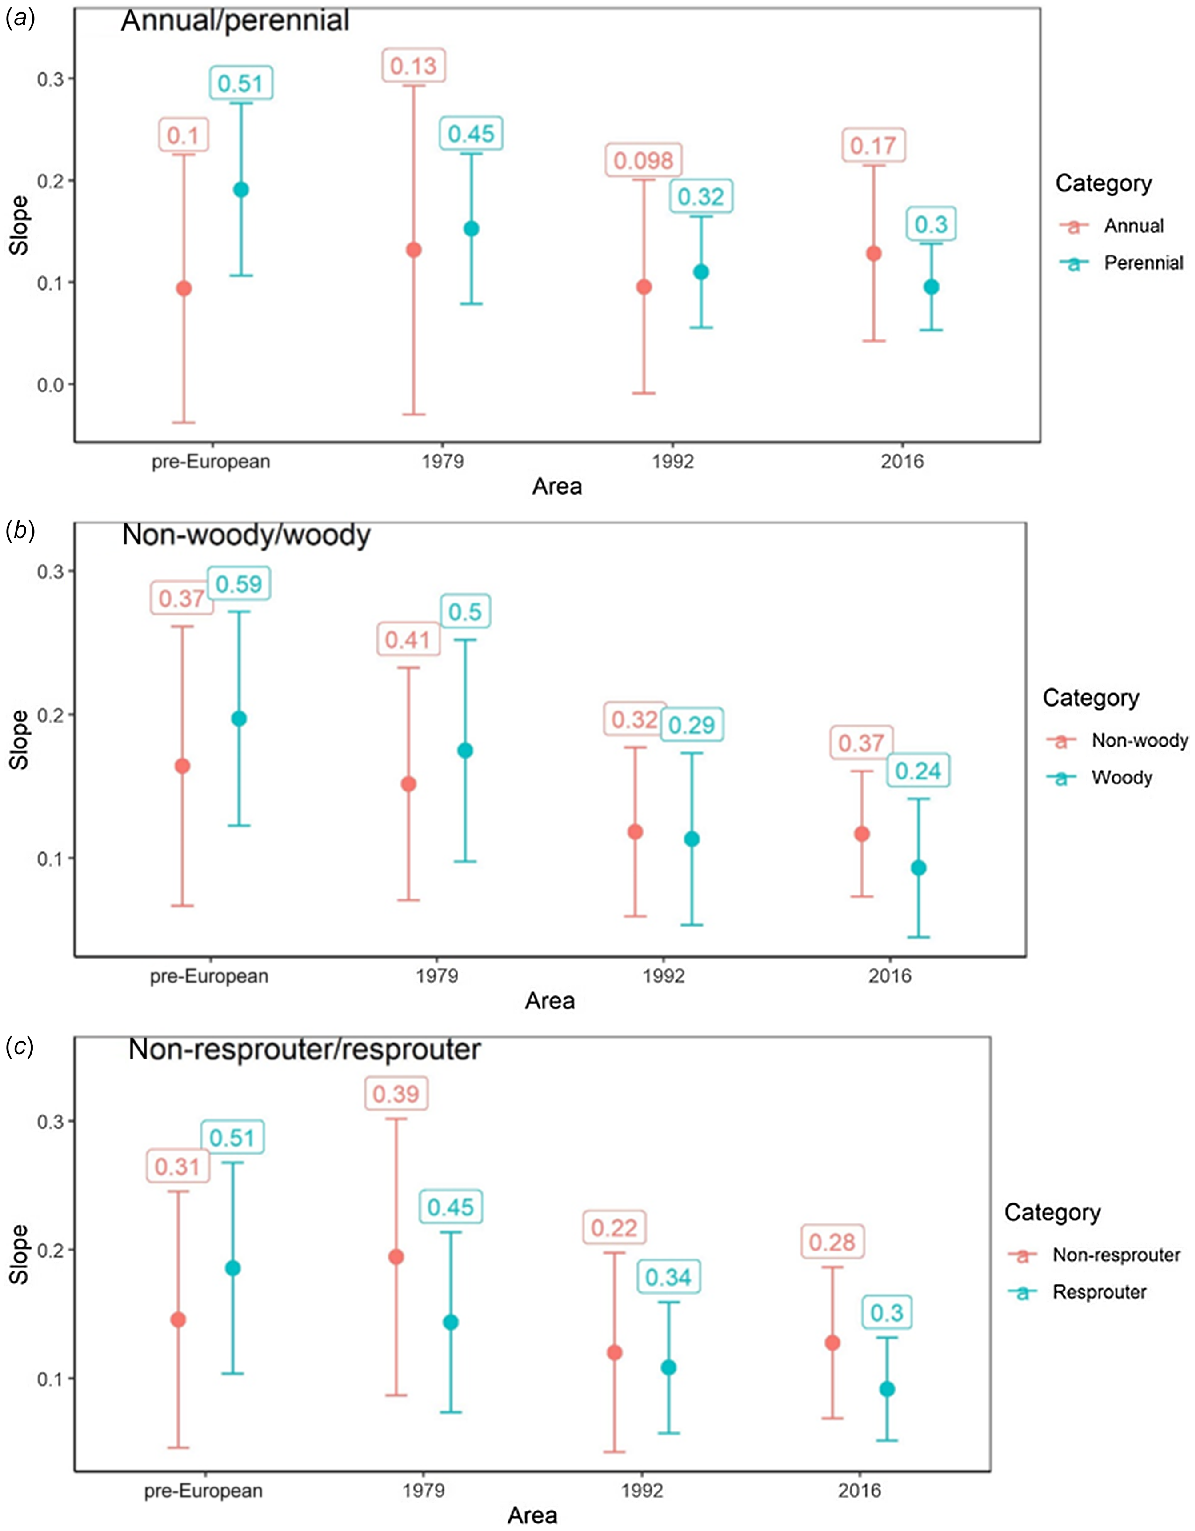
Plant traits relating to lifespan, including longevity (annual/perennial), woodiness (woody/non-woody), and resprouting ability (resprouter/non-resprouter) showed no significant difference within time period in relationship strength, or slope estimate (rate of accumulation) for linear models (Fig. 5). However, all traits associated with greater longevity (i.e. perennial, woody and resprouters) were most correlated with pre-European patch size and showed a consistent and monotonic decrease in slope and R2 from oldest (pre-European) to contemporary sampling periods. In contrast, traits associated with shorter lifespans (annual, non-woody, non-resprouter) had no consistent trend in slope or R2 across sampling periods and with greatest slope and R2 in the contemporary period. Taken as a whole, the observation that short-lived plants are most responsive to contemporary patch area and longer-lived plants to the pre-European patch area are suggestive of an extinction debt.
Discussion
Plant communities and their constituent species may exhibit a slow response to fragmentation, resulting in the development of an extinction debt in fragmented plant communities – i.e. species are initially retained within a patch following an impact but eventually lost. Estimation of extinction debt is important for predicting whether a plant community is on a trajectory towards species losses before they are realised, giving land managers and conservationists time to implement counteractive measures, and thus improve conservation outcomes. The communities examined in this study are of high conservation value, with both tuart and banksia woodlands federally listed as endangered (Commonwealth of Australia 2016, 2019). However, until now and to our knowledge, no study has assessed either of these communities for extinction debt. This study presents an opportunity to further understand the risk status of these communities using multiple methods for detecting extinction debt that together provide stronger inference than any method in isolation.
The methods used each have constraints in terms of both the level of data required, and the inference possible. Method 2 was the most useful in determination of a quantifiable value for extinction debt, but is based on the assumption of stable fragments, and as such, can only be considered an estimation. Method 1 – the simplest to implement – could not predict the magnitude of future species loss, as temporal species richness data are not used with this method. Method 3, which was unable to be used successfully in this study, requires repeated monitoring enabling direct observation of extinction debt and lag times over long time periods. Method 3 is the most accurate and desirable approach relative to Methods 1 and 2 but much harder and more costly to obtain the data required.
Our results show that ability to detect an extinction debt depends upon both data and methodology. We applied three methods with two, Method 1 (significant) and Method 2 (indicative), indicating a likely extinction debt for banksia woodland. One approach, Method 1, indicated the absence of an extinction debt for the adjacent tuart woodland, which is corroborated by higher turnover in tuart vs banksia woodlands. There were fewer data for tuart woodland, which meant that Method 2 could not be used to estimate extinction debt there. Consequently, there is more support for our findings for banksia woodlands than for tuart woodlands. Using Method 1, which uses contemporary species richness and habitat patch size, we found differing patterns of extinction debt between our two study communities, and an influence (although not statistically significant) on observed extinction debt of life history traits relating to longevity. Method 2, comparing contemporary species richness in stable and regressive habitat patches, suggested an average extinction debt of 13 species per patch (28%) in banksia woodland due to landscape changes arising from a reduction in patch sizes since European colonisation. Method 3 relies on differences (mainly patch size) between time points to predict contemporary richness from historical richness. There was minimal difference in richness, and most patches remained a similar size between 1992 and 2016. Rather than showing an absence of extinction debt, we suggest this method does not have the statistical power to detect a debt with minor changes in patch size between time points.
Method 1 provided some evidence that tuart woodlands may not have an extinction debt, whereas banksia woodlands are likely carrying an extinction debt in smaller patches. Findings from Method 2 were consistent with Method 1, that banksia woodlands may have an extinction debt, with an average debt estimated of 13 species per patch or 28% of mean richness. This debt compares 27.3% (26.5 species per patch) over 80 years in Belgian grasslands reported by Piqueray et al. (2011) using similar methods to this study. Piqueray et al. (2011) reported an overall richness of 492 species, so this extinction debt estimate is for a far less diverse plant community than banksia and tuart woodlands.
For both banksia and tuart woodlands, Method 3 was unable to estimate extinction debt at the time scale of this study (~25 years), as there was little evidence of species loss or patch size change over this time frame. Method 3 is likely only useful over longer timescales, or with initial survey prior to or early in landscape change. However, early detection (as provided by Methods 1 and 2) is beneficial from a management perspective because there is time to intervene and mitigate species losses (Cousins 2009).
Delayed extinctions are more likely for long-lived species, which are characterised by slow demographic rates. Such species are expected to show longer relaxation times (time taken for the community to reach a new equilibrium) than short-lived species (Kuussaari et al. 2009; Krauss et al. 2010). Our study shows a lack of relationship between contemporary native richness of banksia woodland and contemporary area, with richness being more strongly related to historical area, suggesting that there may be a large extinction debt in banksia woodlands at the time of this study. Banksia woodland typically contains many long-lived species, with some known to live for 100, and perhaps up to 300, years or more (Enright and Lamont 1992). This is particularly true for species that are able to regrow vegetatively after fire from protected buds either on stems or in the soil (Bond and Van Wilgen 2012). Although we identified an extinction debt (Method 1) and estimated an average extinction debt of 13 species per patch (Method 2), due to the longevity of plant species in banksia woodland and the relatively recent fragmentation (European colonisation in 1829), it may be too early for the magnitude of this debt to be predicted accurately using our dataset which spans just 25 years of change (Method 3).
The contrary may be true for tuart woodlands, appearing to be at equilibrium, with no evidence of an extinction debt (i.e. some species likely already lost and the community returned to species–area equilibrium) within the timeframe of our study. Tuart woodland showed a stronger relationship with contemporary area, compared with banksia woodland, suggesting any extinction debt that might have been present after fragmentation is quickly paid (i.e. species are lost). The correlation that we have observed between tuart woodland and contemporary landscape area is consistent with the trait suite characteristic of plant species associated with the calcareous soil type on which this plant community type is found. Woodlands on these younger, calcareous soils have a higher proportion of non-resprouter, faster-growing and shorter-lived taxa, including various species of Acacia, and species such as Banksia sessilis and Olearia axillaris, than the older, acid sands that support banksia woodlands (Monk et al. 1981; Millar et al. 2019), and thus this may explain why extinction debt was not detected in tuart woodlands, as they likely respond more quickly to habitat fragmentation. That said, given extinction debt can go undetected (Kuussaari et al. 2009) more data are needed, and other methods tested, to support or refute our findings for tuart woodlands.
Factors other than patch size may explain species losses in plant communities over time. One key factor in our landscape is rainfall decline, which has occurred during the same period as the window between historical and contemporary vegetation surveys. If rainfall decline accelerates the loss of species, then it would be reducing extinction debt (i.e. the communities would be moving more quickly towards a new equilibrium). Further, if rainfall decline was playing a contributing role, we would anticipate it to contribute to both communities, as seedlings in both would be impacted by recruitment bottlenecks with summer drought.
Another key factor that may offset extinction debt is connectivity among patches, which aids fundamental ecological processes – including pollination, gene flow and dispersal – contributing to community and species viability (Jennersten 1988; Provan et al. 2008; Valiente-Banuet et al. 2015). Further, reduced connectivity and consequent increased edge effects can increase the presence of stressors, such as abundance of weeds, plant disease and nutrient enrichment (Leishman and Thomson 2005; Thomas et al. 2006; Sax and Gaines 2008; Dullinger et al. 2012). We were unable to evaluate the degree of connectivity and how it may counteract the influence of patch size reduction on future extinctions. This could be investigated further in future studies, including how connectivity may influence species responses to fragmentation differently, and at differing timescales related to species level traits.
We found no key traits to be significant in driving this extinction debt in either woodland community, although trait groups with the greater longevity (i.e. perennials vs annuals, woody vs non-woody, resprouters vs non-resprouters) consistently showed better fit to historical (contiguous) than to contemporary (fragmented) area. However, our analysis of traits was coarse, and a more nuanced analysis of species (based on varying longevity among perennials) may be worthwhile. Other trait types may also be worth investigating. For example, pollination-based traits may influence the pollination distance required for successful reproduction, so plants associated with certain pollinators may be negatively impacted by a lack of ability to transfer genetic material across widely spaced fragments with limited connectivity (Greenleaf et al. 2007; Cranmer et al. 2012).
Implications for conservation
Detecting extinction debt in plant communities offers the opportunity to develop a greater understanding of remnant native vegetation change (past) and a projection for change into the future. Steps can be taken to pre-empt species decline and eventual extinction through conservation, management and restoration of remnant vegetation patches (Hahs and McDonnell 2014). Restoration is likely the primary means of long-term viability of populations suffering an extinction debt, through supplementary planting of at-risk groups, and improving landscape connectivity (Meyer 2019). Proactive management of species identified as the most vulnerable to loss would be the best-practice approach, however more research would be required to identify these species and groups, and if they warrant such intensive conservation efforts. Instead, site-led management may be sufficient to delay the effects of extinction debt by reducing additional pressures on species through invasive species, access, and fire regime management. Understanding how different community types, and functional trait types, respond to time-delayed impacts will also help land managers to prioritise intervention efforts using SMART (specific, measurable, achievable, realistic, time-bound) goals. Being able to predict extinction debt for plant communities provides opportunity for conservation efforts; the sooner intervention occurs, the more likely it is to be successful in mitigating species loss.
Conclusions
The results we present here show that different plant communities are likely to respond differently to landscape change over varying timescales, highlighting the importance of community level management and understanding. Testing for an extinction debt offers the opportunity to predict future management needs to enable persistence of isolated populations of plant species. Although we estimated an average extinction debt of 13 species per patch using Method 2, this value may increase with further reduction in patch size, with serious conservation implications given more than a quarter of species (~28%) may be lost to fragmentation. Repetition of this study in the future could help to identify species or species groups experiencing an extinction debt in greater detail, enriching the dataset, and the value of the approach for species conservation and land management.
Acknowledgements
We acknowledge the Noongar (Yued, Whadjuk and Binjareb) traditional owners of the study area and recognise their continuing connection to land, waters and culture. We pay our respects to their Elders past and present. We also thank the Department of Biodiversity Conservation and Attractions, and local government authorities for allowing access to sites and to historical data. This project would not have been possible without the help of the many volunteers during the field component of this study. Full acknowledgement is given in Appendix 1.
References
Adriaens D, Honnay O, Hermy M (2006) No evidence of a plant extinction debt in highly fragmented calcareous grasslands in Belgium. Biological Conservation 133, 212-224.
| Crossref | Google Scholar |
Avolio ML, Koerner SE, La Pierre KJ, Wilcox KR, Wilson GWT, Smith MD, Collins SL (2014) Changes in plant community composition, not diversity, during a decade of nitrogen and phosphorus additions drive above-ground productivity in a tallgrass prairie. Journal of Ecology 102, 1649-1660.
| Crossref | Google Scholar |
Bates D, Mächler M, Bolker B, Walker S (2015) Fitting linear mixed-effects models using lme4. Journal of Statistical Software 67, 1-48.
| Crossref | Google Scholar |
Beard JS (2001) A historic vegetation map of Australia. Austral Ecology 26, 441-443.
| Crossref | Google Scholar |
Bureau of Meteorology (2022) Climate data online. Available at http://www.bom.gov.au/climate/data/
Cousins SAO (2009) Extinction debt in fragmented grasslands: paid or not? Journal of Vegetation Science 20, 3-7.
| Crossref | Google Scholar |
Cowlishaw G (1999) Predicting the pattern of decline of African primate diversity: an extinction debt from historical deforestation. Conservation Biology 13, 1183-1193.
| Crossref | Google Scholar |
Cranmer L, McCollin D, Ollerton J (2012) Landscape structure influences pollinator movements and directly affects plant reproductive success. Oikos 121, 562-568.
| Crossref | Google Scholar |
du Toit MJ, Kotze DJ, Cilliers SS (2016) Landscape history, time lags and drivers of change: urban natural grassland remnants in Potchefstroom, South Africa. Landscape Ecology 31, 2133-2150.
| Crossref | Google Scholar |
Dullinger S, Gattringer A, Thuiller W, Moser D, Zimmermann NE, Guisan A, Willner W, Plutzar C, Leitner M, Mang T, Caccianiga M, Dirnböck T, Ertl S, Fischer A, Lenoir J, Svenning J-C, Psomas A, Schmatz DR, Silc U, Vittoz P, Hülber K (2012) Extinction debt of high-mountain plants under twenty-first-century climate change. Nature Climate Change 2, 619-622.
| Crossref | Google Scholar |
Enright NJ, Lamont BB (1992) Recruitment variability in the resprouting shrub Banksia attenuata and non-sprouting congeners in the northern sandplain heaths of southwestern Australia. Acta Oecologica 13, 727-741.
| Google Scholar |
Ewers RM, Didham RK (2006) Confounding factors in the detection of species responses to habitat fragmentation. Biological Reviews of the Cambridge Philosophical Society 81, 117-142.
| Crossref | Google Scholar |
Figueiredo L, Krauss J, Steffan-Dewenter I, Sarmento Cabral J (2019) Understanding extinction debts: spatio–temporal scales, mechanisms and a roadmap for future research. Ecography 42, 1973-1990.
| Crossref | Google Scholar |
Gibson N (2014) Vegetation Survey in Western Australia. Journal of the Royal Society of Western Australia 97, 25-34.
| Google Scholar |
Gorelick N, Hancher M, Dixon M, Ilyushchenko S, Thau D, Moore R (2017) Google earth engine: planetary-scale geospatial analysis for everyone. Remote Sensing of Environment 202, 18-27.
| Crossref | Google Scholar |
Greenleaf SS, Williams NM, Winfree R, Kremen C (2007) Bee foraging ranges and their relationship to body size. Oecologia 153, 589-596.
| Crossref | Google Scholar |
Haddad NM, Brudvig LA, Clobert J, Davies KF, Gonzalez A, Holt RD, Lovejoy TE, Sexton JO, Austin MP, Collins CD, Cook WM, Damschen EI, Ewers RM, Foster BL, Jenkins CN, King AJ, Laurance WF, Levey DJ, Margules CR, Melbourne BA, Nicholls AO, Orrock JL, Song D-X, Townshend JR (2015) Habitat fragmentation and its lasting impact on Earth’s ecosystems. Science Advances 1, e1500052.
| Crossref | Google Scholar |
Hahs AK, McDonnell MJ (2014) Extinction debt of cities and ways to minimise their realisation: a focus on Melbourne. Ecological Management & Restoration 15, 102-110.
| Crossref | Google Scholar |
Hahs AK, McDonnell MJ, McCarthy MA, Vesk PA, Corlett RT, Norton BA, Clemants SE, Duncan RP, Thompson K, Schwartz MW, Williams NSG (2009) A global synthesis of plant extinction rates in urban areas. Ecology Letters 12, 1165-1173.
| Crossref | Google Scholar |
Hanski I, Ovaskainen O (2002) Extinction debt at extinction threshold. Conservation Biology 16, 666-673.
| Crossref | Google Scholar |
Helm A, Hanski I, Pärtel M (2006) Slow response of plant species richness to habitat loss and fragmentation. Ecology Letters 9, 72-77.
| Crossref | Google Scholar |
Hobbs RJ, Yates CJ (2003) Impacts of ecosystem fragmentation on plant populations: generalising the idiosyncratic. Australian Journal of Botany 51, 471-488.
| Crossref | Google Scholar |
Hopper SD, Gioia P (2004) The southwest Australian floristic region: evolution and conservation of a global hot spot of biodiversity. Annual Review of Ecology, Evolution, and Systematics 35, 623-650.
| Crossref | Google Scholar |
Humphreys AM, Govaerts R, Ficinski SZ, Nic Lughadha E, Vorontsova MS (2019) Global dataset shows geography and life form predict modern plant extinction and rediscovery. Nature Ecology & Evolution 3, 1043-1047.
| Crossref | Google Scholar |
Ives CD, Lentini PE, Threlfall CG, Ikin K, Shanahan DF, Garrard GE, Bekessy SA, Fuller RA, Mumaw L, Rayner L, Rowe R, Valentine LE, Kendal D (2016) Cities are hotspots for threatened species. Global Ecology and Biogeography 25, 117-126.
| Crossref | Google Scholar |
Jennersten O (1988) Pollination in Dianthus deltoides (Caryophyllaceae): effects of habitat fragmentation on visitation and seed set. Conservation Biology 2, 359-366.
| Crossref | Google Scholar |
Kapfer J, Hédl R, Jurasinski G, Kopecký M, Schei FH, Grytnes J-A (2017) Resurveying historical vegetation data – opportunities and challenges. Applied Vegetation Science 20, 164-171.
| Crossref | Google Scholar |
Kendal D, Zeeman BJ, Ikin K, Lunt ID, McDonnell MJ, Farrar A, Pearce LM, Morgan JW (2017) The importance of small urban reserves for plant conservation. Biological Conservation 213, 146-153.
| Crossref | Google Scholar |
Kopecký M, Macek M (2015) Vegetation resurvey is robust to plot location uncertainty. Diversity and Distributions 21, 322-330.
| Crossref | Google Scholar |
Krauss J, Bommarco R, Guardiola M, Heikkinen RK, Helm A, Kuussaari M, Lindborg R, Öckinger E, Pärtel M, Pino J, Pöyry J, Raatikainen KM, Sang A, Stefanescu C, Teder T, Zobel M, Steffan-Dewenter I (2010) Habitat fragmentation causes immediate and time-delayed biodiversity loss at different trophic levels. Ecology Letters 13, 597-605.
| Crossref | Google Scholar |
Kuussaari M, Bommarco R, Heikkinen RK, Helm A, Krauss J, Lindborg R, Ockinger E, Pärtel M, Pino J, Rodà F, Stefanescu C, Teder T, Zobel M, Steffan-Dewenter I (2009) Extinction debt: a challenge for biodiversity conservation. Trends in Ecology & Evolution 24, 564-571.
| Crossref | Google Scholar |
Leishman MR, Thomson VP (2005) Experimental evidence for the effects of additional water, nutrients and physical disturbance on invasive plants in low fertility Hawkesbury Sandstone soils, Sydney, Australia. Journal of Ecology 93, 38-49.
| Crossref | Google Scholar |
Meyer K (2019) Extinction debt repayment via timely habitat restoration. Theoretical Ecology 12, 297-305.
| Crossref | Google Scholar |
Millar MA, Coates DJ, Byrne M, Krauss SL, Jonson J, Hopper SD (2019) Assessment of genetic diversity and mating system of Acacia cyclops restoration and remnant populations. Restoration Ecology 27, 1327-1338.
| Crossref | Google Scholar |
Monk D, Pate JS, Loneragan WA (1981) Biology of Acacia pulchella R.br. with special reference to symbiotic nitrogen fixation. Australian Journal of Botany 29, 579-592.
| Crossref | Google Scholar |
Morris WF, Pfister CA, Tuljapurkar S, Haridas CV, Boggs CL, Boyce MS, Bruna EM, Church DR, Coulson T, Doak DF, Forsyth S, Gaillard J-M, Horvitz CC, Kalisz S, Kendall BE, Knight TM, Lee CT, Menges ES (2008) Longevity can buffer plant and animal populations against changing climatic variability. Ecology 89, 19-25.
| Crossref | Google Scholar |
Myers N, Mittermeier RA, Mittermeier CG, Da Fonseca GAB, Kent J (2000) Biodiversity hotspots for conservation priorities. Nature 403, 853-858.
| Crossref | Google Scholar |
Piqueray J, Bisteau E, Cristofoli S, Palm R, Poschlod P, Mahy G (2011) Plant species extinction debt in a temperate biodiversity hotspot: community, species and functional traits approaches. Biological Conservation 144, 1619-1629.
| Crossref | Google Scholar |
Provan J, Beatty GE, Hunter AM, McDonald RA, McLaughlin E, Preston SJ, Wilson S (2008) Restricted gene flow in fragmented populations of a wind-pollinated tree. Conservation Genetics 9, 1521-1532.
| Crossref | Google Scholar |
R Core Team (2020) R: a language and environment for statistical computing. Available at https://www.r-project.org/
Ramalho CE, Hobbs RJ (2012) Time for a change: dynamic urban ecology. Trends in Ecology & Evolution 27, 179-188.
| Crossref | Google Scholar |
Ritchie AL, Svejcar LN, Ayre BM, Bolleter J, Brace A, Craig MD, Davis B, Davis RA, Van Etten EJB, Fontaine JB, Fowler WM, Froend RH, Groom C, Hardy GESJ, Hooper P, Hopkins AJM, Hughes M, Krauss SL, Leopold M, Miller BP, Miller RG, Ramalho CE, Ruthrof KX, Shaw C, Stevens JC, Tangney R, Valentine LE, Veneklaas EJ, Hobbs RJ (2021) A Threatened Ecological Community: research advances and priorities for Banksia Woodlands. Australian Journal of Botany 69, 53-84.
| Crossref | Google Scholar |
Sax DF, Gaines SD (2008) Species invasions and extinction: the future of native biodiversity on islands. Proceedings of the National Academy of Sciences of the United States of America 105, 11490-11497.
| Crossref | Google Scholar |
Thomas CD, Cameron A, Green RE, Bakkenes M, Beaumont LJ, Collingham YC, Erasmus BFN, De Siqueira MF, Grainger A, Hannah L, Hughes L, Huntley B, van Jaarsveld AS, Midgley GF, Miles L, Ortega-Huerta MA, Townsend Peterson A, Phillips OL, Williams SE (2004) Extinction risk from climate change. Nature 427, 145-148.
| Crossref | Google Scholar |
Thomas CD, Franco AMA, Hill JK (2006) Range retractions and extinction in the face of climate warming. Trends in Ecology & Evolution 21, 415-416.
| Crossref | Google Scholar |
Tilman D, May RM, Lehman CL, Nowak MA (1994) Habitat destruction and the extinction debt. Nature 371, 65-66.
| Crossref | Google Scholar |
Turney CSM, Bird MI, Fifield LK, Roberts RG, Smith M, Dortch CE, Grün R, Lawson E, Ayliffe LK, Miller GH, Dortch J, Cresswell RG (2001) Early human occupation at Devil’s Lair, southwestern Australia 50,000 years ago. Quaternary Research 55, 3-13.
| Crossref | Google Scholar |
Valiente-Banuet A, Aizen MA, Alcántara JM, Arroyo J, Cocucci A, Galetti M, García MB, García D, Gómez JM, Jordano P, Medel R, Navarro L, Obeso JR, Oviedo R, Ramírez N, Rey PJ, Traveset A, Verdú M, Zamora R (2015) Beyond species loss: the extinction of ecological interactions in a changing world. Functional Ecology 29, 299-307.
| Crossref | Google Scholar |
Wearn OR, Reuman DC, Ewers RM (2012) Extinction debt and windows of conservation opportunity in the Brazilian Amazon. Science 337, 228-232.
| Crossref | Google Scholar |
Wickham H (2016) ‘ggplot2: elegant graphics for data analysis.’ (Springer-Verlag: New York, NY, USA). Available at https://ggplot2.tidyverse.org
Appendix 1. Acknowledgements
Field assistance
Willa Veber for field assistance in 2015 through Murdoch University.
Many volunteers assisted with the fieldwork of this project:
| Emily Eakin-Busher | Aimee Broadbridge | Nat Ardente | Marc Papalia |
| Kellie Fowler | Charmaine Ling | Andrew Schultz | Maria Volodina |
| John Fowler | Pete Steel | Ashayla Boucaut | Michael Williams |
| Corey Bovin | Reuben Molinari | Brandon Friend | Nate Anderson |
| Phoebe Webster | Casey Causley | Christina Birnbaum | Robin Scott |
| Cameron Jakson | Emmaline Yearsley | David Jago | Susan Fowler |
| Sian Dodd | Pawel Waryszak | Drew Smoker | Timothy Holmes |
| Kathrin Ploetz | Russell Miller | Jason Paterson | Mieke Sharp |
| Tyler Sharpe | Keryn Todd | Katherine Sturges | |
| Dani Bandt | James Griffiths | Lauren Svejcar |
Land managers
| Parks and Wildlife Service (WA Department of Biodiversity, Conservation and Attractions) | City of Wanneroo |
| City of Melville | City of Cockburn |
| City of Nedlands | City of Armadale |
| City of Joondalup | City of Fremantle |
| Shire of Peppermint Grove | WA Planning Commission |
| Town of Mosman Park | City of South Perth |
| Kings Park and Botanic Garden | Aquinas College |