

Environmental variation in an increasing incidence of dead trees in lowland to subalpine eucalypt forests and woodlands 2011–2021
Zimeng Liu A and Jamie B. Kirkpatrick A *
A *
A School of Geography, Planning, and Spatial Sciences, University of Tasmania, Hobart, Tas. 7005, Australia.
Australian Journal of Botany 71(6) 296-305 https://doi.org/10.1071/BT22119
Submitted: 17 October 2022 Accepted: 31 July 2023 Published: 18 August 2023
© 2023 The Author(s) (or their employer(s)). Published by CSIRO Publishing. This is an open access article distributed under the Creative Commons Attribution-NonCommercial-NoDerivatives 4.0 International License (CC BY-NC-ND)
Abstract
Context: There are not many analyses of variation in patterns and potential causes of tree death in eucalypt forests covering wide environmental gradients.
Aims: To determine the environmental patterns of standing and fallen dead trees in forests over 1200 m of elevation and whether tree death has increased as the climate has become warmer, drier and windier.
Methods: We measured tree death in 2011 and 2021 in the lowland to subalpine forests near Hobart, Tasmania, Australia and determined the best predictors of its incidence and change. High-resolution satellite images obtained from Nearmap were perused to count dead standing trees, fallen dead trees and live trees in a stratified random selection of 250, 4 ha sites, 10 of which were ground-truthed. Elevation, climatic variables, aspect, slope, fire history, soil type and vegetation type were used as potential predictors of tree death. General linear models were developed to explain response variables.
Key results: Standing dead trees increased 133% from 1.7 to 2.3 per ha between 2011 and 2021. Fallen dead trees increased 160%. Variables that were significant in at least one of the models for 2011 standing dead trees, 2011 fallen trees, change in standing dead trees 2011–2021 and changes in fallen dead trees 2011–2021 were elevation, fire history, aspect class, several vegetation types and several soil types.
Conclusions: Deficits in soil moisture as a major cause of death is consistent with several components of these models, with fire history possibly having a legacy effect and wind exposure possibly influencing the balance between standing and fallen dead trees.
Implications: Tree mortality is likely to move upslope with warming and drying. Managing the understorey of dry forests using fire might help in reducing competition for moisture, and, thus, reduce tree death in susceptible forest communities, but severe fires are likely to cause considerable mortality.
Keywords: conservation biology, drought, ecogeography, ecosystem dynamics, eucalypts, fire ecology.
Introduction
Extreme weather and fire events are becoming more intense and frequent (Fairman et al. 2016; Harris and Lucas 2019). High-severity fires (e.g. Prior et al. 2016), long droughts (e.g. Allen et al. 2015; Nolan et al. 2021), strong wind events (e.g. Klaus et al. 2011) and their interactions (e.g. Brando et al. 2014; Bendall et al. 2022) are associated with tree death in a time of accelerating climate change.
Eucalypts are variably resistant to fire, most species recovering from lignotubers or epicormic shoots, but some being killed by severe fire (Turner et al. 2009; Bowman et al. 2014). A fire in a mixed-age dry eucalypt forest can result in the death or dieback (canopy loss progression towards death) of some trees and thereby create gaps in the canopy. New eucalypt seedlings grow well on burned ground (Ashton 1981). Eucalypts regenerate poorly in shaded conditions and with root competition (Kirkpatrick 1997). If the time between fires exceeds the half millennium lifespan of eucalypts, they may be replaced by more shade-tolerant understorey tree species (Gilbert 1959). Hollows form in eucalypt trunks after fires (Koch et al. 2008). They can enlarge to the point of mechanical tree collapse after successive fires. Tree death in eucalypts can also result from wind throw, with the root plate switched from horizontal to vertical (Harrison-Day and Kirkpatrick 2019).
Defoliation by invertebrates (Landsberg and Cork 1997) or vertebrates (Kirkpatrick et al. 2000) can kill adult trees, as can pathogens such as Phytophthora cinnamomi (Shearer and Smith 2000; Weste 2003).
The above potential causes of eucalypt mortality are sensitive to the climatic changes that are currently occurring from increasing inputs of greenhouse gases in the atmosphere (IPCC 2022). Increased temperatures can deplete soil moisture and increase the range of soil pathogens. Increased temperatures and decreased rainfall can result in more frequent fires. Increased incidence of strong winds can increase tree throw.
It is important to know the environmental situations and vegetation types where increased mortality occurs, and the causes of increased mortality, because it may be possible, in some circumstances, to prevent tree loss by forest management.
In the present paper we describe the patterns of variation in density of standing and fallen dead trees in forest and woodlands around Hobart, Tasmania, Australia in 2011, changes in the density of dead trees between 2011 and 2021, and the associations of the density of dead trees and changes in density with topography, climate, soil, vegetation type and fire history. We expected that increases in dead trees over the ten years would be concentrated where forests were most exposed to the increasingly strong winds in the region, in places where increasing temperatures and decreasing rainfall have shifted soil moisture regimes out of the range of individual eucalypt species and in places where fire frequency has been high.
Methods
Study area
The study area of approximately 300 km2 (Fig. 1) was selected to encompass a wide range of environments and vegetation types. It encompasses lowland, montane and subalpine forests and woodlands adjacent to Hobart, Tasmania with the major topographic features being the Wellington Range on the western shore and the Meehan Range on the eastern shore. The two parts of the study area are separated by the built up area of Hobart and its suburbs and the Derwent Estuary. Some areas of cleared land and treeless vegetation are incorporated within these two parts of the study area but were not sampled as part of the present study.
Study area showing topography. The highest peak is kunanyi (Mt Wellington) at 1270 m and 42.8900°S 147.2300°E.
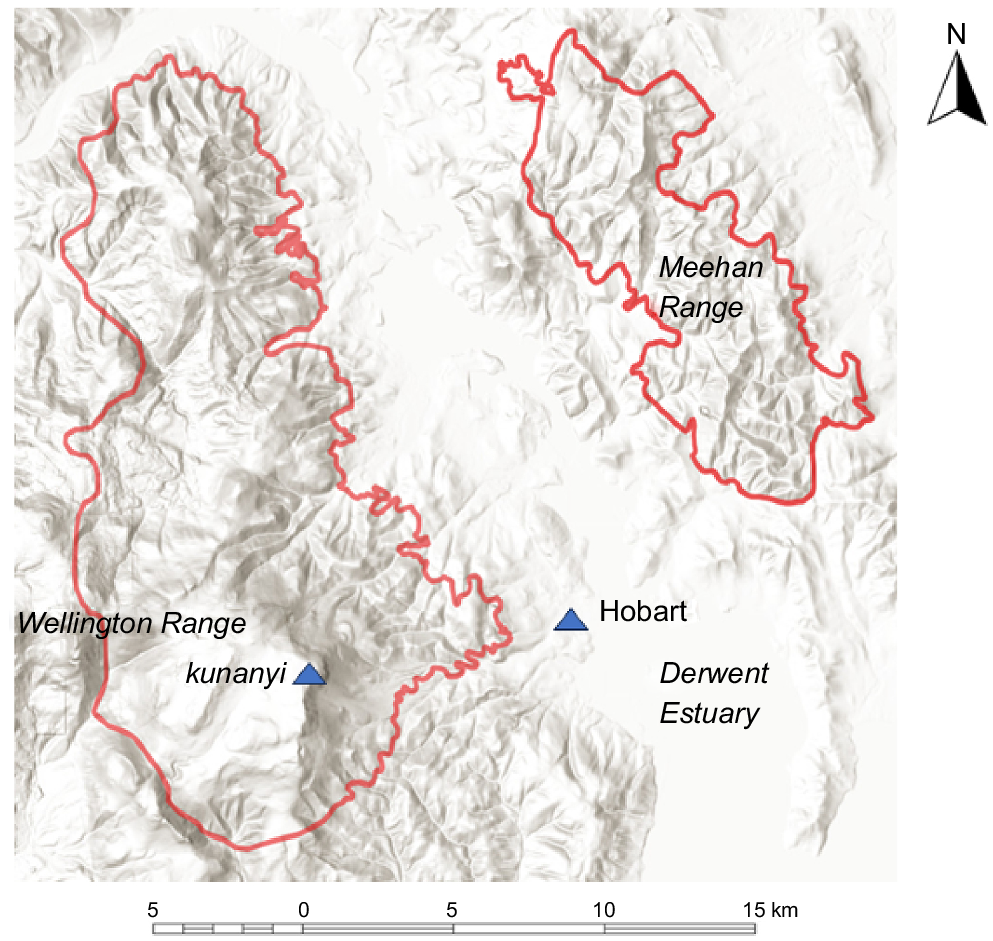
There is considerable variability in geology and soils, with the latter varying in fertility from productive alluvial soils to highly acid and phosphorus-deficient soils that form on sandstone (Dombrovskis et al. 1996). The major country rocks are Jurassic dolerite, Permian mudstone and Triassic sandstones. Below the montane zone the soils increase in depth and coarseness of texture in this sequence, making the sandstone soils the least liable to drought (Kirkpatrick and Marks 1985). At higher elevations, deep red-brown Liawenee soils, often with a lag deposit of rocks, form on dolerite slopes, with shallow rudosols associated with rock outcrops.
There is considerable variation in dominant eucalypt species and the nature of the understorey within the study area (Hogg and Kirkpatrick 1974; Kirkpatrick and Marks 1985; Pyrke and Kirkpatrick 1994; Dombrovskis et al. 1996). The driest lowland forests are dominated on sandstone by Eucalyptus amygdalina and have a heathy understorey, those on mudstone by E. amygdalina, Eucalyptus risdonii or Eucalyptus tenuiramis with a heathy understorey and those on dolerite by Eucalyptus viminalis or Eucalyptus pulchella with a grassy to shrubby understorey. On moist aspects and in valleys in the lowlands there occur Eucalyptus globulus and Eucalyptus obliqua dominated forests with understoreys that vary from grassy, through heathy and shrubby to dominance by broad-leaved small trees (wet eucalypt forest). The montane vegetation, confined to the western shore, is dominated largely by Eucalyptus delegatensis, whereas the subalpine forests and woodlands are largely dominated by Eucalyptus coccifera.
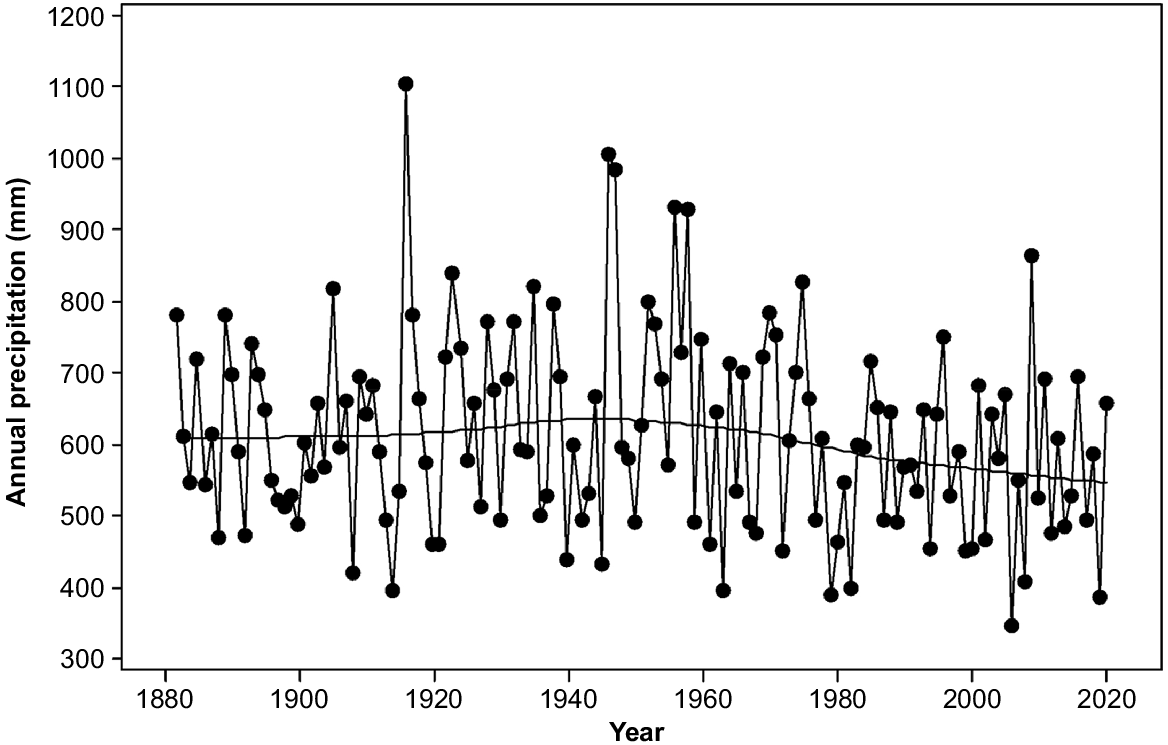
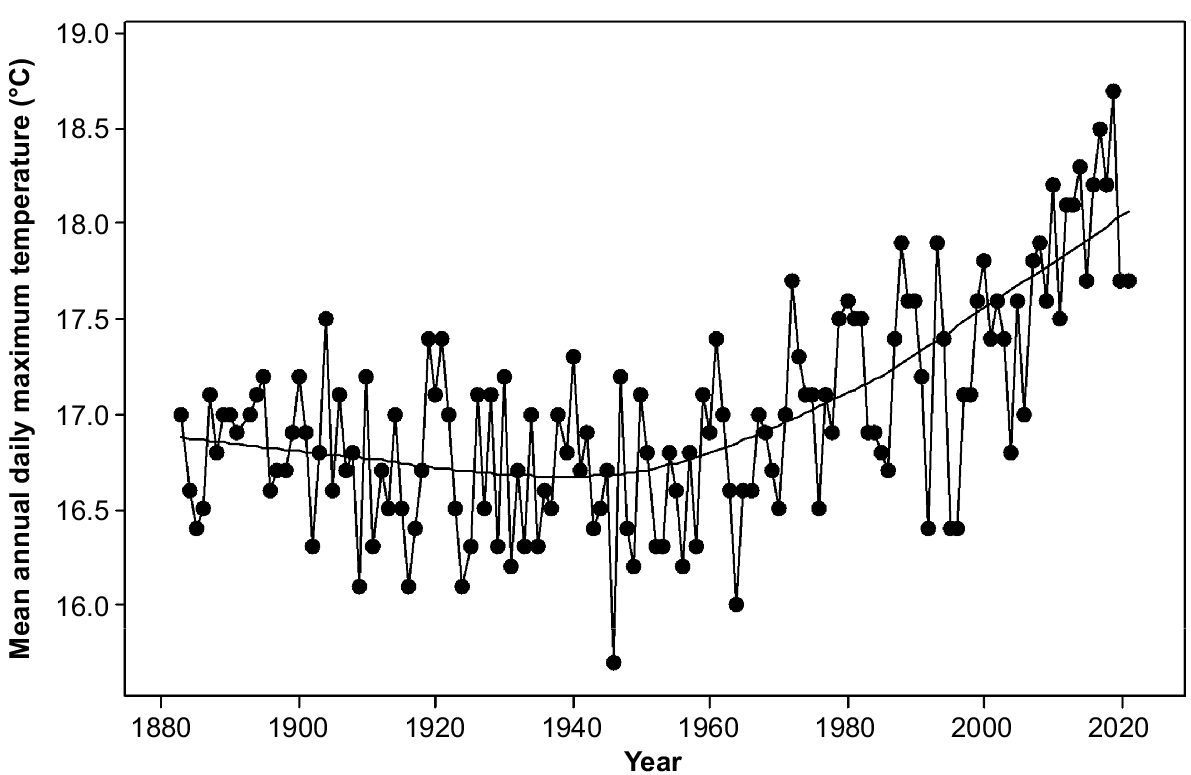
Rainfall in the study area varies from 400 mm per annum on parts of the eastern shore to over 1200 mm per annum on the upper slopes of kunanyi (Mount Wellington). Precipitation has been declining since the 1940s and varying more strongly between consecutive years rather than over several years (Fig. 2). Topography strongly affects moisture availability through its strong influence on solar radiation. The radiation differences between north- and south-facing slopes are maximum in mid latitudes (Kirkpatrick and Nunez 1980). Mean daily maximum temperatures have been increasing exponentially since the 1940s (Fig. 3). The overall increase has approximated one degree centigrade (Fig. 3).
Annual precipitation in Hobart (data from Bureau of Meteorology, Australia). Lowess smoother is shown.
Mean annual daily maximum temperature at Hobart (data from Bureau of Meteorology, Australia). Lowess smoother is shown.
The highest wind speeds have increased in the same period as a result of the steepening of the pressure gradient over Tasmania (Kirkpatrick et al. 2017). The strongest winds come from the north-west. These winds and those from the south-west have the strongest ecological effects in Tasmania (Morgan et al. 2010; Annandale and Kirkpatrick 2017; Fitzgerald and Kirkpatrick 2017).
Almost all of the western part of the study area was burned in 1967. Areas above the 500 m contour have been mostly unburned since then, but many fires, both planned and unplanned, occurred in most of the area below this contour on both the eastern and western shores.
Data collection
The study area was stratified by the following predictor variables (see below for more details): aspect (five classes), soil types (six classes), vegetation types (10 classes). The random point generation process in the geographic information system software QGIS was run until each class in each category had a minimum of 10 points, resulting in 250 locations. Areas within the study area boundary were excluded from the selection process if they did not support native forest or woodland.
Running means were calculated for the number of dead trees on 1, 2, 3, 4 and 5 ha for several of these locations. The means stabilised at 4 ha (200 m × 200 m). Images for 17 March 2021 and 6 March 2011 were selected from the Nearmap archive. A total of 500 aerial images with a resolution of 0.075 (metres/pixel) (width 3660 px, height 3660 px) were extracted.
The following data were obtained from the images by visual inspection on the screen: the number of standing dead trees in 2021; the number of standing dead trees in 2011; the number of fallen trees in each of a north to south direction, a west to east direction; a north-west to south-east direction, a north-east to south-west direction in 2021; the total number of fallen trees in all directions in 2011. Live trees in 2021 were counted in four 50 m × 50 m plots in each corner of the 4 ha plots.
In the early stages of measurement, 10 of the 250 4 ha plots were used for ground truthing. They were selected to represent a wide range of environments and to be accessible (<1 km) from roads. Standing dead tree interpretation on the aerial image proved to be highly accurate when there was no presence of shadow on satellite images. There was intermediate accuracy (average of 83.3%, but as low as 53.3%) when shadow was present in the satellite images. The results of the ground truthing led to a change in calibration of interpretation. After modifying the interpretation standards to incorporate the plot inspection results, the accuracy improved to 98.1% (average).
Undiscovered fallen trees were typically located under the tree canopy, where they were not visible in aerial images. The plot inspections produced an average of 16.8% of undiscovered fallen trees in relation to the number of fallen dead trees that were visible in the aerial image. We did not modify our results to compensate for this underestimation, as we did not fully understand the causes of its variability.
The percentage slope of plots was calculated by height over distance, measured orthogonal to the contours between the two closest contour lines to the central point of the 4 ha plot. The elevation was obtained from a high-resolution digital elevation model in Nearmap. Reflecting shelter from wind and dryness, aspect was placed in the following classes: north-west was scored as 1, north and west as 2, north-east and south-west as 3, south and east as 4 and south-east as 5.
Correlated Reconnaissance Soil Types from Land Information System Tasmania (LISTmap, https://maps.thelist.tas.gov.au/listmap/app/list/map) were extracted for each point. Three soil types (A, Bl and Bld1) were recorded as missing values because of rarity. Pm1 (podzolic soils on mudstone 1 and 2 – henceforth ‘mudstone soils’), Lw (Liawenee Association – henceforth ‘mountain soil’), Bd1 (brown soils on dolerite 1 – henceforth ‘brown soil’), M1(miscellaneous soils – henceforth ‘alluvial soil’), Pss (podzol and podzolic soils on sandstone, – henceforth ‘sandstone soil’) and Pd1 (podzolic soils on dolerite 1 – henceforth ‘dolerite podzolics’) were included in stratification and analyses. Each of the types was a different variable as some 4 ha sites had more than one type. They were recorded as presence/absence.
Tasveg 4.0 from LISTmap was used to extract presence/absence of each vegetation type for each site. The following vegetation types were frequent enough to include in stratification for site selection and analyses: E. amygdalina forest on mudstone (DAM), E. coccifera forest and woodland (DCO), E. delegatensis dry forest and woodland (DDE), E. globulus dry forest and woodland (DGL), E. obliqua dry forest (DOB), E. pulchella forest and woodland (DPU), E. risdonii forest and woodland (DRI), E. tenuiramis forest and woodland on sediments (DTO), E. viminalis grassy forest and woodland (DVG) and E. obliqua wet forest (WOU). Names have been abbreviated by removing ‘and woodland’.
The Fire History layer in LISTmap was used to determine years since the last fire for all points for both 2011 and 2021. After examination of histograms of values for 2011 and 2021, the following classes were used in analyses: 0–20 years, 21–40 years, 41–60 years, >60 years. The February rainfall and February mean monthly temperatures were extracted from Digital Climate Maps in LISTmap. This month was chosen to represent climate because it is the driest and equal warmest month, a month in which drought is most likely to occur (http://www.bom.gov.au/climate/averages/tables/cw_094029.shtml, accessed 25 July 2023).
Data analysis
The default general linear model procedure in Minitab 16 was employed to develop the best model to predict each of standing dead trees in 2011, fallen dead trees in 2011, change in standing dead trees between 2011 and 2021 and change in fallen dead trees between 2011 and 2021. For each analysis, a normality test was performed to determine whether the residual variance was normally distributed. Temperature and rainfall data were very strongly correlated with elevation, so were excluded from the modelling process. All other variables were included. Variables with the highest P-values were successively removed until all were <0.05. These reduced models are the ‘models’ that are referred to later in the text.
To understand the directionality of class components of models in relation to response variables the means for classes were tabulated. The relationships between covariates and the response variables were graphed and Lowess lines (segmented regression lines) fitted with a 0.5° of smoothing and two steps. Paired t-tests were used to determine if there were consistent differences between the numbers of dead trees lying south–north, north-west–south-east, west–east and south-west–north-east. To test whether changes in standing dead trees predicted changes in fallen dead trees we used linear regression.
Results
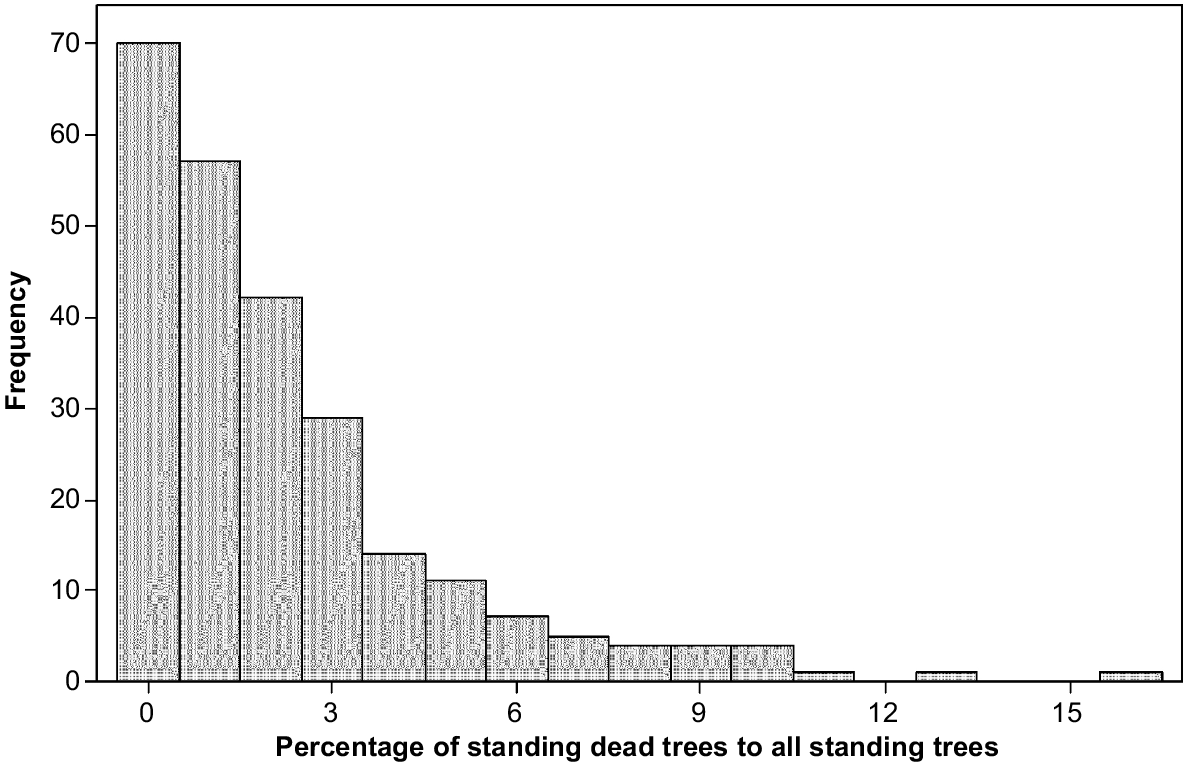
Between 2011 and 2021, standing dead trees increased from a mean of 1.70–2.26 per ha, and fallen dead trees increased from 2.58 to 4.13 per ha. To give context, in 2021, the number of live trees per ha averaged 113.4, making the percentage of all dead trees to the total of live and dead trees equal 5.6%. There was not a significant relationship between live tree number and fallen trees in 2021. The standing dead trees in 2021 were up to 15.7% of all standing trees live or dead, with most 4 ha plots having none or very few standing dead trees (Fig. 4).
The model for standing dead trees in 2011 included only E. delegatensis dry forest and E. globulus dry forest (Table 1). It explained little of the variance (Table 1). The two vegetation types had higher numbers of standing dead trees than the mean for all plots (Table 2).
| Predictor | Standing dead 2011 | Fallen 2011 | Change SD | Change FD |
|---|---|---|---|---|
| Elevation (m) | – | – | −0.004** | – |
| Aspect class | – | – | *** | – |
| Years since fire class | – | ** | – | *** |
| E. coccifera forest | – | *** | – | – |
| E. delegatensis forest | ** | * | ** | – |
| E. globulus dry forest | *** | – | – | – |
| E. pulchella forest | – | ** | – | – |
| E. tenuiramis forest on sed. | – | ** | – | ** |
| Brown soil | – | – | * | *** |
| Mudstone soil | – | – | – | ** |
| R2 (%) | 7.9 | 12.2 | 14.7 | 30.2 |
–, not in model; sed., sedimentary rocks.
*P < 0.05, **P < 0.01, ***P < 0.001.
| Predictor | Standing dead | Fallen dead | Change SD | Change FD |
|---|---|---|---|---|
| Brown soil | 7.9 | 9.8 | 1.2 | 10.0 |
| Mudstone soil | 6.7 | 10.3 | 4.1 | 9.9 |
| E. coccifera forest | 5.8 | 15.5 | 0.0 | 1.9 |
| E. delegatensis dry forest | 9.3 | 11.9 | −0.4 | 0.7 |
| E. globulus dry forest | 10.5 | 12.3 | 3.0 | 10.1 |
| E. pulchella forest | 8.3 | 12.2 | 3.3 | 6.5 |
| E. tenuiramis forest on sed. | 6.7 | 14.5 | 3.3 | 13.0 |
| All plots | 6.8 | 10.3 | 2.3 | 6.2 |
sed., sedimentary rocks.
The model for fallen dead trees in 2011 explained slightly more of the variance than the model for standing dead trees (Table 1). Time since last fire was important in the model, with the number of fallen dead trees generally decreasing as the time since fire increased (Table 3). The model also included E. coccifera forest, E. delegatensis forest, E. pulchella forest and E. tenuiramis forest on sediments, all of which had more fallen dead trees in 2011 than the mean for all plots (Table 2).
| Years since fire | Standing dead | Fallen dead | Change SD | Change FD |
|---|---|---|---|---|
| 0–20 years | 6.1 | 14.0 | 2.2 | 5.3 |
| 21–40 years | 9.6 | 11.8 | 4.9 | 13.1 |
| 41–60 years | 6.7 | 8.5 | 1.9 | 2.7 |
| >60 years | 5.9 | 10.9 | 2.2 | 8.6 |
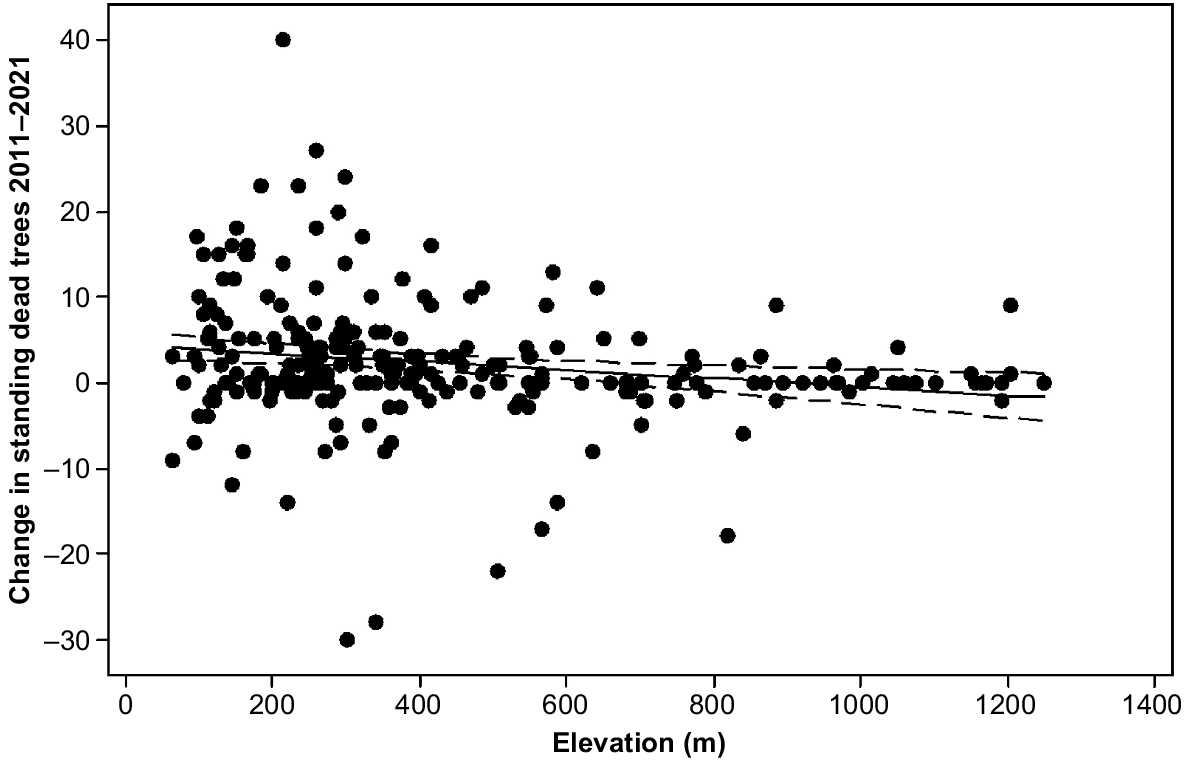
The model for change in number of standing dead trees explained 14.7% of the variance by elevation, aspect, E. delegatensis dry forest and brown soils (Table 1). Elevation was a negative predictor in the model (Fig. 5). The more sheltered and moist aspect classes facing south and east had more deaths in the period than the more exposed classes (Table 4). E. delegatensis dry forest and brown soils had lesser change values than the rest (Table 2).
Change in standing dead trees 2011–2021 in the 4 ha plots by elevation showing line of best fit (4.39–0.00489 Elevation (m)) and 95% confidence intervals.
| Aspect class | Standing dead | Fallen dead | Change SD | Change FD |
|---|---|---|---|---|
| North-west aspect | 3.5 | 13.7 | 0.4 | 10.8 |
| North and west aspects | 5.9 | 8.5 | −0.2 | 5.9 |
| South-west and north-east | 8.1 | 11.7 | 2.2 | 6.8 |
| South and east | 8.7 | 8.8 | 3.7 | 3.4 |
| South-east aspect | 6.8 | 9.4 | 5.5 | 4.3 |
The model for change in the number of fallen dead trees explained 30.2% of the variance, through significant effects of fire history, E. tenuiramis forest on sediment and two soil types (Table 1). Sites burned between 20 and 40 years before 2021 had higher increases in fallen dead trees than plots burned more recently or longer ago (Table 3). Sites with brown and mudstone soils and E. tenuiramis forest on sediment had large increases (Table 2).
The highest number of fallen trees in the plots lay south-west–north-east (mean = 5.1) followed by south–north (mean = 4.5), west–east (mean = 3.6) and north-west to south-east (mean = 3.4). The number that lay south-west–north-east were greater than the number that lay west to east (t = 4.81, P < 0.001) and the number that lay north-west to south-east (t = 5.55, P < 0.001), but not the number that lay south–north (t = 1.73, P = 0.086). The number of south–north trees was greater than the number of west–east trees (t = 3.09, P = 0.002) and the number that lay north-west to south-east (t = 3.93, P < 0.001). There was no difference between the number of fallen trees orientated east to west and those orientated north-west to south-east (t = 0.84, P = 0.402).
The relationship between changes in fallen dead trees and changes in standing dead trees was not significant (P = 0.833, with most plots clustered around the zero–zero point (Fig. 6).

Discussion
Effects of climate change
The increases in numbers of both standing dead trees and fallen trees between 2011 and 2021 indicate that the increase in tree death apparently associated with climate change that has been observed elsewhere in the world (e.g. van Mantgem et al. 2009; Michaelian et al. 2011; Matusick et al. 2013; Fensham et al. 2015) is likely to be occurring in Tasmania. The trends in precipitation (Fig. 2), daily maximum temperatures (Fig. 3) and strong wind incidence (Kirkpatrick et al. 2017) in the region are consistent with increased tree death from water deficit and wind throw.
Explaining variation in standing dead trees
In 2011, the significance of E. delegatensis dry forests in the model for standing dead trees was almost certainly a legacy of the great fire of 1967 (Solomon and Dell 1967). The other component in the model, E. globulus forest, occurs in moister places than those dominated by all of E. viminalis, E. risdonii, E. tenuiramis, E. pulchella and E. amygdalina (Hogg and Kirkpatrick 1974; Kirkpatrick and Nunez 1980; Kirkpatrick and Marks 1985). Of these types only E. pulchella forest had high levels of standing dead trees in 2011 (Table 2). This forest type occurs on shallow soils over a massive dolerite bedrock, so is particularly susceptible to drought (Kirkpatrick and Marks 1985). E. globulus forest is absent from the driest aspects where standing dead tree numbers are low, and often occurs in valleys where moisture stress can be magnified by a reduction in overland and subaerial water flow during dry years, in a process called gully dieback (Palzer 1981). It may be that the forests in drier places than those dominated by E. globulus had already adjusted by 2011 to the increase in incidence of summer drought that occurred in eastern Tasmania from 1978 onwards (Kirkpatrick et al. 2000), with the extra stress provided by stronger winds and warmer temperatures shifting the front of dieback into the moister places occupied by E. globulus.
The only significant predictor in common between the model for standing dead trees in 2011 and the model for change in standing dead trees between 2011 and 2021 was E. delegatensis dry forest, but the effect was positive for 2011 and negative for change. Almost all the area of this vegetation type near Hobart was burned in 1967. A considerable number of standing dead trees that resulted from the 1967 fire fell in the period 2011–2021, as basal rot and strong winds interacted on the slopes of kunanyi. The inclusion of brown soils on dolerite in the change model may reflect a past adjustment of tree density on these drought-prone soils to the lower summer rainfall that has occurred since 1978 (Kirkpatrick et al. 2000).
The high level of increase in standing dead trees on south-easterly aspects between 2011 and 2021 may be partly explicable by gully dieback effects. It might also be partly due to preferential windthrow of standing dead trees present in 2011 on the north-west-facing slopes as indicated by changes in fallen trees. Decreases in the change in standing dead trees with elevation may indicate that the upper slopes of kunanyi receive sufficient precipitation even in dry years to maintain tree health.
Explaining variation in fallen dead trees
Our data cannot tell us directly whether fallen dead trees were wind thrown when alive, causing death, or died then fell because of basal attrition by fire and/or rot and/or wind throw. It takes decades for all dead trees killed in hot fires to fall (Burton et al. 2021). Fallen trees can persist on the forest floor for many more decades (Burton et al. 2021), especially in the absence of further fire, which can combust the logs (Tasirin 2004). The increase in fallen dead trees by 160% in our ten year period cannot be attributed to the recent falling of trees killed in the 1967 fire, because the increase in fallen dead trees was least in this fire age group (Table 3). The loss of standing dead trees in E. delegatensis dry forest did not cause any major increase in fallen dead trees in this vegetation type (Table 2), indicating that the major cause of overall increase in fallen trees may have been an increased incidence of strong winds.
In 2011, fire history class was a significant variable in the model. There were less likely to be fallen dead trees 41–60 years since fire than earlier or later, a result that may partially have resulted from the concealment of fallen trees by understorey growth. It is notable that the vegetation type with some of the sparsest understories, E. tenuiramis forest on sediment, is in both the 2011 and change models with values well above the mean. Yet change in fallen dead trees between 2011 and 2021 was greater in plots burned before 1961 than those burned between 1961 and 1981 (Table 3), indicating no simple relationship between vegetation development and the obscuring of fallen trees. Variation in fallen dead trees was not related to changes in numbers of standing dead trees, which might have affected our measurements by making fallen trees more or less apparent.
E. coccifera forest, E. delegatensis dry forest and E. pulchella dry forest were significant in the 2011 fallen tree model. All had more fallen trees in 2011 than expected, but the numbers did not change sufficiently for these vegetation types to be in the change model, unlike for E. tenuiramis forest. It may be that the duplex podzolic soils on mudstone that support E. tenuiramis forest make it more susceptible to wind throw than the other vegetation types. These soils are in the model for fallen tree change along with the vegetation type. The brown soils, which are also in this model, form on dolerite. They are usually shallow over massive dolerite bedrock, which does not allow trees to easily anchor at depth, possibly facilitating wind throw.
The consistently higher incidence of fallen trees orientated south-west to north-east and south to north than those oriented north-west to south-east and west to east is consistent with the direction of wind-training of trees on kunanyi (Gilfedder 1988) and the direction of movement of vegetation in fjaeldmark over most of the state (Annandale and Kirkpatrick 2017), but inconsistent with the north-west to south-east distortion of alpine shrubs on the summit of kunanyi (Fitzgerald and Kirkpatrick 2017). Strong south-westerly and southerly winds are associated with cold conditions and the times of year when soils are full of moisture, possibly making them more effective in felling trees around Hobart than the strong north, north-westerly and westerly winds of summer. Yet, increase in fallen trees was highest between 2011 and 2021 on north-west-facing slopes, perhaps suggesting that the south-westerly and southerly orientation is a legacy effect.
Conservation implications
Our results show that the relationships between tree death, fire history and environment are highly complex. Despite this complexity, there is some correlative evidence that climate change is causing death of trees in the study area. Mortality over our study decade was least on the upper slopes of kunanyi, where deep soils, low temperature and high rainfall more than compensate for strong winds and steep slopes in keeping trees alive. However, the rare fires that occur in this environment have caused considerable tree death in the past, picked up in the 2011 models, and could do so again. Keeping fire out of the upper slopes of kunanyi is, thus, highly important for forest conservation as in the equivalent zones in the Australian Alps (Bowman et al. 2014).
On the lower slopes, drought may be one cause of tree mortality. Recent fire has been shown to be effective in reducing drought death by reducing competition for moisture (Kirkpatrick and Marks 1985), so planned burns may be effective in mitigation. Fires more frequent than once every 3 years appear to be less effective in reducing fire hazard than fires at a 5 year interval in E. viminalis dry forest (Kirkpatrick and Jenkinson 2022). Longer fire intervals might be appropriate for E. tenuiramis dry forest. Mechanical removal of understories, particularly those dominated by Allocasuarina verticillata, which is known to kill off eucalypts through moisture competition in drought conditions (Kirkpatrick 1997), may also be effective in preventing eucalypt death.
The topographic and edaphic complexity of the land occupied by forests around Hobart and its situation at a latitude of almost maximum contrast of radiation input between north and south-facing slopes means that the necessary migrations of species in response to climate change are very short, if suitable environments survive. This is fortunate as there is little indication of effective global action to stop greenhouse gas-induced climate change (IPCC 2022). In the medium term, without such action, we can expect a thinning of forests on the driest sites, a thinning that is likely to move progressively upslope.
One of the more striking features of our results is the association of tree death with particular types of vegetation and soil. A closer investigation of the processes that cause this concentration of mortality could be worthwhile.
References
Allen CD, Breshears DD, McDowell NG (2015) On underestimation of global vulnerability to tree mortality and forest die-off from hotter drought in the Anthropocene. Ecosphere 6, 1-55.
| Crossref | Google Scholar |
Annandale B, Kirkpatrick JB (2017) Diurnal to decadal changes in the balance between vegetation and bare ground in Tasmanian fjaeldmark. Arctic, Antarctic, and Alpine Research 49, 473-486.
| Crossref | Google Scholar |
Bendall ER, Bedward M, Boer M, Clarke H, Collins L, Leigh A, Bradstock RA (2022) Changes in the resilience of resprouting juvenile tree populations in temperate forests due to coupled severe drought and fire. Plant Ecology 223, 907-923.
| Crossref | Google Scholar |
Bowman DMJS, Murphy BP, Neyland DLJ, Williamson GJ, Prior LD (2014) Abrupt fire regime change may cause landscape-wide loss of mature obligate seeder forests. Global Change Biology 20, 1008-1015.
| Crossref | Google Scholar |
Brando PM, Balch JK, Nepstad DC, Morton DC, Putz FE, Coe MT, Silverio D, Macedo MN, Davidson EA, Nobrega CC, Alencar A, Soares-Filho BS (2014) Abrupt increases in Amazonian tree mortality due to drought-fire interactions. Proceedings of the National Academy of Sciences of the United States of America 111, 6347-6352.
| Crossref | Google Scholar |
Burton JE, Bennett LT, Kasel S, Nitschke CR, Tanase MA, Fairman TA, Parker L, Fedrigo M, Aponte C (2021) Fire, drought and productivity as drivers of dead wood biomass in eucalypt forests of south-eastern Australia. Forest Ecology and Management 482, 118859.
| Crossref | Google Scholar |
Fairman TA, Nitschke CR, Bennett LT (2016) Too much, too soon? A review of the effects of increasing wildfire frequency on tree mortality and regeneration in temperate eucalypt forests. International Journal of Wildland Fire 25, 831-848.
| Crossref | Google Scholar |
Fensham RJ, Fraser J, MacDermott HJ, Firn J (2015) Dominant tree species are at risk from exaggerated drought under climate change. Global Change Biology 21, 3777-3785 PMID:.
| Crossref | Google Scholar | PubMed |
Fitzgerald NB, Kirkpatrick JB (2017) Wind distortion in alpine and subantarctic plants is constant among life forms but does not necessarily reflect prevailing wind direction. Arctic, Antarctic, and Alpine Research 49, 521-535.
| Crossref | Google Scholar |
Gilbert JM (1959) Forest succession in the Florentine Valley, Tasmania. Papers and Proceedings of the Royal Society of Tasmania 93, 129-151.
| Google Scholar |
Gilfedder L (1988) Factors influencing the maintenance of an inverted Eucalyptus coccifera tree-line on the Mt Wellington Plateau, Tasmania. Australian Journal of Ecology 13, 495-503.
| Crossref | Google Scholar |
Harris S, Lucas C (2019) Understanding the variability of Australian fire weather between 1973 and 2017. PLoS ONE 14, e0222328.
| Crossref | Google Scholar |
Harrison-Day V, Kirkpatrick J (2019) Pits, mounds, and vernal ponds in a Tasmanian subalpine grassland. Geographical Research 57, 230-237.
| Crossref | Google Scholar |
Hogg A, Kirkpatrick JB (1974) The phytosociology and synecology of some southern Tasmanian eucalypt forests and woodlands. Journal of Biogeography 1, 227-245.
| Crossref | Google Scholar |
IPCC (2022) ‘Climate change 2022 impacts, adaptation and vulnerability. Contribution of Working Group II to the Sixth Assessment Report of the Intergovernmental Panel on Climate Change’. (Eds H-O Pörtner, DC Roberts, M Tignor, ES Poloczanska, K Mintenbeck, A Alegría, M Craig, S Langsdorf, S Löschke, V Möller, A Okem, B Rama). (Cambridge University Press: Cambridge, UK) doi:10.1017/9781009325844
Kirkpatrick JB, Jenkinson I (2022) Effects of increasing fire frequency on conservation values in Eucalyptus grassy woodland in the process of invasion by Allocasuarina verticillata. Fire 5, 31.
| Crossref | Google Scholar |
Kirkpatrick JB, Marks F (1985) Observations on drought damage to some native plant species in eucalypt forests and woodlands near Hobart, Tasmania. Papers and Proceedings of the Royal Society of Tasmania 119, 15-21.
| Crossref | Google Scholar |
Kirkpatrick JB, Nunez M (1980) Vegetation-radiation relationships in mountainous terrain: eucalypt-dominated vegetation in the Risdon Hills, Tasmania. Journal of Biogeography 7, 197-208.
| Crossref | Google Scholar |
Kirkpatrick JB, Zacharek A, Chappell K (2000) Testing methods for mitigation of tree dieback in Tasmanian dry eucalypt forests and woodlands. Pacific Conservation Biology 6, 94-101.
| Crossref | Google Scholar |
Kirkpatrick JB, Nunez M, Bridle KL, Parry J, Gibson N (2017) Causes and consequences of variation in snow incidence on the high mountains of Tasmania, 1983-2013. Australian Journal of Botany 65, 214-224.
| Crossref | Google Scholar |
Klaus M, Holsten A, Hostert P, Kropp JP (2011) Integrated methodology to assess windthrow impacts on forest stands under climate change. Forest Ecology and Management 261, 1799-1810.
| Crossref | Google Scholar |
Koch AJ, Munks SA, Driscoll D, Kirkpatrick JB (2008) Does hollow occurrence vary with forest type? A case study in wet and dry Eucalyptus obliqua forest. Forest Ecology and Management 255, 3938-3951.
| Crossref | Google Scholar |
Matusick G, Ruthrof KX, Brouwers NC, Dell B, Hardy GSJ (2013) Sudden forest canopy collapse corresponding with extreme drought and heat in a Mediterranean-type eucalypt forest in southwestern Australia. European Journal of Forest Research 132, 497-510.
| Crossref | Google Scholar |
Michaelian M, Hogg EH, Hall RJ, Arsenault E (2011) Massive mortality of aspen following severe drought along the southern edge of the Canadian boreal forest. Global Change Biology 17, 2084-2094.
| Crossref | Google Scholar |
Morgan SW, Kirkpatrick JB, di Folco M-B (2010) Wind-controlled linear patterning and cyclic succession in Tasmanian Sphagnum mires. Journal of Ecology 98, 583-591.
| Crossref | Google Scholar |
Nolan RH, Gauthey A, Losso A, Medlyn BE, Smith R, Chhajed SS, Fuller K, Song M, Li X, Beaumont LJ, Boer MM, Wright IJ, Choat B (2021) Hydraulic failure and tree size linked with canopy die-back in eucalypt forest during extreme drought. New Phytologist 230, 1354-1365 PMID:.
| Crossref | Google Scholar | PubMed |
Prior LD, Williamson GJ, Bowman DMJS (2016) Impact of high-severity fire in a Tasmanian dry eucalypt forest. Australian Journal of Botany 64, 193-205.
| Crossref | Google Scholar |
Pyrke AF, Kirkpatrick JB (1994) Growth rate and basal area response curves of four Eucalyptus species on Mt. Wellington, Tasmania. Journal of Vegetation Science 5, 13-24.
| Crossref | Google Scholar |
Solomon RJ, Dell AR (1967) The Hobart bushfires of February, 1967. Australian Geographer 10, 306-308.
| Crossref | Google Scholar |
Tasirin J (2004) The influence of Eucalyptus globulus Labill. on the environment and vascular plants in a Tasmanian grassy woodland. Unpublished PhD thesis, University of Tasmania, Hobart, Australia. doi:10.25959/23241194.v1
Turner PAM, Balmer J, Kirkpatrick JB (2009) Stand-replacing wildfires? The incidence of multi-cohort and single-cohort Eucalyptus regnans and E. obliqua forests in southern Tasmania. Forest Ecology and Management 258, 366-375.
| Crossref | Google Scholar |
van Mantgem PJ, Stephenson NL, Byrne JC, Daniels LD, Franklin JF, Fulé PZ, Harmon ME, Larson AJ, Smith JM, Taylor AH, Veblen TT (2009) Widespread increase of tree mortality rates in the western United States. Science 323, 521-524.
| Crossref | Google Scholar |
Weste G (2003) The dieback cycle in Victorian forests: a 30-year study of changes caused by Phytophthora cinnamomi in Victorian open forests, woodlands and heathlands. Australasian Plant Pathology 32, 247-256.
| Crossref | Google Scholar |