Updated predictions of enteric methane emissions from sheep suitable for use in the New Zealand national greenhouse gas inventory
Natasha Swainson A , Stefan Muetzel A and Harry Clark B CA AgResearch Ltd, Grasslands Research Centre, Tennent Drive, Private Bag 11008, Palmerston North, 4442, New Zealand.
B New Zealand Agricultural Greenhouse Gas Research Centre, Grasslands Research Centre, Tennent Drive, Private Bag 11008, Palmerston North, 4442, New Zealand.
C Corresponding author. Email: harry.clark@nzagrc.org.nz
Animal Production Science 58(6) 973-979 https://doi.org/10.1071/AN15766
Submitted: 2 November 2015 Accepted: 4 May 2016 Published: 8 June 2016
Journal Compilation © CSIRO 2018 Open Access CC BY-NC-ND
Abstract
Enteric methane (CH4) emissions make up approximately one-third of all New Zealand’s carbon dioxide equivalent greenhouse gas emissions. In current national inventory calculations, fixed values are used to estimate emissions from sheep; 20.9 g CH4 per kg dry matter intake (DMI) for sheep <1 year old and 16.8 g CH4 per kg DMI for sheep >1 year old. These values have been principally derived from trials where intake was estimated, and CH4 emissions were measured indirectly using the sulfur hexafluoride tracer technique. Using New Zealand sheep data collected between 2009 and 2015, where intake was accurately measured and CH4 emissions were measured for a minimum of 48 h in respiration chambers (n = 817), updated sheep methane prediction algorithms suitable for use in the national greenhouse gas inventory were derived. A single equation for all sheep based on daily DMI (kg) alone (ln(g CH4/day) = 0.763 × ln(DMI) + 3.039) explained 76% of the variation in CH4 emissions. Splitting the dataset into two age classes (sheep <1 year old and sheep >1 year old) provided two alternative equations; (sheep >1 year old), ln(g CH4/day) = 0.765 × ln(DMI) + 3.09 and (sheep <1 year old), ln(g CH4/day) = 0.734 × ln(DMI) + 0.05(metabolisable energy) + 2.46. An analysis of concordance suggests that a better fit to the data is obtained by using a two-algorithm approach. The use of these updated algorithms in the national inventory resulted in small changes to estimated emissions both within and between years.
Additional keywords: dry matter intake, metabolisable energy, respiration chambers.
Introduction
Methane is an end product of the fermentation of ingested feed and the principal way to dispose of hydrogen from the gut of ruminant animals. Ruminants produce the largest amounts of methane (CH4) because all feed is fermented before absorption of nutrients. New Zealand’s ruminant-dominated agricultural sector is the largest source of greenhouse gas emissions, representing 48.4% of all CO2-equivalent emissions (MfE 2015). Enteric emissions from ruminants, predominately sheep and cattle, account for two-thirds of these agricultural greenhouse gas emissions. New Zealand is required, as an Annex 1 party to the United Nations Framework Convention on Climate Change, to report its emissions annually using guidelines outlined by the International Panel on Climate Change (IPCC 2006). It is important that enteric CH4 emissions from ruminant livestock are reported as accurately as possible. To estimate enteric CH4 emissions from sheep, New Zealand uses an IPCC Tier 2/3 approach, which comprises a detailed animal population, performance and feed characterisation, the estimation of dry matter intake (DMI) for each category of animal using the Australian Feeding Standards, and New Zealand developed emissions factors that relate CH4 emissions to DMI (e.g. CH4 yield (Ym) = 20.9 g CH4 per kg DMI). This country-specific methodology ensures that the unique features of New Zealand agriculture are taken into account when estimating emissions.
When estimating enteric CH4 emissions from sheep, two Ym values are used depending on sheep age; for sheep >1 year of age, the value is 20.9 g CH4 per kg DMI, and for sheep <1 year of age it is 20% lower at 16.8 g CH4 per kg DMI. These values were generated from an analysis of experiments conducted before 2004, with many of these experiments being with grazing animals where both the CH4 emissions and the DMI were estimated using indirect methods (Clark et al. 2003). Current IPCC recommendations (IPCC 2006) are to use different Ym values according to age (sheep <1 year of age, 4.5% of gross energy (GE) intake; sheep >1 year of age, 6.5% of GE intake), with these recommendations arising directly from data obtained in New Zealand. Expressed in the same units, the current New Zealand Ym values are 6.3% GE intake and 5.1% GE intake, respectively, for sheep >1 year old and sheep <1 year old.
To help develop more robust emission factors for sheep, a series of four experiments measuring emissions from old and young sheep fed pasture of differing quality at various feeding levels were undertaken between 2011 and 2013 (Muetzel and Clark 2015). Results from this series of experiments (510 measurements from 115 animals) demonstrated that DMI (kg/day) explained 80% of the variation in CH4 production per animal per day (pCH4, g/day) and if CH4 emissions were to be estimated using a single equation, it would be

Muetzel and Clark (2015) also found that diet quality and animal age in general had little to no effect on pCH4. However, assessing the effect of age on CH4 emissions was hindered by the narrow range of ages used in their experiments. Animals <1 year of age were covered very well in the study and when analysed as two separate data (<1 year and >1 year) sets, it emerged that for animals <1 year old including metabolisable energy (ME) content (MJ/kg DM) of the diet in addition to DMI, improved predictive ability (Eqns 2, 3), as follows:


The analysis of Muetzel and Clark (2015) was based on the analysis of four tailored experiments, but additional CH4 data from animals fed fresh-cut pasture in New Zealand were available to supplement their dataset. These additional data were collated and analysed in conjunction with the original dataset, with the aim of obtaining definitive CH4-prediction equations suitable for inclusion in the New Zealand national agricultural inventory.
Materials and methods
For inclusion in the additional dataset, the following two criteria were applied: (1) the diet had to comprise fresh grass-dominated pasture and (2) CH4 measurements had to be made in respirations chambers for a minimum of 48 h. This resulted in an additional 307 CH4 measurements from 289 animals collected from 14 different experiments conducted between 2009 and 2015. All measurements were conducted at the New Zealand Ruminant Methane Measurement Centre, Palmerston North. Data on ME were available only for 174 measurements from 174 sheep and, to remain consistent with the original dataset, the additional dataset was reduced to 174 animals when analysing the influence of variables other than DMI on CH4 emissions. If ME was found to have no significant effect, these discarded data were then reintroduced into the analysis.
Data from Muetzel and Clark (2015) named the ‘original’ and the newly collated data (named the ‘additional’ for ease of description) were first analysed using simple linear regression with pCH4 as the independent variable and DMI as the explanatory variable. The combined dataset was then analysed using a linear mixed effects model and the REML method of Genstat Version 13 (Payne et al. 2009), with the fixed effect of dataset and random effects including experiment, experiment × experimental period and experiment × sheep. When analysing the whole dataset, the response variables (pCH4) and the dominant explanatory covariate (DMI) needed to be transformed using natural logarithms, so as to de-trend the residuals, and linearise and stabilise variances.
When analysing the combined dataset, age was not used as an exploratory variable alongside other variables such as DMI, due to the very limited range of ages used in the trials, namely ranging from 0.3 to 3.0 years. An approach consistent with the analysis by Muetzel and Clark (2015) was taken, with data from young (<1 year old) and older (>1 year old) animals being analysed separately. Although this demarcation is arbitrary from a biological perspective, as it is highly unlikely that there is a sharp change in emissions at any particular age, it is in line with the New Zealand national inventory calculations where populations are characterised as <1 year of age or >1 year of age. This characterisation is also appropriate from an industry perspective, as up to 70% of lambs born are slaughtered at <1 year of age. It also allows direct comparison with current IPCC Tier 2 values.
To compare the algorithms obtained from the datasets against the actual pCH4 measurements, Lin’s concordance correlation coefficient was used. This coefficient measures how well a set of observations is able to reproduce an original set of measurements. Values of ±1 denote perfect concordance and discordance; a value of zero denotes a complete absence of concordance. A significant (P < 0.05) difference in concordances was declared if the confidence intervals did not overlap (Payne et al. 2009).
Results
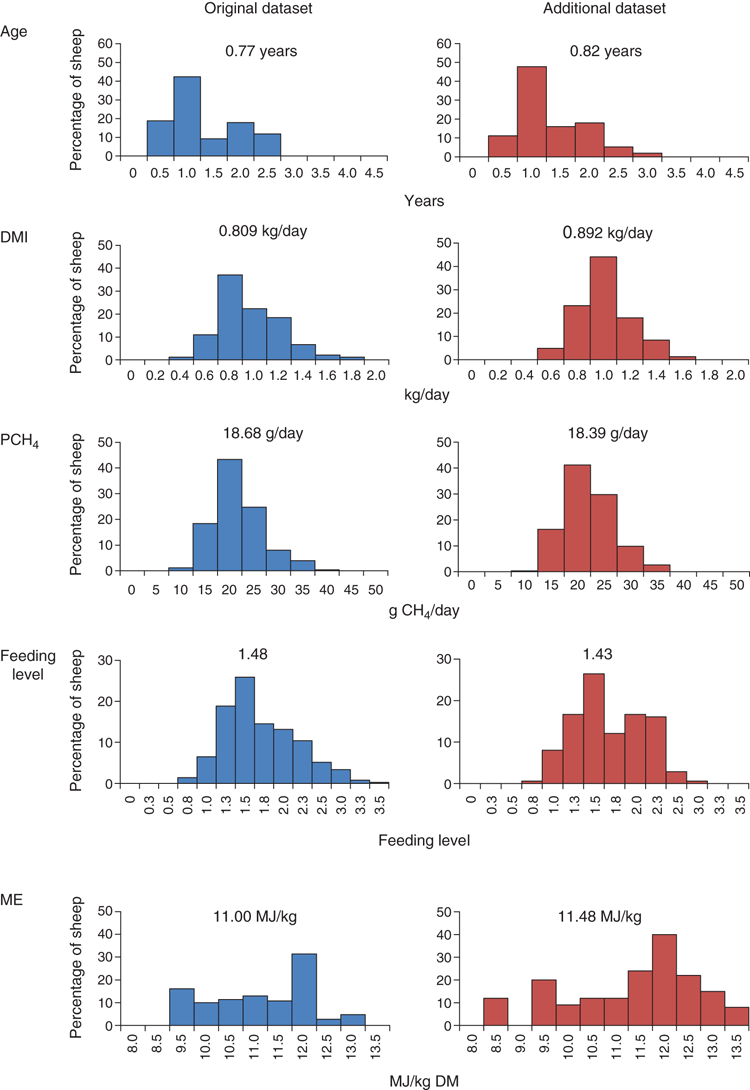
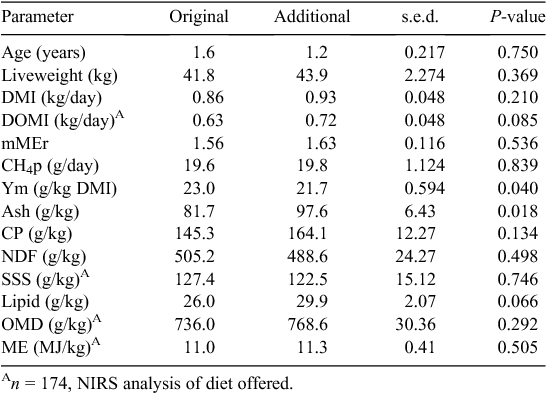
The first objective of the present study was to determine whether the two datasets, original and additional, differed. These data are presented in Fig. 1 and Table 1. Age structure and liveweight of animals in the two datasets were similar. Significant differences in diet composition between the datasets were limited to a higher ash content in the additional dataset (P = 0.018).
|
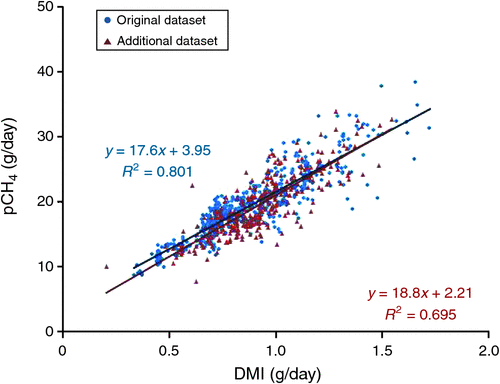
A simple linear regression between DMI and pCH4 (Fig. 2) showed that the additional dataset was more variable, with 69% of the pCH4 being explained by DMI, as compared with 80% in the original dataset. The additional dataset regression equation had a higher intercept (P = 0.016) than that of the original dataset regression equation, but the slopes of the two regression lines were similar (P = 0.129).
|
The combined dataset (n = 817) was analysed by REML analysis, with DMI as the sole explanatory variable for pCH4 (Eqn 4), as follows:

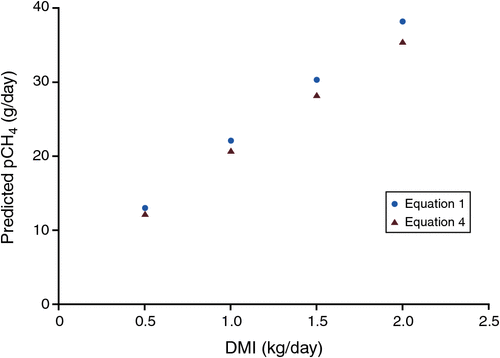
When analysed using REML, the inclusion of feed characteristics as additional explanatory variables (such as e.g. ME, digestibility, fibre content) did not significantly improve the relationship between pCH4 and DMI. Equation 4, which is obtained from an analysis of the combined dataset, has a slope and intercept similar to those of eqn 1 of Muetzel and Clark (2015). However, as the slope was numerically lower, predicted emissions were lower (Fig. 3), especially at higher levels of intake.
|
The analysis of the combined dataset indicated that age had a significant (P < 0.001) impact on the relationship between pCH4 and DMI, but the lack of sheep older than 2.5 years in the dataset precluded the use of age as a continuous explanatory variable. In sheep >1 year of age, dietary composition did not affect the relationship between pCH4 and DMI (P = 0.399) and therefore Eqn 5 (see below), which applies to sheep >1 year old, contains only DMI as an explanatory variable. In sheep <1 year old, the inclusion of ME content of the diet did improve (P < 0.001) the relationship between DMI and pCH4 (Eqn 6).


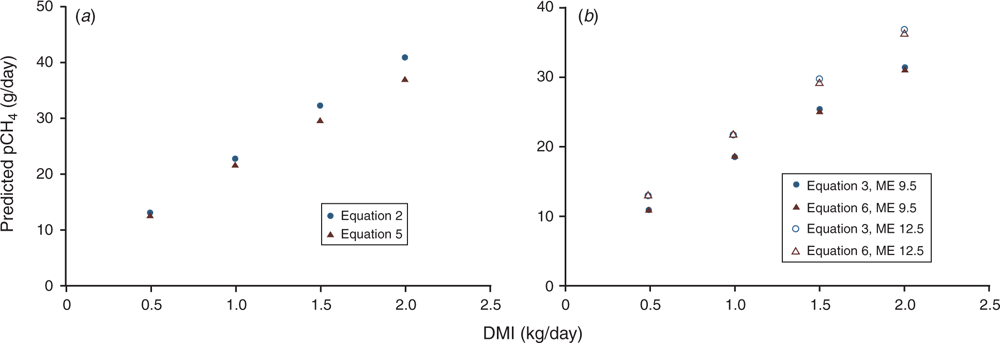
The updated equation for sheep >1 year old (Eqn 5), obtained from splitting the combined dataset by age, resulted in predicted CH4 emissions (Fig. 4a) being lower than in the corresponding equation obtained from the original dataset (Eqn 2), especially at high levels of intake. In contrast, Fig. 4b shows that predicted emissions for sheep <1 year old from the age-split combined dataset (Eqn 6) were almost identical to those obtained from the age-split original dataset (Eqn 3), irrespective of the ME concentration of the diet.
|
Discussion
The dataset obtained from the targeted experiments described by Muetzel and Clark (2015) and additional data sourced from other New Zealand experiments covered animals of a similar age, consuming feed with similar chemical characteristics. Intakes covered the same range and the same method was used to measure CH4 emissions. With the notable exception of the lack of sheep >3 years of age, these data were also considered to be representative of the New Zealand sheep population, both in terms of the range of intakes (combined dataset 0.4–1.8 kg/day; New Zealand national inventory range 0.4–2 kg) and herbage quality (combined dataset ME = 8.5–13.5 MJ/kg; New Zealand national inventory 9.6–11.4 MJ/kg). It was therefore deemed appropriate that these datasets could be combined and analysed as a single dataset. The combined dataset contained all current New Zealand data collected between 2009 and mid-2015 on CH4 emissions measured in respiration chambers from New Zealand sheep fed fresh grass-dominated diets where intake was accurately measured. An analysis of this database can, therefore, provide robust CH4-prediction algorithms for use in the New Zealand national agricultural CH4 inventory.
This analysis confirmed that for sheep fed fresh-cut pasture, DMI alone is a good predictor of CH4 emissions per animal and a single equation (Eqn 4) using DMI alone can be used to predict emissions. This relationship explains 76% of the variation in emissions, a value that is consistent with other published data (Blaxter and Clapperton 1965; Hammond et al. 2009, 2013; Reynolds et al. 2011). If a simple approach is required, i.e. one that does not need to take into account such factors as age and diet quality, the use of Eqn 4 can easily be justified for pasture-fed animals.
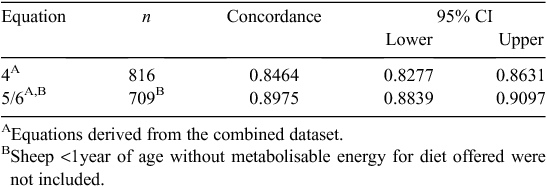
Although a single equation can be used for obtaining robust predictions of CH4 emissions from sheep in New Zealand, splitting the dataset by age resulted in separate prediction equations that provided a better fit to the data. One method for assessing the fit of a model to data is to use a concordance analysis. This is presented in Table 2. This analysis shows that Eqns 4–6 all have high predictive values (i.e. >0.8) for pCH4. However, the age-separated equations (Eqns 5, 6) show significantly higher concordance than does the single Eqn 4, which is based solely on intake. This concordance analysis along with the fact that our REML analyses showed that age had a significant effect on the relationship between DMI and Ym, and that there was an interaction between age and diet quality, indicated that the use of a single equation for all sheep using DMI as the explanatory variable is not appropriate if age and ME data are available. Since the New Zealand Tier 2/3 agricultural inventory methodology divides animals into age classes (<1 and >1 year old), and explicitly uses ME data for calculating DMI, it would therefore seem most appropriate to use the age-separated equations (Eqns 5, 6) in national inventory calculations.
|
The finding in these analyses that DMI is the major determinant of CH4 emissions is well supported in the literature (for a comprehensive review, see Hristov et al. 2013). The lack of a major effect of diet composition is perhaps somewhat more surprising, given that several authors have found that the inclusion of dietary variables can improve CH4 predictions (e.g. Ellis et al. 2007; Doreau et al. 2011; Hristov et al. 2013). However, the literature is in fact consistent with regard to the lack of any major influence of dietary quality on CH4 emissions from temperate grass-based diets (e.g. Molano and Clark 2008; Hammond et al. 2009, 2013; Hart et al. 2009; Jonker et al. 2015). A recent meta-analysis of cattle data in Australia to obtain an updated CH4-prediction algorithm for use in the Australian inventory (Charmley et al. 2016) also found that emissions could be predicted from DMI alone and that including diet quality did not significantly improve model fit. A possible explanation is that, in general, an increase in digestibility will result in an increases in Ym because more of the material is fermented, but to offset this, diets with improved digestibility tend to result in a decreased rumen pH which tends to reduce Ym (Van Kessel and Russell 1996; Lana et al. 1998); the net effect on Ym of increasing forage, therefore, is minor. If this hypothesis is correct, in sheep <1 year old the higher emissions from higher-quality material suggest that the increased availability of fermentable substrate dominates any negative pH effect.
Impact of the updated algorithms on predicted CH4 emissions
To quantify the impact that these new CH4 prediction equations have on estimated emissions from New Zealand sheep, emissions from adult ewes and growing lambs were estimated for the Years 1990 and 2012 by using the national agricultural inventory accounting software. The age-specific equations (Eqns 5, 6) were used separately to estimate emissions for ewes and lambs and (1) compared with emissions obtained using a single equation (Eqn 4) and (2) estimated obtained using the current Ym values of 20.9 g/kg DMI for ewes and 16.8 g/kg for lambs. Estimates of emissions were calculated per animal per year (Table 3), and annual emissions for ewes and lambs (Table 4) or all sheep combined (Table 5).

|

|

|
Emissions per animal per year
Using age-specific equations to predict the CH4 emissions had little effect on estimated annual emissions for sheep >1 year of age in 1990, but resulted in a 24.6% (3.46–4.31 kg CH4) increase above current emissions from sheep <1 year of age. The use of a single sheep equation in 1990 (Eqn 4) increased emissions from sheep <1 year of age by 40.4% (3.46–4.84 kg CH4) but reduced emissions from sheep >1 year of age by 5.5% (9.4–8.9 kg CH4). The trend for estimated emissions in 2012 was the same, with a small fall in emissions from sheep >1 year of age and a large rise in emissions from sheep <1 year of age. The finding that estimated emissions from sheep <1 year of age, using both Eqns 4 and 5, differs from the current national inventory calculations has implications both for New Zealand and for the current IPCC recommended Tier 2 Ym values. The current IPCC values were obtained from New Zealand data (IPCC 2006), but these were data where CH4 was measured less accurately and intake was estimated rather than measured. The current dataset overcomes these limitations and, although it does suggest that emissions from young animals are influenced by factors additional to DMI, the absolute difference in emissions between sheep <1 year of age and sheep >1 year of age for a given level of intake are much lower than previously indicated. For example, at an intake of 1 kg DM/day, estimated daily emissions for sheep >1 of age using the current IPCC value of 6.5% are 21.6 g and 22 g using Eqn 5, while those for sheep <1 of age are 15 g/day using the current IPCC value of 4.5% of GE and 20.3 g/day using Eqn 6 with an ME value of 11. This strongly suggests that the current IPCC Ym value for sheep <1 of age needs reviewing.
National emissions
The impact of the new equations on total CH4 emissions from the New Zealand sheep sector followed a trend similar to that of the annual emissions per head (Tables 4, 5).
In 1990, emissions from sheep >1 year of age were reduced by 0–5.3%, and by 4.3–9.1% in 2012, using either the age-specific or single equation, respectively, when compared with the current method. In contrast, in 1990, predicted emissions from sheep <1 year of age were noticeably higher (20.0–36.7%) than those estimated using the current method, although in 2012 this increase was smaller, being 10.8–28.2% using the age-specific or single equations respectively. The smaller increase in 2012 is a reflection of the fact that the size of lambs in New Zealand has increased by ~30% since 1990 (MfE 2015), meaning that intake per animal is higher and when using a regression equation that does not go through the origin, emissions per unit of intake go down.
The use of a single equation for all sheep made little difference to the total combined ewe and lamb emissions in 1990 compared with the current estimate, while total emissions were 2.5% higher when using the age-specific equations (Table 5). However, in 2012, the total combined ewe and lamb emissions decreased by just over 1% using either equations, compared with the current estimated value. As both the single and age-related equations derived from the datasets analysed result in slightly higher estimated emissions in 1990 but slightly lower estimated emissions in 2012 than the current values, the fall in emissions over time is estimated to be 7000–15 000 t CH4/annum greater.
The adoption of either a new single equation or two new separate age-related equations to estimate total emissions from the New Zealand sheep sector makes a small difference to total estimated emissions in 1990 and 2012 and, on the basis of these two years, to the change in emissions over time. This is primarily because the estimated increase in emissions from sheep <1 year of age is offset by a decrease in estimated emissions from sheep >1 year of age. The advantage of the using the updated equations derived from the analyses presented here are that they better represent Ym values obtained from a wide range of New Zealand experiments and that they are better able to capture the underlying biological relationships, such as, for example, the negative relationship between increasing DMI and decreasing CH4 per kg of DMI first shown by Blaxter and Clapperton (1965) and the newly found relationships in young sheep between DMI, herbage quality and Ym. This, in turn, will allow the New Zealand inventory methodology to better reflect improvements in animal performance and the higher levels of feed intake found in New Zealand sheep over this time period (MfE 2015); since 1990, New Zealand sheep have become larger, more prolific and, hence, have a greater daily DMI; however, any reduction in Ym has not been previously captured because a constant value was used for all years. The updated algorithms, therefore, have an influence both within and between years, which has implications for changes in emissions against a fixed baseline such as 1990.
A weakness in the current New Zealand dataset is that it contains almost no data on animals >3 years of age. This makes it difficult to fully examine the influence of age on emissions. The categorisation of animals into <1 and >1 year of age, while sensible from an inventory perspective, is difficult to justify biologically and more data are needed from older animals so that a more comprehensive understanding can be obtained.
Conclusions
The sourcing of additional data from experiments measuring CH4 emissions in New Zealand to add to those analysed by Muetzel and Clark (2015) confirmed that the relationship between pCH4 and DMI was influenced by the ME of the diet for sheep <1 year of age, but not for sheep >1 year of age. The concordance of pCH4 was high both for a single-sheep equation and separated age-related equations but the separation of sheep by age significantly improved the concordance between predicted and measured emissions. We recommend that the two age-related equations obtained from the combined dataset should be adopted for use in the New Zealand national sheep industry as they are sourced from New Zealand measurements, are undertaken across a broad range of herbage quality, and from situations in which both intake and CH4 emissions were measured accurately. With regard to the effects of age on emissions, the available data do not span the full range of ages found in practice and, hence, no attempt was made to treat age as a continuous variable in the analysis. Biologically, it is difficult to envisage a sharp cut off point at which emissions begin to diverge but data limitations preclude any more detailed analysis.
References
Blaxter KL, Clapperton JL (1965) Prediction of the amount of methane produced by ruminants. British Journal of Nutrition 19, 511–522.| Prediction of the amount of methane produced by ruminants.Crossref | GoogleScholarGoogle Scholar | 1:CAS:528:DyaF28XitFKktg%3D%3D&md5=6cde6902b771bbb1af70db2dca0760aaCAS | 5852118PubMed |
Charmley E, Williams SRO, Moate PJ, Hegarty RS, Herd RM, Oddy VH, Reyenga P, Staunton KM, Anderson A, Hannah MC (2016) A universal equation to predict methane production of forage-fed cattle in Australia. Animal Production Science 56, 169–180.
| A universal equation to predict methane production of forage-fed cattle in Australia.Crossref | GoogleScholarGoogle Scholar | 1:CAS:528:DC%2BC28Xis1amu70%3D&md5=d1eb2b764dd6396af5b37141ae7a2b3dCAS |
Clark H, Brookes I, Walcroft A (2003) Enteric methane emissions from New Zealand ruminants 1990–2001 calculated using an IPCC Tier 2 approach. Report prepared for the Ministry of Agriculture and Forestry (March 2003). Ministry of Agriculture and Forestry, Wellington, New Zealand.
Doreau M, van der Werf HMG, Micol D, Dubroeucq H, Agabriel J, Rochette Y, Martin C (2011) Enteric methane production and greenhouse gases balance of diets differing in concentrate in the fattening phase of a beef production system. Journal of Animal Science 89, 2518–2528.
| Enteric methane production and greenhouse gases balance of diets differing in concentrate in the fattening phase of a beef production system.Crossref | GoogleScholarGoogle Scholar | 1:CAS:528:DC%2BC3MXps12jtrw%3D&md5=6abb9bf4c85a0c8e26af3786f3c1ab36CAS | 21383032PubMed |
Ellis JL, Kebreab E, Odongo NE, McBride BW, Okine EK, France J (2007) Prediction of methane production from dairy and beef cattle. Journal of Dairy Science 90, 3456–3466.
| Prediction of methane production from dairy and beef cattle.Crossref | GoogleScholarGoogle Scholar | 1:CAS:528:DC%2BD2sXntlCksLY%3D&md5=566e93a0ba92e8c0af29a08f3fa90fecCAS | 17582129PubMed |
Hammond KJ, Muetzel S, Waghorn GC, Pinares-Patino CS, Burke JL, Hoskin SO (2009) The variation in methane emissions from sheep and cattle is not explained by the chemical composition of ryegrass. Proceedings of the New Zealand Society of Animal Production 69, 174–178.
Hammond KJ, Burke JL, Koolaard JP, Muetzel S, Pinares-Patiño CS, Waghorn GC (2013) Effects of feed intake on enteric methane emissions from sheep fed fresh white clover (Trifolium repens) and perennial ryegrass (Lolium perenne) forages. Animal Feed Science and Technology 179, 121–132.
| Effects of feed intake on enteric methane emissions from sheep fed fresh white clover (Trifolium repens) and perennial ryegrass (Lolium perenne) forages.Crossref | GoogleScholarGoogle Scholar | 1:CAS:528:DC%2BC38XhvVCktbnF&md5=dcc40fc0623a5c992b3c9ca2e77af35bCAS |
Hart KJ, Martin PG, Foley PA, Kenny DA, Boland TM (2009) Effect of sward dry matter digestibility on methane production, ruminal fermentation, and microbial populations of zero-grazed beef cattle. Journal of Animal Science 87, 3342–3350.
| Effect of sward dry matter digestibility on methane production, ruminal fermentation, and microbial populations of zero-grazed beef cattle.Crossref | GoogleScholarGoogle Scholar | 1:CAS:528:DC%2BD1MXht1WksLzF&md5=a4deae2d10e184f2077e3187c4a6c70eCAS | 19542500PubMed |
Hristov AN, Oh J, Lee C, Meinen R, Montes F, Ott T, Firkins J, Rotz A, Dell C, Adesogan A, Yang W, Tricarico J, Kebreab E, Waghorn G, Dijkstra J, Oosting S (2013) Mitigation of greenhouse gas emissions in livestock production – a review of technical options for non-CO2 emissions. (Eds PJ Gerber, B Henderson, HPS Makkar) FAO animal production and health paper no. 177. (FAO: Rome, Italy)
IPCC (2006) ‘2006 IPCC guidelines for national greenhouse gas inventories. Volume 4. Agriculture, forestry and other land use.’ Chapter 10. (Eds HS Eggleston, L Buendia, K Miwa, T Ngara, K Tanabe) pp. 1–68. (Institute for Global Environmental Strategies: Kanagawa, Japan)
Jonker A, Muetzel S, Molano G, Pacheco D (2015) Effect of fresh pasture forage quality, feeding level and supplementation on methane emissions from growing beef cattle. Animal Production Science
| Effect of fresh pasture forage quality, feeding level and supplementation on methane emissions from growing beef cattle.Crossref | GoogleScholarGoogle Scholar |
Lana RP, Russell JB, Vanamburgh ME (1998) The role of pH in regulating ruminal methane and ammonia production. Journal of Animal Science 76, 2190–2196.
MfE (2015) New Zealand’s greenhouse gas inventory 1990–2013. Available at http://www.mfe.govt.nz/publications/climate-change/new-zealands-greenhouse-gas-inventory-1990-2013 [Verified 19 May 2016]
Molano G, Clark H (2008) The effect of level of intake and forage quality on methane production by sheep. Australian Journal of Experimental Agriculture 48, 219–222.
| The effect of level of intake and forage quality on methane production by sheep.Crossref | GoogleScholarGoogle Scholar | 1:CAS:528:DC%2BD1cXovVyn&md5=c9cac3c054bdeddd25f22b114357e04dCAS |
Muetzel S, Clark H (2015) Methane emissions from sheep fed fresh pasture. New Zealand Journal of Agricultural Research 58, 472–489.
| Methane emissions from sheep fed fresh pasture.Crossref | GoogleScholarGoogle Scholar | 1:CAS:528:DC%2BC2MXhvFKks7bP&md5=7eda8b5b6a30966bf11cda68efc45988CAS |
Payne RW, Murray DA, Harding SA, Baird DB, Soutar DM (2009) ‘Genstat for Windows. Introduction.’ 13th edn. (VSN International: Hemel, Hempstead, UK)
Reynolds CK, Crompton LA, Mills JAN (2011) Improving the efficiency of energy utilisation in cattle. Animal Production Science 51, 6–12.
| Improving the efficiency of energy utilisation in cattle.Crossref | GoogleScholarGoogle Scholar |
Van Kessel JA, Russell JB (1996) The effect of pH on ruminal methanogenesis. FEMS Microbiology Ecology 20, 205–210.
| The effect of pH on ruminal methanogenesis.Crossref | GoogleScholarGoogle Scholar | 1:CAS:528:DyaK28XkslGiur4%3D&md5=98d6165300bb1728873629b1d1b6bfb8CAS |


