

What lies beneath – a review of frontier exploration for deep plays in the Bowen Basin
Raymond L. Johnson Jr A * and Nathan Parker BA The University of Queensland, Centre for Natural Gas, Brisbane, Qld, Australia.
B Origin Energy, Brisbane, Qld, Australia.
The APPEA Journal 63 173-189 https://doi.org/10.1071/AJ22197
Submitted: 23 January 2023 Accepted: 21 February 2023 Published: 11 May 2023
© 2023 The Author(s) (or their employer(s)). Published by CSIRO Publishing on behalf of APPEA. This is an open access article distributed under the Creative Commons Attribution-NonCommercial-NoDerivatives 4.0 International License (CC BY-NC-ND)
Abstract
Recent coal seam gas to liquefied natural gas developments have revitalised the Bowen and Surat basins and provided the impetus to explore further for plays with sufficient scale to target both export and domestic markets. Over the last decade, several wells were drilled through Permian-age sediments in the southern Bowen Basin and stimulated to assess the commerciality of various tight gas formations. Thorough data collection included log, core, injection testing, and observations from hydraulic fracturing operations and diagnostics. These data validated the play while providing a picture of the reservoir and in-situ stress conditions; however, challenges exist that will require further wells and studies. We will summarise and highlight the key data collected, review the fracture treatments that were largely ineffective and discuss the implications for further developments in these low-permeability, tight gas targets.
Keywords: Bowen Basin, deep coals, DFIT, fracture diagnostics, fracture stimulation, geomechanics, pore pressure, tight gas.
Introduction
The Bowen Basin is a Permo–Triassic foreland basin covering some 160 000 km2 across eastern Queensland and northern New South Wales (Queensland Department of Mines Energy 1997; Cadman et al. 1998). It contains conventional and unconventional hydrocarbon fields and discoveries, with production dominated by coal seam gas (CSG) from Permian coals. In the south, it is covered by the Jurassic–Cretaceous Surat Basin, which contains world-class CSG fields and a number of small oil fields. A detailed review of the basin evolution of the Bowen Basin is beyond the scope of this paper, and details can be found in the literature (Fielding et al. 2001; Brakel et al. 2009).
Exploration in the western side of Bowen Basin commenced in 1901 with the discovery of gas at Hospital Hill in Roma, and over the next 60 years, only 60 wells were drilled. Cabawin 1 was the first well drilled into the deepest part of the Bowen Basin, the Taroom Trough, and proved the presence of a working petroleum system (oil and gas discovery) in the Permian section of the Taroom Trough. It was the first in a series of deep stratigraphic tests across the Bowen Basin. Despite extensive hydrocarbon shows and tantalising test results, the deep exploration efforts largely resulted in tight gas reservoir discoveries, which in the 1960s were unable to be commercialised due to a lack of market and technological means of economic recovery.
With the discovery of oil in shallower reservoirs, and later with the evolution of CSG, deep gas exploration in the Bowen Basin slowed with only 38 petroleum wells drilled to depths of >3000 m, 25% being drilled since 2010. From 2011 to 2015, the Queensland Gas Company Pty Ltd (QGC) drilled seven wells dedicated to testing the tight gas sand prospectivity of the Taroom Trough. While the wells all confirmed essential tight gas sand play elements (i.e. reservoir presence, charge, pervasive gas shows independent of mappable traps, abnormal pressures), ultimately the test results proved sub-commercial because of challenges that will be discussed.
Well results
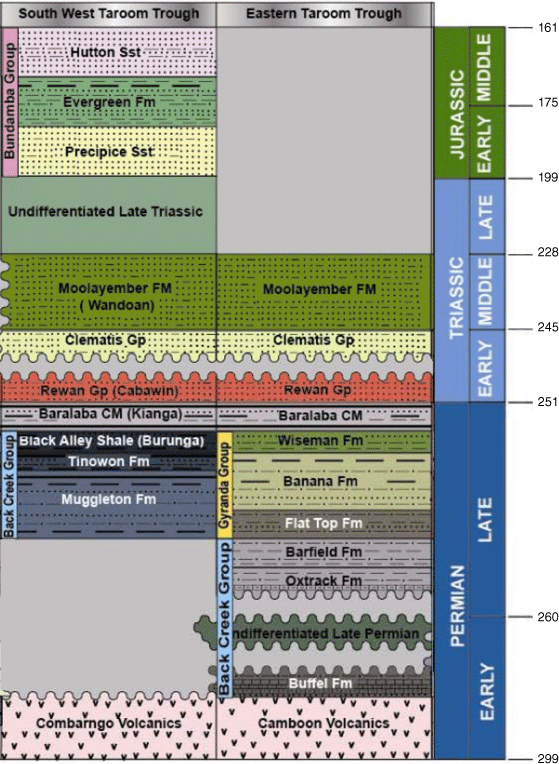
In the period 2011–2015, seven QGC wells were drilled (Table 1) to understand the tight gas sand prospectivity of three main targets that showed encouraging indications in earlier deep well drilling around the flanks of the Taroom Trough (Fig. 1): the Early–Mid Permian Back Creek Group, the Late Permian Kianga Formation and the Triassic Rewan Group (Fig. 2). In this paper, the stratigraphy documented in the open-file post-well data has been honoured, although the authors do acknowledge the potential for alternative stratigraphic correlations.
| Well | Drilled | Primary objective | Secondary objective | Total depth (m, measured depth) | Test interval | Test duration (days) | Cumulative test volume (MMCF) |
| Moa 1 | 2011 | Rewan Group | Clematis Sandstone | 3750 | Rewan Group | n/aA | n/a |
| Daydream 1 | 2011 | Kianga Fm/Back Creek Group | Rewan Group | 4140 | Back Creek Group | 30 | 0.106 |
| Fantome 1 | 2012 | Rewan Group | Kianga Formation | 4694B | Kianga/Back Creek Group | 70 | 5.014 |
| Tasmania 1 | 2012 | Kianga Fm/Back Creek Group | Rewan Group | 4623 | Kianga/Back Creek Group | 84 | 0.212 |
| Dunk 1 | 2014 | Back Creek Group | Kianga Formation | 3180 | Kianga/Back Creek Group | 30 | 17.06 |
| Moa 2 | 2015 | Rewan Group | – | 4400 | n/aC | n/a | n/a |
| Magnetic 1 | 2015 | Back Creek Group | Kianga Formation | 3095 | n/aD | n/a | n/a |
ACement bond log indicated inadequate cement bond on the production casing for fracture stimulation.
BFantome 1 remains the deepest well in Queensland at the time of writing.
CNo fracture stimulation, although well completion report states cemented production liner was run and frac valves were installed on the wellhead.
DWell completion report states well were suspended for future fracture stimulation.
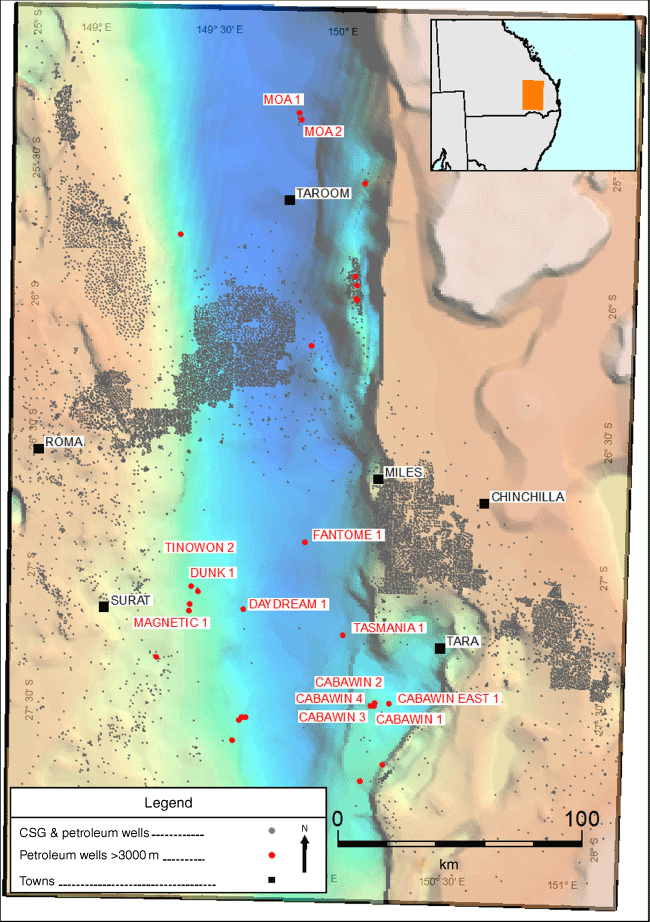
OZ SEEBASE® 2021 map showing modelled depth to basement over the southern Bowen Basin. The Taroom Trough is the north–south oriented trough in the centre of the image. All CSG and petroleum wells are shown, with wells >3000 m coloured red, and those wells referenced in this paper are annotated.
Generalised stratigraphic column for the Bowen and Surat basins in the Taroom Trough (QGC Pty Limited 2015).
Back Creek Group (sandstones)
The Back Creek Group represents the earliest phase of sedimentary deposition in the Bowen Basin, deposited in marine to marginal-marine depositional environments, gradually shallowing into the fluvial-dominated Kianga Formation. Gas shows were seen in sandstones (generally lithic arkose to feldspathic litharenites), siltstones and coal beds. The sandstones in the Back Creek Group typically have complex petrological compositions dominated by volcanic and lithic grains, reflecting varied orogenic and volcanic sediment provenance sources. Three main reservoirs in the interval were targeted by the QGC wells: the Lorelle Sandstone, Overston Sandstone and Tinowon Formation. These were developed in the wells drilled on the western flank of the Taroom Trough (Daydream 1, Dunk 1 and Magnetic 1), with Tasmania 1 and Fantome 1 penetrating deeper marine sediments with little sand development and predominantly comprising mudstone, marl and limestone.
The Back Creek Group reservoir with the most potential is the Tinowon Formation, which in Dunk 1, is 30 m thick with ambient porosity ranging from 1.8% to 13.1%, permeability from 0.004 to 0.17 mD and is bounded between two thick coal seams. Further updip, the Tinowon Formation has long been a conventional target in the shallower conventional fields on the Roma Shelf (e.g. Myall Creek). The Lorelle Sandstone in the Magnetic 1 core was largely conglomeratic with limited reservoir potential; however, in Dunk 1 and Daydream 1, the micro resistivity image log signature in the correlatable intervals does not indicate conglomerate. The Overston Sandstone appears as a thin reservoir (<10 m), areally limited in terms of deposition, and is only encountered in the Dunk 1 well and the nearby Overston well drilled in the early 2000s.
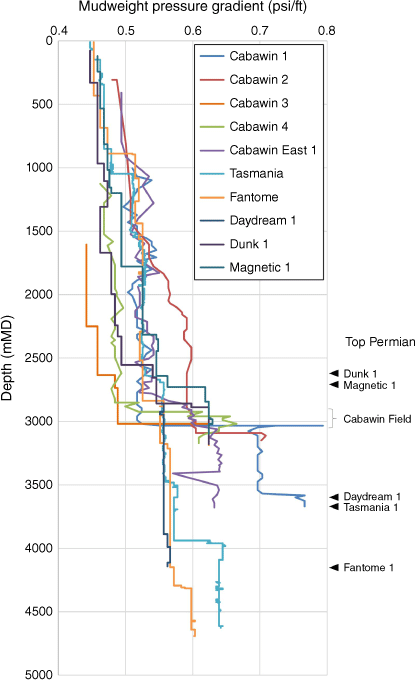
Three of the QGC wells were completed in the Back Creek Group: Daydream 1 (the first well completed), Fantome 1 (one stage) and Dunk 1 (the last well completed). Daydream 1 completed the Tinowon Formation and Lorelle Sandstone intervals, whereas Dunk 1 completed six zones from the Lorelle Sandstone through to the basal Kianga Formation. In drilling the Back Creek Group, no indications of underbalanced drilling conditions were observed, with mud weights equivalent to pressure gradients of 0.64 psi/ft in Tasmania 1, 0.60 psi/ft in Fantome 1, 0.56 psi/ft in Daydream and up to 0.63 psi/ft in Dunk 1 and Magnetic 1.
Kianga Formation (sandstones)
The Kianga Formation conformably overlies the Back Creek Group and was completed in both Fantome 1 and Tasmania 1. A thick sequence of interbedded coals, litharenite to lithic arkose sandstones, siltstones and tuffs were penetrated with significant mud gas shows through the section, with highest gas shows correlating to coal-bearing intervals. The sandstones in the Kianga Formation are similar to the Back Creek Group in having a complex petrological composition dominated by volcanic and lithic grains.
Compared to the flanks of the Taroom Trough, the Kianga Formation isopach is thicker in the centre of the trough, and individual bed thicknesses increase with sandstone beds up to 5 m and coal seam thicknesses up to 2 m. The only core acquired in the Kianga Formation from the QGC wells was in Tasmania 1, where 19 m of the core was acquired, extending into the top of the underlying Back Creek Group. A comprehensive rotary sidewall program was also acquired across several QGC wells. The ambient porosity and permeability range of the sandstones in the cored interval in Tasmania 1 was 2.6%–12.7% and 0.0007–0.024 mD, respectively.
The Kianga Formation was the interval in which the Cabawin 1 well encountered hydrocarbons and took a kick that provided the first evidence of overpressure in the Permian section of the Bowen Basin. No evidence of underbalanced drilling was observed in Fantome 1 and Tasmania 1 in the Kianga Formation, with mud weights equivalent to pressure gradients of 0.6 and 0.57 psi/ft respectively.
Kianga Formation and Back Creek Group (deep coals)
The Kianga Formation, and to a lesser extent the Back Creek Group, have substantial coal development. The Kianga Formation is age equivalent to the coals mined in the northern Bowen Basin and the reservoirs for CSG fields, such as Spring Gully and Fairview. Gas shows were observed while drilling through these coals in all of the QGC wells and the Cabawin wells (as was the case in almost all wells that penetrate these intervals) in the basin. These coals could be targeted with stimulations in addition to tight gas sandstone targets to access additional resources.
In the Bowen Basin, the oil/condensate window for Permian coals is 0.65 < Ro% < 1.05, and the gas window is 1.05 < Ro% < 1.4 (Boreham et al. 1999). In Cabawin 1, the vitrinite reflectance in the coals ranges from 0.65% to 1.29% with an average maturity of 0.83%. In the QGC wells drilled in the deeper parts of the Taroom Trough, maturities range from 0.99% to 1.76% with the highest maturities in Fantome 1, consistent with its location in the deepest part of the southern Taroom Trough. This difference in maturity explains the presence of oil in the Kianga Formation ‘A’ Sand in Cabawin 1 and the QGC wells being predominantly gas wells, albeit with condensate also recovered (QGC Pty Limited 2016).
Maceral analysis was undertaken on coals from Daydream 1, Fantome 1 and Tasmania 1. In general, the samples are dominated by vitrinite, contained up to 30% inertinite with very little liptinite, with higher inertinite content in Daydream 1 compared to the wells in the deeper parts of the Taroom Trough. Proximate and ultimate analyses were undertaken on samples from Tasmania 1, indicating ash contents greater than 50% and up to 95% in some samples. The high ash content, visual description of grey and dull coal in samples, as well as density often not less than 1.6 g/cc suggests impurity in some of the interpreted coals; they could in fact be more correctly termed carbonaceous mudstones. It is worth bearing in mind that these analyses utilised sidewall core and cuttings and samples collected and may not be totally representative of all coals in these intervals.
Rewan Group
The Rewan Group unconformably overlies the Kianga Formation. In the QGC wells, the character of the Rewan Group was similar to that observed in wells around the flank of the Taroom Trough, albeit thicker. The interval comprises interbedded fluvial lithic sandstone (predominantly litharenite and feldspathic litharenite) and siltstone with ambient core and rotary sidewall core porosity was in the range of 1%–16% and permeability values from 0.0009 to 23.9 mD. Petrographical analysis of core samples from Moa 2 were commonly over 40% and up to 60% clay content; micro-porosity is the primary pore type and is dominated by chlorite.
The sandstones in the Rewan Group were deposited at the peak of the Hunter-Bowen Orogenic activity and have similarly complex petrology to the Permian intervals. Pervasive gas shows were observed in sands of the Rewan Group during the drilling of the Moa 1 and Moa 2 wells in the northern Taroom Trough, whereas no material gas shows were observed during the drilling of the five wells in the southern Taroom Trough. No well testing was undertaken in the Rewan Group in any of the QGC wells.
Pore pressure in the Permian of the Taroom Trough
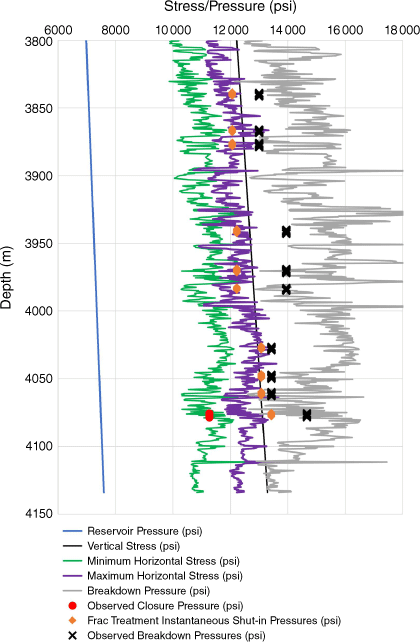
As outlined above, the QGC wells provided ample evidence from drilling and data acquisition to confirm most key tight gas play elements. However, one element that has not been directly confirmed is the degree of overpressure, an important control on well performance. Additionally, permeability, natural fractures, type of petroleum fluids and frac barriers can be other key determinants for success in an unconventional reservoir development (Jenkins and McLane 2019). No indication of drilling underbalanced in the Permian interval was observed in any of the five QGC wells in the southern Taroom Trough, with mud weights equivalent to 0.56–0.64 psi/ft pressure gradients (Fig. 3).
The first evidence of high reservoir pressures in the Permian section was in the Cabawin 1 well, drilled on a structural closure adjoining the Taroom Trough (Fig. 1). While drilling the uppermost Kianga Formation ‘A’ Sand at 9938 ft with 75 lb/ft3 (10 ppg, 0.52 psi/ft) density mud in the hole, circulation was broken in preparation to pull out of the hole to run wireline logs. After a short period, an increase in mud pit volumes was seen and the Cabawin 1 well completion report noted a ‘strong blow of gas and mud, blowing the Kelly bushing, and table bushings out of the rotary table’. After a number of days, the blowout was controlled by killing the well with 95 lb/ft3 (12.7 ppg, 0.66 psi/ft) density mud.
Upon drilling onto 9952 ft, further well control issues were encountered, requiring up to 115 lb/ft3 (15.4 ppg, 0.79 psi/ft) density mud to control. Once under control, the well was able to be drilled with a 100 lb/ft3 (13.5 ppg, 0.70 psi/ft) mud until entering the Camboon Volcanics (typically considered basement) where mud weight was raised to 111 lb/ft3 (14.9 ppg, 0.77 psi/ft) because of increasing gas cut mud. On 10 August 1961, following perforating, a production test and shut-in pressure were obtained. A bottomhole flowing gradient of ~0.2 psi/ft was observed at 9934 ft with mid-point perforations at 10 027 ft. The final bottomhole build-up pressure was 5800 psi, equating to a bottomhole pressure gradient of ~0.58 psi/ft at mid-point perforations. These data constrain pore pressure in the top of the Kianga Formation between 0.52 and 0.66 psi/ft; although when accounting for a margin and gas influx, the actual pressures are <0.66 psi/ft.
Cabawin 2–4 were drilled to appraise the extent of the structure and appraise the Kianga Formation discovery from Cabawin 1. In Cabawin 2, the subsequently perforated Kianga interval 10 126–10 143 ft was drilled with 13.4 ppg (0.78 psi/ft) without note of any gas incidence. A subsequent drill stem test (DST) showed 1860 ft of oil gassy muddy water and gassy mud and a final shut-in pressure of 5490 psi, or a 0.54 psi/ft gradient. Subsequent drilling in Cabawin 3 was achieved with good control and gas shows to 9300 ft, predominantly in coals, using a 9.5 ppg mud. Three DSTs were performed at average depths of 6700, 7482 and 10 165 ft, experiencing packer failure, no recovery, or a weak flow and slightly gas cut mud, respectively. Cabawin 4 was drilled to appraise the extent of the structure and a DST of the interval 9947–9975 ft and showed gas rates stabilising at 400 MCFD and formation pressures in what was interpreted as the ‘A’ Sand were around 5000–5100 psi or <0.52 psi/ft gradient.
Note that the ‘A’ Sand, which required the highest mud densities to control, was either not developed or poorly developed in the subsequent wells on the Cabawin structure. There is also significant uncertainty in correlating individual beds between the Cabawin wells. Given the vastly different pressure control requirements while drilling Cabawin 1 compared to the later wells, it is considered likely that the ‘A’ Sand in Cabawin 1 represents a stratigraphically isolated sandstone that is anomalously overpressured compared to the Kianga Formation and Back Creek Group, regionally. Therefore, based on drilling and well test evidence to date from the wells drilled into the deepest part of the southern Taroom Trough, the authors find little evidence to support regional reservoir pressure gradients substantially greater than 0.60 psi/ft.
Fracture stimulation and DFIT review
Accurate profiling of stress and reservoir pressure is essential in tight gas stimulation, is essential to pressure-history match treatments, determines fracture effectiveness (Holditch et al. 1988; Robinson et al. 1991, 1992; Saunders et al. 1992) and is essential in areas with fracture complexity or compressive stress conditions (Johnson et al. 1998, 2015; Johnson and Greenstreet 2003). Diagnostic fracture injection test (DFIT) data are recommended and were acquired in the QGC wells to estimate pore pressure in the deepest parts of the basin and improve the understanding of how potential overpressure might be distributed across the Taroom Trough. Unfortunately, most DFIT treatments were of too large a volume, relative to the low permeability of the intervals, resulting in very lengthy shut-ins to achieve pseudo-radial flow. Further, perforation locations selected for DFIT were not in the lowest stressed intervals within the intervals; thus, fracture propagation away from the intervals, multiple closures and excessive linear flow signatures were observed. Two wells, one in the Back Creek and another in the Kianga, will be used to illustrate the uncertainty arising from the DFIT. Thereafter, fracture stimulation pressure history matches of both DFIT and fracture stimulation treatments were used to better constrain the 1D stress profile and the likely maximum extent of any over-pressure in these wells.
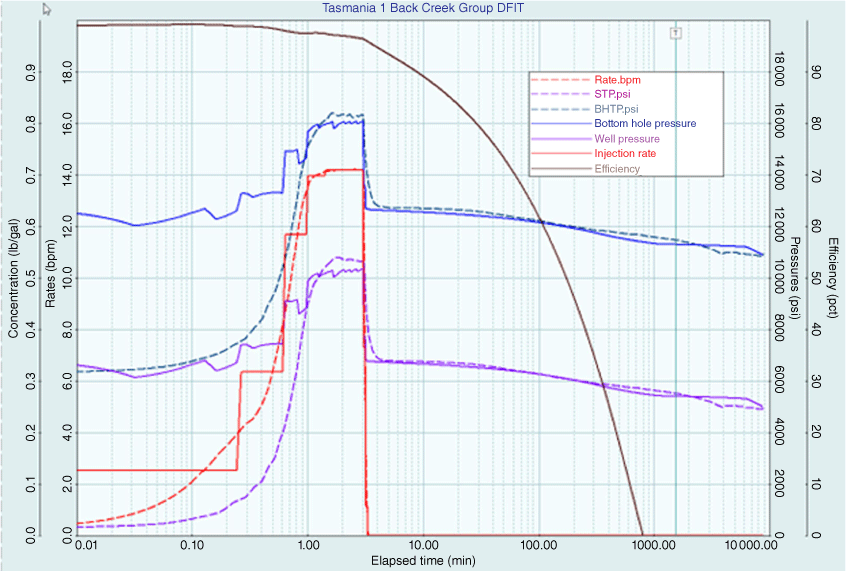
Kianga Formation – Tasmania 1
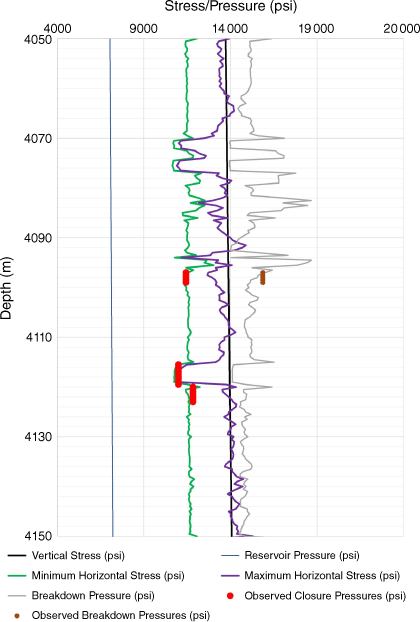
Tasmania 1 intersected the Kianga Formation and Back Creek Group with planned stimulations in both intervals using plug and perforation operations. A DFIT was performed on the lowermost perforation set of the Back Creek Stage 1 perforations, then shut-in for 150 h. Analysis of the DFIT data indicated that multiple closure events were present above and below the field-derived closure. Using the DFIT, other observed stress data and a pressure gradient of 0.53 psi/ft (average from Cabawin 2 to 4), a 1D stress profile could be constructed and indicated normal to strike-slip stress conditions in the clastic sections and a normal, nearly isotropic stress condition in the coals (Fig. 4). This stress profile was successfully history matched to observed early-time DFIT pressures in a planar-3D fracturing simulator (Barree 1983); thereafter, the permeability model could be matched to the observed pressures in the extended shut-in period for that DFIT (Fig. 5). Note the efficiency of the treated water DFIT had a fracture efficiency of >90%, indicating extremely low leak off and a permeability of <0.1 mD. This permeability range is consistently 10–10 000 times less than observed laboratory measurements, being measured with Helium at ambient conditions, and neglecting in-situ stress and multi-phase permeability effects (Shanley et al. 2004).
The 1D stress profile developed for Tasmania 1 based on a 0.53 psi/ft reservoir gradient and calibrated by DFIT and mini-frac data.
Tasmania 1 Back Creek Group DFIT STP, calculated BHTP and extended leak off pressure-history match (including the after-closure period) for Tasmania 1 using the stress profile based on a 0.53 psi/ft reservoir gradient.
This type of stress profile is not inconsistent with other Permian intervals in other Australian basins and poses a problem in placing stimulation treatments effectively in the higher-stressed sandstone sequences interbedded with lower-stressed coals (Johnson and Greenstreet 2003; Pitkin et al. 2012; Scott et al. 2013; Johnson et al. 2015, 2016, 2019a, 2019b; Johnson 2018b). In Tasmania 1, this stress state was not a contributing factor in the ineffective stimulation of the Kianga Formation, as there was an adequate standoff between the targeted sands and Kianga coals. In fact, deep coals of the Taroom Trough were not specifically targeted by the stimulation treatments in the QGC program.
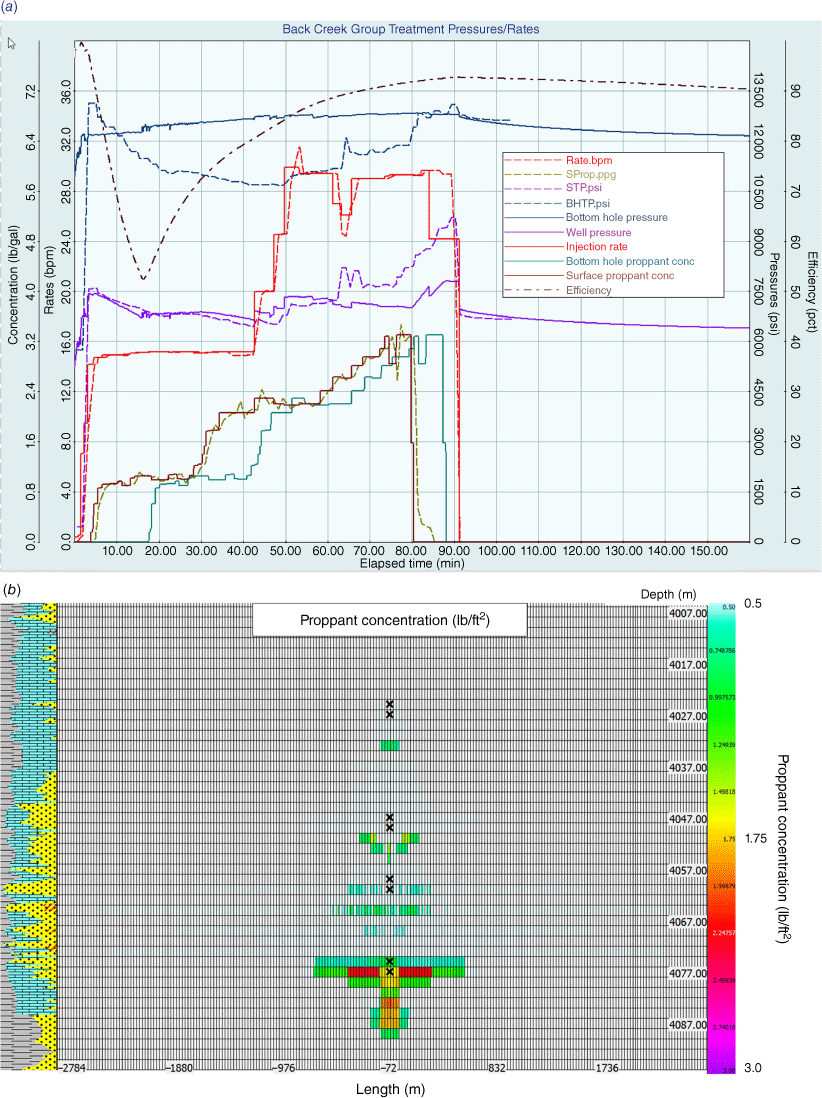
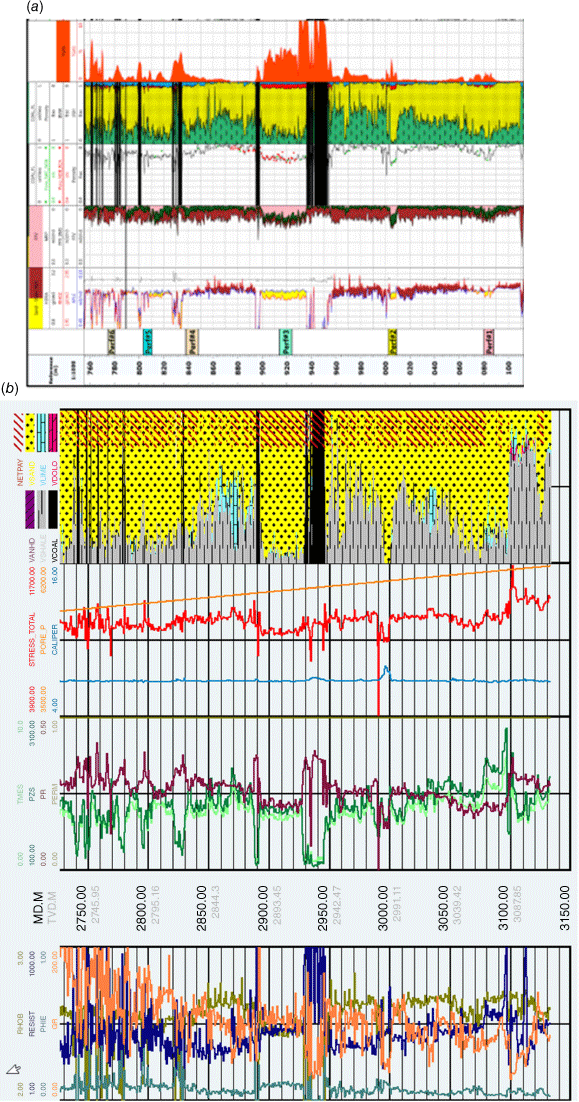
As an example, we will present the treatment data (Fig. 6a) and resulting dimensions created during the Upper Kianga treatment in Tasmania 1 (Fig. 6b). In most QGC treatments, the primary fracturing fluid was a 35 lb/gal hydroxypropyl guar (HPG) fracturing fluid placing (in some cases 100 mesh sand) and 40/70, 20/40 and 20/40 ceramic proppants with a tail-in of a 20/40 non-radioactive tracer (NRT) ceramic proppant (Duenckel et al. 2011a, 2011b). With the NRT process a tail-in may not reflect the actual fracture height, based on proppant settling; further, it is also depth limited as seen in the disparity of early- to late-time proppant placement across other hydraulic fracturing case studies (Williams and McCarthy 1987; Johnson and Woodroof 1996; Barree et al. 2002; Scott et al. 2010). A post-frac sonic anisotropy log was used in addition to the NRT as a fracture height diagnostic (Scott et al. 2010); however, other than a discussion and review of the Dunk 1 well (de Oliveira Neto and Yakovlev 2018), there was little interpretation or presentation of these data in the submitted reports on the Geological Survey of Queensland (GSQ) Open Data Portal.
(a) Tasmania 1 treatment rates, proppant concentrations, STP and BHTP history match and (b) resulting dimensions based on a 0.5 lb/ft2 proppant cut-off, with black ‘x’ symbols marking the Upper Kianga perforations.
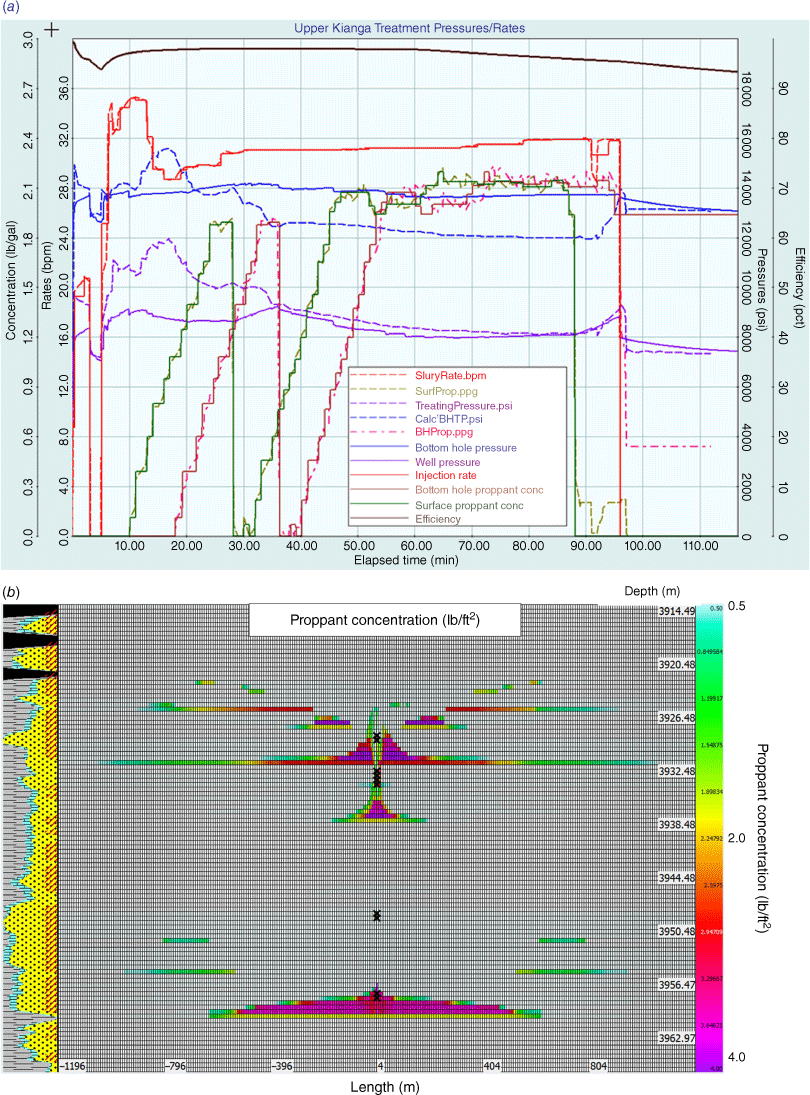
In all but the Dunk 1 well, most frac treatments used small pads and low sand concentrations (<3 ppg maximum). There was a significant amount of near wellbore pressure loss (NWBPL) or tortuosity observed in the Upper Kianga treatment (>3000 psi), resulting in an early-time mismatch between the modelled and observed surface treating pressures (STP) (despite early-time instantaneous shut-in pressure (ISIP) match) until completion of the early sand stages. The calculated bottomhole treating pressure (BHTP) was miscalculated in terms of the friction model. Thereafter, treatment pressures and final ISIP closely matched the modelled pressure using the 1D stress profile developed from the Back Creek Group DFIT and mini-frac data.
The main contributor to fracture ineffectiveness in this and many treatments in the Back Creek Group and the Kianga (outside of Dunk 1) was the problem of low proppant concentrations and high efficiency of the fracturing fluid resulting in proppant encapsulation, convection and settling (Cleary and Quinn 1994). As a result, the highest proppant concentrations exist outside the perforated intervals as observed in Fig. 6b. In this case, the frac efficiency was >90% at the conclusion of pumping and required nearly 24 h in the model to achieve fracture closure. Immediate flowback and returning flow patterns to the wellbore may have improved the outcome in this case.
Back Creek Group – Daydream 1
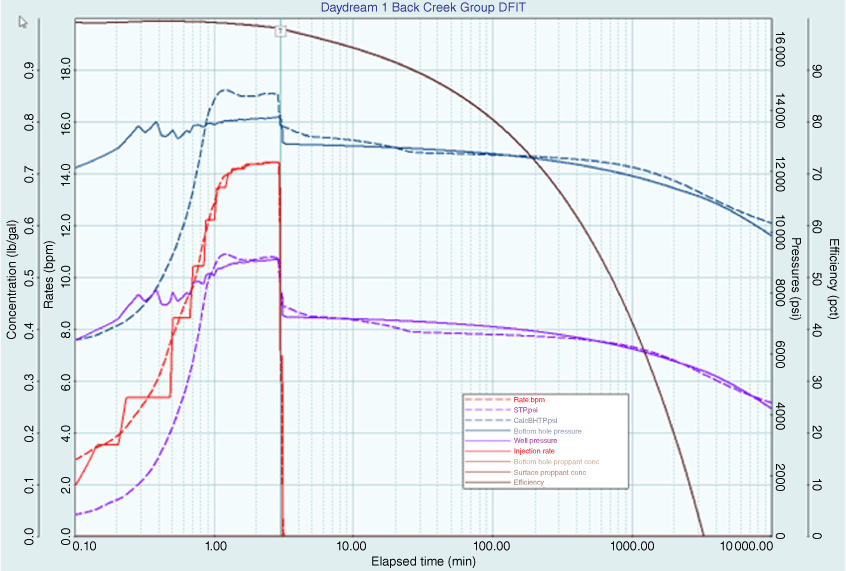
Daydream 1 intersected the Kianga Formation and Back Creek Group with planned stimulations in the Back Creek Group using plug and perforation operations. A DFIT was performed on the lowermost perforation set of the Back Creek Stage 1 perforations, then shut-in for 179 h. Analysis of the DFIT data indicated that a single closure event was likely positioned above the DFIT interval in this Back Creek section, evidenced by the height-recession pressure signature observed on the DFIT g-function analysis (Barree et al. 2009). Several solutions could be fit to the data to match the closure; however, bracketing the range of maximum horizontal stress (σHMax), using breakdown pressures on the DFIT and frac stages, provides reliability to the proposed profile. Therefore, the DFIT and other observed stress data along with a pressure gradient of 0.56 psi/ft, produced a 1D stress profile that indicated a normal to strike-slip stress regime in the sandstone sections and a normal stress condition in the coals (Fig. 7). Any further elevation of the reservoir pressure would cause the stress profile to move from strike-slip to normal, a contradiction to other evidence, including elevated ISIP values observed during Stage 1 (Fig. 7) at values above the vertical stress. This stress profile was successfully history-matched to observed early-time DFIT pressures in a planar-3D fracturing simulator (Barree 1983), then the permeability model was modified to match the extended shut-in period for that DFIT (Fig. 8). As with the Kianga, the efficiency of a DFIT with treated water created a fracture efficiency of >90%; therefore, leak off was extremely low and matched a permeability value in the range of <100 nano Darcy.
The 1D stress profile developed for Daydream 1 based on a 0.56 psi/ft reservoir gradient and calibrated by DFIT and breakdown pressures.
Daydream 1 Back Creek Group DFIT STP, calculated BHTP and extended leak off pressure-history match (including the after-closure period) for Daydream 1 using the stress profile based on a 0.56 psi/ft reservoir gradient.
As an example, we will present the treatment data (Fig. 9a) and resulting dimensions created during the Lower Back Creek Group treatment in Daydream 1 (Fig. 9b). The primary fracturing fluid was a 35 lb/gal HPG fracturing fluid using 100 mesh sand and 40/70, 20/40 ceramic proppants and a 20/40 NRT ceramic proppant. 100 mesh sand was added despite no pressure-dependent leak off being observed in the DFIT g-function analysis. As with other treatments, a post-frac sonic anisotropy log was used in addition to the NRT as diagnostics; however, no discussion was noted in the frac reports on the GSQ Open Data Portal other than no fracture stimulation-related stress anisotropy was observed higher than 3820 m. A low level of NWBPL was observed with an early-time pressure-history match between the modelled and observed STP until the final ISIP, which more closely matched the calculated BHTP than the STP.
(a) Daydream 1 treatment rates, proppant concentrations, STP and BHTP history match and (b) resulting dimensions based on a 0.5 lb/ft2 proppant cut-off, with black ‘x’ symbols marking the Back Creek Group perforations.
As with other treatments in QGC’s stimulation programs (outside of Dunk 1), the problem of low proppant concentrations and high efficiency of the fracturing fluid would have encouraged proppant encapsulation, convection and settling. As a result, the highest proppant concentrations exist outside the perforated intervals as observed in Fig. 9b. In this case the frac efficiency was >90% at the conclusion of pumping and required nearly 8 days in the model to achieve fracture closure based on the low permeability from the DFIT and main fracture pressure-history matching. Immediate flowback to encourage flow patterns to the wellbore might improve the outcome. Further, observing a longer post-frac shut-in would aid practitioners in better matching the post-frac permeability of the stimulated reservoir volume (SRV).
Other stimulations – Fantome 1 and Dunk 1
As with other wells, fracture effectiveness in fracture Fantome 1 was affected by low proppant concentrations and high efficiency of the fracturing fluid, resulting in proppant encapsulation, convection and settling. High post-fracture pressures were observed in the well, leading to anecdotal suggestions that an overpressure condition >0.60 psi/ft was evident in the well. However, the DFIT, Back Creek Group and Kianga treatments were effectively pressure-history matched with a lower reservoir pressure gradient and would not support a >0.60 psi reservoir pressure gradient without considering the interval as extensional versus compressional. In the authors’ opinion, the anecdotal overpressure >0.60 psi/ft may be related to the ineffective flowback of post-frac fluids and the very lengthy periods of equilibration associated with the low permeability (i.e. <1 μD).
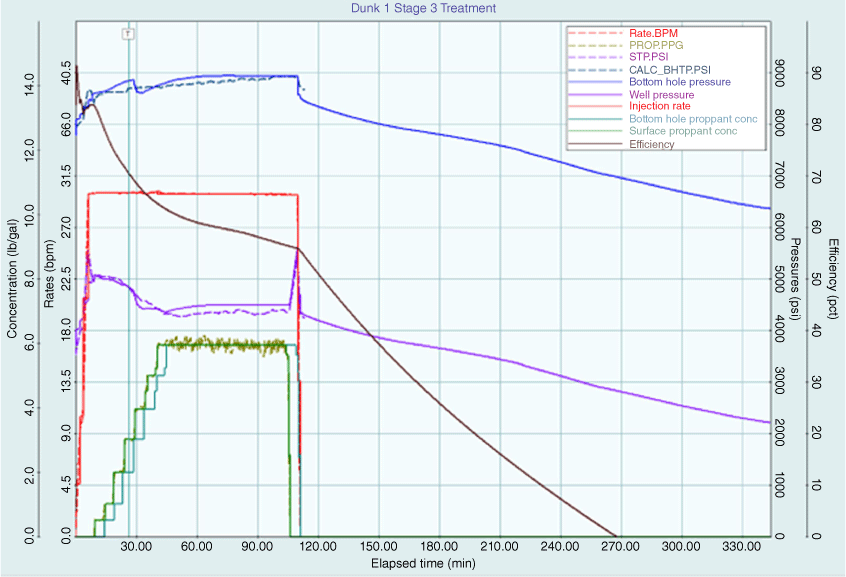
A thorough review of well stimulation improvements by QGC on the Dunk 1 well appeared to be made by de Oliveira Neto and Yakovlev (2018). Although the actual well was not named in this paper, a correlation of the well log and the log section in the paper are the same (Fig. 10), and treatment volumes reported in the GSQ Open Data Portal are identical to those reported in the paper. As aforementioned, the location of Dunk 1 was downdip of conventional developments (i.e. Myall Creek), near past unconventional targets (e.g. Overston Field), and significantly shallower than Fantome 1, Tasmania 1 and Daydream 1. The third stage in Dunk 1 was chosen for evaluation based on the targeting of sands within coals and where lower pad volumes and higher sand concentrations resulted in improving the fracture effectiveness in this well compared to earlier wells. Fig. 11 shows a pressure-history match of the treatment data based on a stress profile using a 0.54 psi/ft reservoir pressure gradient and lower tectonic strains than other Taroom Trough wells. This match is non-unique, as there is no DFIT data available in the GSQ Open Data Portal although it is noted by de Oliveira Neto and Yakovlev (2018). Further, the model predicted that dimensions (Fig. 12a) correlated reasonably well to the NRT fracture height (Fig. 12b, yellow blocks in second to last track) after de Oliveira Neto and Yakovlev (2018).
(a) Stimulation study log with perforations [after de Oliveira Neto and Yakovlev (2018)] and (b) treatment processed log, with the calibrated stress profile based on the history match of Stage 3 in Dunk 1.
Dunk 1 Stage 3 treatment rates, proppant concentrations, and STP and BHTP pressure-history match.
Dunk 1 Stage 3 pressure-history matched modelled dimensions based on (a) a calibrated stress profile using a 0.54 psi/ft reservoir pressure gradient and lower tectonic strains than other QGC Taroom Trough wells versus (b) perforations, NRT indicated height (2nd to last yellow track) and stress anisotropy height (last green track) after de Oliveira Neto and Yakovlev (2018).
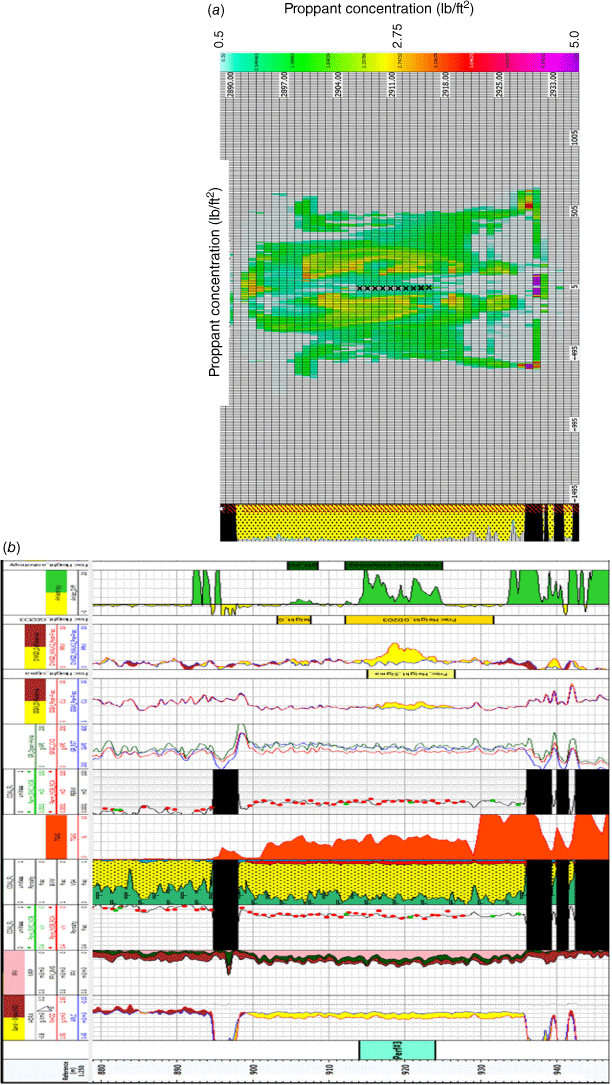
Interestingly, de Oliveira Neto and Yakovlev (2018) did not note the stress anisotropy created in the lowermost coal boundaries, which does correlate to the height shown in the current modelling (green last track Fig. 12b). Certainly, with more pressure data from the DFIT and mini-fracs (the charts have not been included in the post-job report) more confidence can be made as to the reservoir pressure estimate; however, higher tectonic strains and a higher reservoir pressure would not support the observed pressures, which are much lower than other QGC treatments. Tinowon 2 (drilled in 2015 by Gladstone LNG, 20 km to the NW of Dunk 1) data supports the lower pressure gradient in Dunk 1, as four multi-point testing tool pressures were taken in the Tinowon reservoir and showed a pressure gradient of 0.52 psi/ft and a 3800 psi shut-in pressure, following production testing of the Tinowon at mid-perforations depth of 2348.5 m, giving a gradient of 0.49 psi/ft.
Discussion/conclusions
Fifty years after the first deep well was drilled into the Taroom Trough, the ambitious QGC tight gas exploration program confirmed pervasive gas shows, some overpressure outside mappable traps and an ability to flow gas to surface. While the program could be considered a technical success, commercial success has remained elusive due to challenges posed by a combination of the low permeability of the reservoir and the lack of an effective extractive technology for this resource.
Regarding the reservoir quality, most Kianga and Back Creek Group intervals have very low permeability and would require further strategies to maximise the SRV in order to produce economic gas rates. The past reservoir characterisation closed many gaps in the understanding of the Taroom Trough, including proving that the key elements required for pervasive tight gas sand plays exist in the previously undrilled deep portion of the southern Taroom Trough. A key challenge for the future pursuit of tight gas plays in the southern Taroom Trough is the sparsity of well and seismic data, which makes it difficult to develop robust geological models to identify zones of the highest prospectivity, which can then be systematically tested.
Achieving conductive fractures in all perforated intervals will continue to be challenging, based on the low permeability, moderate to high NWBPL, high efficiency of fracturing fluids and long post-frac closure times. With the complex and less-than-ideal petrological composition of the sandstones in the Taroom Trough, careful selection of fracture stimulation fluid to minimise formation damage will be a key part of successful fracture stimulation in future wells. The locations and DFIT designs in the wells were ineffective at resolving key uncertainties in the stress and pressure profiles.
Recommendations
Several recommendations can be made based on the observations and analyses performed as part of this study.
With regards to reservoir characterisation, a major gap is the lack of a consistent basin-wide chronostratigraphic framework to aid in the correlation of major reservoir intervals. Addressing this is not without challenge given the density of data available, particularly in the deeper parts of the southern Taroom Trough. Techniques such as chemostratigraphy using cuttings from existing wells could support further understanding of the reservoir.
DFITs are an essential tool in the characterisation of reservoir pressure, permeability and stress in low-permeability reservoirs. Therefore, more consideration for a DFIT design and usage should be made, rather than just selecting producing perforations and using ‘rules of thumb’ in pumping an indiscriminate volume of fluid. To achieve useful information in such low-permeability intervals, the following is suggested:
define discrete stress lows based on a pre-existing rock mechanical and stress models rather than just target prospective pay intervals;
reduce uncertainty or eliminate confusing interpretations by focusing on small intervals with similar closure pressures and higher-stress boundaries;
design injection volume and equipment requirements based on the range of expected permeability values, and confirm the range of times to pseudo-radial flow using a coupled hydraulic fracturing and reservoir simulator;
consider multiple DFITs in non-pay intervals below the target along with forced closure (i.e. in the well ‘rat hole’ or in non-pay between multiple stages) to rapidly pre-develop the stress profile prior to selecting a producing interval and testing for permeability; and
focus on intervals with contrasting Young’s Modulus values to better constrain the minimum (ε hmin) and maximum (ε HMax) horizontal tectonic strains in strike-slip or more complex stress regimes.
Hydraulic fractures should utilise adequate viscosity to transport proppant through the near wellbore region and then begin to build a bank of proppant adjoining the desired target intervals. As fracture growth into the coals could be problematic, standoff and perforation placement relative to stress boundaries should be a major consideration and allow smaller frac stages to achieve better sand placement across desired sandstone targets (Johnson et al. 2016, 2019b). If NWBPL becomes more problematic with lower viscosity fracturing fluids, then wellbore orientation in the σHMax-direction and oriented perforating (low- and high-side 180° phase) may reduce NWBPL as used in other Australian Basins (Johnson et al. 2002, 2019b; Johnson 2018a).
Further drilling and targeting of interbedded coals should be considered to test the potential of a mixed-pay completion and test the viability of the deep coals. In selecting coal targets, the amount and quality of coal chemical and petrographic analysis should be improved to confirm the suitability of the coals for stimulation and to inform the design of any fracture stimulation. Deep coal tests should include micro-proppants to potentially aid destressing and to increase permeability as a result of degassing and shrinkage (Keshavarz et al. 2016a, 2016b; Johnson et al. 2022a, 2022b). Separate stimulations may require sequential perforating of sands and stimulation prior to perforating coals as well as stimulation within specific stages. This method of ‘dynamic diversion’ of coal stimulations while post-sandstone stimulations are still open is possible based on the large stress differential between the sandstone and coal intervals. This methodology would increase the number of fractures and SRV without excessively increasing the size of fracs and putting more pressure on achieving large fractures with continuous conductivity across both sandstone and coal intervals.
Data availability
The data that support this study are available in the well completion reports and associated data for Moa 1, Daydream 1, Fantome 1, Tasmania 1, Dunk 1, Moa 2, Magnetic 1, Cabawin 1, Cabawin 2, Cabawin 3, Cabawin 4, Cabawin East 1 and Tinowon 2 in the GSQ Open Data Portal at https://geoscience.data.qld.gov.au/. Geognostics, 2021. OZ SEEBASE® 2021 (March 2021). Geognostics Australia Pty Ltd, https://www.geognostics.com/oz-seebase-2021, is released under a Creative Commons Attribution 4.0 International (CC BY 4.0) license.
Acknowledgements
The authors would like to thank The University of Queensland, the Centre for Natural Gas and its industry members (Arrow Energy, Australia Pacific LNG and Santos). Further, the authors wish to acknowledge the use of software tools, such as Halliburton for GOHFER.
References
Barree RD (1983) A practical numerical simulator for three-dimensional fracture propagation in heterogeneous media. SPE-12273-MS. SPE Reservoir Simulation Symposium, 15–18 Nov 1983, San Francisco, CA.Barree RD, Fisher MK, Woodroof RA (2002) A practical guide to hydraulic fracture diagnostic technologies. SPE 77442. SPE Annual Technical Conference and Exhibition, 29 September–2 October 2002, San Antonio, TX.
Barree RD, Barree VL, Craig D (2009) Holistic fracture diagnostics: Consistent interpretation of prefrac injection tests using multiple analysis methods. SPE Production & Operations 24, 396–406.
| Holistic fracture diagnostics: Consistent interpretation of prefrac injection tests using multiple analysis methods.Crossref | GoogleScholarGoogle Scholar |
Boreham CJ, Horsfield B, Schenk HJ (1999) Predicting the quantities of oil and gas generated from Australian Permian coals, Bowen Basin using pyrolytic methods. Marine and Petroleum Geology 16, 165–188.
| Predicting the quantities of oil and gas generated from Australian Permian coals, Bowen Basin using pyrolytic methods.Crossref | GoogleScholarGoogle Scholar |
Brakel AT, Totterdell JM, Wells AT, Nicoll MG (2009) Sequence stratigraphy and fill history of the Bowen Basin, Queensland. Australian Journal of Earth Sciences 56, 401–432.
| Sequence stratigraphy and fill history of the Bowen Basin, Queensland.Crossref | GoogleScholarGoogle Scholar |
Cadman SJ, Pain L, Vuckovic V (1998) Bowen and Surat Basins, Clarence-Moreton Basin, Sydney Basin, Gunnedah Basin and other minor onshore basins, Qld, NSW and NT. Australian Petroleum Accumulations report 11. The Department of Primary Industries and Energy, Bureau of Resource Sciences, Canberra, Australia.
Cleary MP, Quinn TS (1994) ‘Testing of 3-d hydraulic fracture models with supercomputer and laboratory simulations, GRI-94/0463.’ (Gas Research Institute: Chicago, IL)
de Oliveira Neto JM, Yakovlev A (2018) The use of pre & post fracture stimulation logs to better integrate static petrophysical analysis with dynamic data from production logs. Paper presented at the SPWLA 59th Annual Logging Symposium, June 2018, London, UK.
Duenckel RJ, Smith HD, Chapman MA, Saldungaray PM (2011a) A new nuclear method to locate proppant placement in induced fractures. Paper presented at the SPE/DGS Saudi Arabia Section Technical Symposium and Exhibition, May 2011, Al-Khobar, Saudi Arabia.
Duenckel RJ, Smith HD, Warren WA, Grae AD (2011b) Field application of a new proppant detection technology. Paper presented at the SPE Annual Technical Conference and Exhibition, October 2011, Denver, Colorado, USA.
Fielding CR, Sliwa R, Holcombe RJ, Jones AT (2001) A new palaeogeographic synthesis for the Bowen, Gunnedah and Sydney Basins of eastern Australia. Paper presented at PESA Eastern Australasian Basins Symposium, 25–28 November 2001, Melbourne, Vic. (The Australasian Institute of Mining and Metallurgy: Melbourne)
Holditch SA, Robinson BM, Whitehead WS, Ely JW (1988) The GRI staged field experiment. SPE Formation Evaluation 3, 519–533.
| The GRI staged field experiment.Crossref | GoogleScholarGoogle Scholar |
Jenkins CD, McLane M (2019) How not to squander billions on your next unconventional venture. Paper presented at the SPE/AAPG/SEG Asia Pacific Unconventional Resources Technology Conference, November 2019, Brisbane, Australia.
Johnson RL (2018a) A new experimental extractive technology trial for Cooper Basin unconventional resources: Alignment flow technology. Preview 2018, 44–45.
| A new experimental extractive technology trial for Cooper Basin unconventional resources: Alignment flow technology.Crossref | GoogleScholarGoogle Scholar |
Johnson Jr RL (2018b) What we know, what we don’t know, and things we do not know we don’t know about hydraulic fracturing in high stress environments. ASEG Extended Abstracts 2018, 1–7.
| What we know, what we don’t know, and things we do not know we don’t know about hydraulic fracturing in high stress environments.Crossref | GoogleScholarGoogle Scholar |
Johnson Jr RL, Greenstreet CW (2003) Managing uncertainty related to hydraulic fracturing modeling in complex stress environments with pressure-dependent leakoff. SPE-84492-MS, SPE Annual Technical Conference and Exhibition, Denver, CO.
Johnson Jr RL, Woodroof RA (1996) The application of hydraulic fracturing models in conjunction with tracer surveys to characterize and optimize fracture treatments in the brushy canyon formation, southeastern New Mexico. SPE-36470-MS, SPE Annual Technical Conference and Exhibition, Denver, CO.
Johnson Jr RL, Dunn KP, Bastian PA, Hopkins CW, Conway MW (1998) Qualifying hydraulic fracturing effectiveness in tight, naturally fractured reservoirs by combining three-dimensional fracturing and reservoir simulators. SPE-49048-MS, SPE Annual Technical Conference and Exhibition, New Orleans, LA.
Johnson Jr RL, Aw KP, Ball D, Willis M (2002) Completion, perforating and hydraulic fracturing design changes yield success in an area of problematic frac placement – the Cooper Basin, Australia. SPE-77906-MS, SPE Asia Pacific Oil and Gas Conference and Exhibition, Melbourne, Australia.
Johnson Jr R, Abul Khair HF, Jeffrey RG, Meyer JJ, Stark C, Tauchnitz J (2015) Improving fracture initiation and potential impact on fracture coverage by implementing optimal well-planning and drilling methods for typical stress conditions in the Cooper Basin, Central Australia. The APPEA Journal 55, 403
| Improving fracture initiation and potential impact on fracture coverage by implementing optimal well-planning and drilling methods for typical stress conditions in the Cooper Basin, Central Australia.Crossref | GoogleScholarGoogle Scholar |
Johnson Jr RL, Nguyen L, Russel T (2016) Next steps to crack the code on tight Permian Toolachee and Patchawarra sandstones of the Cooper Basin, southwest Queensland. The APPEA Journal 56, 533
| Next steps to crack the code on tight Permian Toolachee and Patchawarra sandstones of the Cooper Basin, southwest Queensland.Crossref | GoogleScholarGoogle Scholar |
Johnson Jr R, Zhong R, Nguyen L (2019a) Results of hydraulic fracturing design improvements and changes in execution strategies for unconventional tight gas targets in the Cooper Basin, Australia. The APPEA Journal 59, 244–259.
| Results of hydraulic fracturing design improvements and changes in execution strategies for unconventional tight gas targets in the Cooper Basin, Australia.Crossref | GoogleScholarGoogle Scholar |
Johnson RL, Zhong R, Nguyen L (2019b) Well trajectory, completion and fracture design changes improve execution for deep unconventional tight gas targets in the Cooper Basin, Australia. SPE-194366-MS, SPE Hydraulic Fracturing Technology Conference and Exhibition, The Woodlands, TX.
Johnson RL, Ramanandraibe HM, Di Vaira N, Leonardi C, You Z, Santiago V, Ribeiro A, Badalyan A, Bedrikovetsky P, Zeinijahromi A, Carageorgos T, Sanchez-Barra A, Chalaturnyk RJ, Deisman N (2022a) Implications of recent research into the application of graded particles or micro-proppants for coal seam gas and shale hydraulic fracturing. Paper presented at the SPE Asia Pacific Oil & Gas Conference and Exhibition, October 2022, Adelaide, Australia.
Johnson R, Leonardi C, You Z, Ribiero A, Di Vaira N (2022b) Converting tight contingent CSG resources: Application of graded particle injection in CSG stimulation. Report. (The University of Queensland, Centre for Natural Gas: Brisbane, Qld)
Keshavarz A, Badalyan A, Johnson Jr R, Bedrikovetsky P (2016a) Productivity enhancement by stimulation of natural fractures around a hydraulic fracture using micro-sized proppant placement. Journal of Natural Gas Science and Engineering 33, 1010–1024.
| Productivity enhancement by stimulation of natural fractures around a hydraulic fracture using micro-sized proppant placement.Crossref | GoogleScholarGoogle Scholar |
Keshavarz A, Johnson R, Carageorgos T, Bedrikovetsky P, Badalyan A (2016b) Improving the conductivity of natural fracture systems in conjunction with hydraulic fracturing in stress sensitive reservoirs. SPE-182306-MS, SPE Asia Pacific Oil and Gas Conference and Exhibition, Perth, Australia.
Pitkin MC, Wadham TH, McGowen JM, Thom WW (2012) Taking the first steps: Stimulating the Nappamerri Trough resource play. Paper SPE-60307-MS, SPE Asia Pacific Oil and Gas Conference and Exhibition, Perth, Australia.
QGC Pty Limited (2015) ATP 645, QGC dunk 1, well completion report. (GSQ Open Data Portal)
QGC Pty Limited (2016) ATP 645, geological and geophysical studies report for period ending 1/6/2016. (GSQ Open Data Portal)
Queensland Department of Mines Energy (1997) ‘The Surat and Bowen Basins, South-East Queensland.’ (Queensland Department of Mines and Energy: Brisbane)
Robinson BM, Holditch SA, Peterson RE (1991) The gas research institute’s second staged field experiment: A study of hydraulic fracturing. SPE-21495-MS, SPE Gas Technology Symposium, Houston, TX.
Robinson BM, Holditch SA, Whitehead WS, Peterson RE (1992) Hydraulic fracturing research in East Texas: Third GRI staged field experiment. Journal of Petroleum Technology 44, 78–87.
| Hydraulic fracturing research in East Texas: Third GRI staged field experiment.Crossref | GoogleScholarGoogle Scholar |
Saunders BF, Robinson BM, Holditch SA, Peterson RE (1992) Hydraulic fracturing research in the Frontier Formation through the Gas Research Institute’s fourth staged field experiment. Paper SPE-24854-MS, SPE Annual Technical Conference and Exhibition, Washington, D.C.
Scott M, Johnson RL, Datey A, Vandenborn C, Woodroof RA (2010) Evaluating hydraulic fracture geometry from sonic anisotropy and radioactive tracer logs. SPE-133059-MS, SPE Asia Pacific Oil and Gas Conference and Exhibition, 18–20 October 2010, Brisbane, Qld, Australia.
Scott MP, Durant R, Woodroof RA, Stephens T, Thom W, McGowen JM (2013) Investigating hydraulic fracturing in tight gas sand and shale gas reservoirs in the cooper basin. SPE-167073-MS, SPE Unconventional Resources Conference and Exhibition-Asia Pacific, Brisbane, Australia.
Shanley KW, Cluff RM, Robinson JW (2004) Factors controlling prolific gas production from low-permeability sandstone reservoirs: Implications for resource assessment, prospect development, and risk analysis. AAPG Bulletin 88, 1083–1121.
| Factors controlling prolific gas production from low-permeability sandstone reservoirs: Implications for resource assessment, prospect development, and risk analysis.Crossref | GoogleScholarGoogle Scholar |
Williams RL, McCarthy JT (1987) Using multiple radioactive tracers to optimize stimulation designs. SPE-16383-MS, SPE California Regional Meeting, 8–10 April 1987, Ventura, CA.

Prof Raymond L Johnson Jr. is currently a Professor of Well Engineering and Production Technology at the University of Queensland, Centre for Natural Gas. He has a PhD in Mining Engineering, a MSc in Petroleum Engineering, a Graduate Diploma in Information Technology, and a BA in Chemistry. Prof Johnson is a Life Member of the Society of Petroleum Engineers (SPE), a past Queensland SPE Section chair, twice co-Chair of the SPE Unconventional Reservoir Conference Asia Pacific, 2019 co-Chair and 2021 Advisor of the Asia Pacific Unconventional Resources Technology Conference, Technical Committee Co-Chair for the 2022 SPE Unconventional Reservoir Symposium, and twice SPE Regional Technical Award Recipient (Production Operations and Management and Information). Ray has served in numerous technical and management positions in service, operating and consulting companies in the United States and Australia. Prof Johnson is a Fellow of Engineers Australia. |

Nathan Parker is currently Exploration Manager at Origin Energy. He is an accomplished explorer with over 20 years’ global experience in a diverse range of plays, from deep water to unconventionals. With a BSc in Applied Geology from The University of New South Wales and an MBA from Curtin University, Nathan has worked with Woodside, Shell, BG Group (Queensland Gas Company Pty Ltd; QGC) and Origin Energy in a wide range of technical and management roles. Prior to joining Origin Energy, Nathan led tight gas sand exploration programs in the Bowen Basin at QGC, resulting in the drilling of a series of play-opening wells in the deep basin centre. Nathan is an active member of PESA, serving on State and Federal Committees, and he is a past Federal President. He is also a member of the American Association of Petroleum Geologists. |