

Petrophysical interpretation and reservoir characterisation on Proterozoic shales in National Drilling Initiative Carrara 1, Northern Territory
Liuqi Wang A * , Adam H. E. Bailey A , Emmanuelle Grosjean A , Chris Carson A , Lidena K. Carr A , Grace Butcher A , Christopher J. Boreham A , Dave Dewhurst B , Lionel Esteban B , Chris Southby A and Paul A. Henson AA Geoscience Australia, GPO Box 378, Canberra, ACT 2601, Australia.
B CSIRO Energy, Perth, WA 6151, Australia.
The APPEA Journal 63 230-246 https://doi.org/10.1071/AJ22049
Submitted: 8 December 2022 Accepted: 1 March 2023 Published: 11 May 2023
© 2023 The Author(s) (or their employer(s)). Published by CSIRO Publishing on behalf of APPEA. This is an open access article distributed under the Creative Commons Attribution 4.0 International License (CC BY).
Abstract
The Proterozoic succession in the National Drilling Initiative Carrara 1 drill hole, Northern Territory, is dominated by tight shales, siltstones and calcareous clastic rocks. As part of Geoscience Australia’s Exploring for the Future program, this study aimed to improve the Proterozoic shale gas reservoir characterisation by derivation of porosity, permeability and gas content from laboratory testing and machine learning approaches to wireline log interpretation. The Proterozoic Lawn Hill Formation is divided into four chemostratigraphic packages. The middle two packages are further divided into seven internal units according to principal component analysis and self-organising map clustering on well logs and inorganic geochemical properties. Artificial neural networks were then applied to interpret the mineral compositions, porosity and permeability from well logs, density and neutron-density crossplot interpretations. Gas content was estimated from the interpreted porosity, gas saturation, total organic carbon and clay contents. Petrophysical interpretation results are summarised for all chemostratigraphic packages and units. P2 (1126.3–1430.1 m) has the highest potential among the four chemostratigraphic packages. P2U1 (1126.3–1271 m) and P2U3 (1335.5–1430.1 m) units have the most favourable petrophysical properties for organic-rich shales, with average total gas contents of 1.213 and 1.315 cm3/g, geometric mean permeability of 6.6 and 25.31 µD and net shale thickness of 53.5 and 83.3 m, respectively. P3U4 (687.9–697.9 m) has high gas content and permeability, with a net shale thickness of 35.9 m. The tight non-organic-rich siltstone and shale reservoirs in package P1 (below 1430.1 m) have an average gas saturation of 17.4% and a geometric mean permeability of 0.48 µD.
Keywords: artificial neural networks, chemostratigraphy, gas content, log interpretation, machine learning, mineral composition, NDI Carrara 1, permeability, porosity, Proterozoic shale, reservoir characterisation.
Introduction
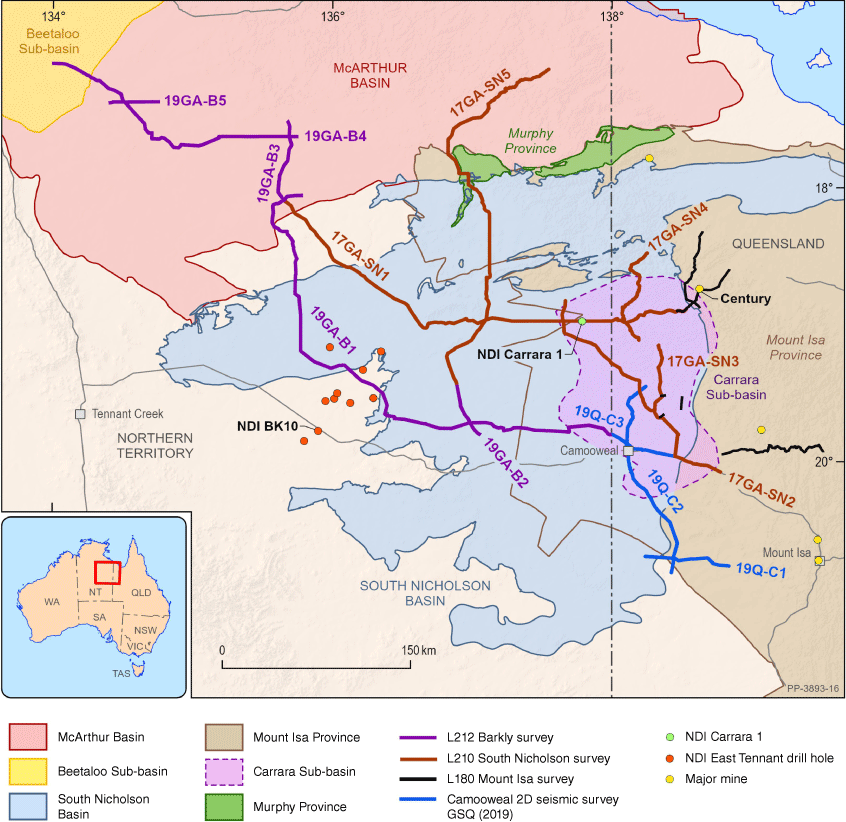
In the first phase of Geoscience Australia’s (GA) Exploring for the Future (EFTF) Program (2016–2020), two deep crustal seismic reflection surveys (the L210 South Nicholson and L212 Barkly Seismic Surveys) were acquired in the South Nicholson region of the Northern Territory and Queensland (Fig. 1). Structural interpretations of these survey data discovered a large sedimentary depocentre beneath the Georgina Basin, and this depocentre was termed the ‘Carrara Sub-basin’ (Carr et al. 2019; Fig. 1). The Carrara Sub-basin spans 129 km by at least 190 km from north to south and accommodates thick deposits (up to 8 km) formed in both the early Palaeozoic (Georgina Basin) and Proterozoic era (Carson et al. 2022a). The Proterozoic sedimentary rocks, particularly the shales, are considered equivalent to the prospective rocks of the greater McArthur Basin, Lawn Hill Platform and Mount Isa Province (Bailey et al. 2022a; Grosjean et al. 2022).
Location of the NDI Carrara 1 stratigraphic drillhole and seismic survey lines across the McArthur Basin, South Nicholson Basin and Carrara Sub-basin (Carson et al. 2022a).
National Drilling Initiative (NDI) Carrara 1 is a deep stratigraphic drill hole (Fig. 1) drilled under the MinEx CRC-led NDI program, in collaboration with GA and the Northern Territory Geological Survey (NTGS). NDI Carrara 1 penetrated carbonate formations of the Georgina Basin underlain by the Proterozoic succession of the Carrara Sub-basin beneath a regional unconformity. The preliminary stratigraphy defined at the drill hole site included the following Cambrian strata of the Georgina Basin: Camooweal Dolostone (0–249 m), Currant Bush Limestone (249–530.8 m) and the Border Waterhole Formation (530.8–630.36 m), and the following Proterozoic strata of the Lawn Hill Platform: Widdallion Sandstone Member of Lawn Hill Formation (630.36–687.9 m), undivided Lawn Hill Formation (687.9–1430.1 m) and the Plain Creek Formation (1430.1 m – total depth) (Geoscience Australia 2021).
Two stages of continuous coring were carried out from 283.9 m to total depth. As part of the EFTF program, a variety of laboratory tests were conducted for organic and inorganic geochemical properties (Carson et al. 2021), geochronological age (Carson et al. 2022a), as well as petrophysical and geomechanical properties (Bailey et al. 2022a, 2022b). Wireline logging was undertaken and pre-processed by Weatherford Logging, including spectral gamma ray (concentrations of potassium (GRPON,%), thorium (GRTHN, ppm) and uranium (GRURN, ppm)), compressional wave slowness (DTCN, µs/ft), bulk density (DENNN, g/cm3), limestone neutron porosity (NPRLNC, m3/m3), photoelectric factor (PDPEN, b/e), shear wave slowness (DTSXXN, µs/ft), Stoneley wave slowness (DTDTXN, µs/ft), spontaneous potential (SPCGN, mv), deep (RTAFN, ohmm) and shallow resistivity (FEFEN, ohmm) logs, array induction resistivity and micro-imager logs (Geoscience Australia 2021). This study integrated conventional wireline logs, laboratory measurements, density and neutron-density crossplot interpretation results (Wang et al. 2023) with the aim of approximating the petrophysical properties using artificial neural network techniques. Reservoir characterisation was performed on the defined chemostratigraphic packages and internal units.
Chemostratigraphic units
Stratigraphy and age of Proterozoic succession
The age of Lawn Hill Formation is 1595 ± 6–1611 ± 4 Ma (ASUD 2022). Recent geochronological testing shows that the ages at 1012 m, 1204 m and the interval of 1580–1650 m are ca. 1588, 1601 and 1606–1614 Ma, respectively (Carson et al. 2022a). This implies that the Lawn Hill Formation occurs from the regional unconformity (base Georgina Basin) to total depth in NDI Carrara 1.
Below the Widdallion Sandstone Member, the Lawn Hill Formation was further divided into three intervals referred to as the lower Lawn Hill Formation (1430.1 m to total depth), Lawn Hill shale (1126.3–1430.1 m) and upper Lawn Hill (687.9–1126.3 m) (Bailey et al. 2022a; Wang et al. 2023; Fig. 2). The lower Lawn Hill consists of tight sandstone, siltstone and shale with a small portion of tuffaceous clastics (Madden et al. 2022). The Lawn Hill shale contains thick organic-rich black shales with minor thin tuffaceous material (Carson et al. 2022a). The upper Lawn Hill Formation is mainly characterised by micrite, claystone, siltstone and carbonaceous claystone (top). The Widdallion Sandstone Member comprises mainly calcareous and dolomitic siltstone (Crombez et al. 2022).
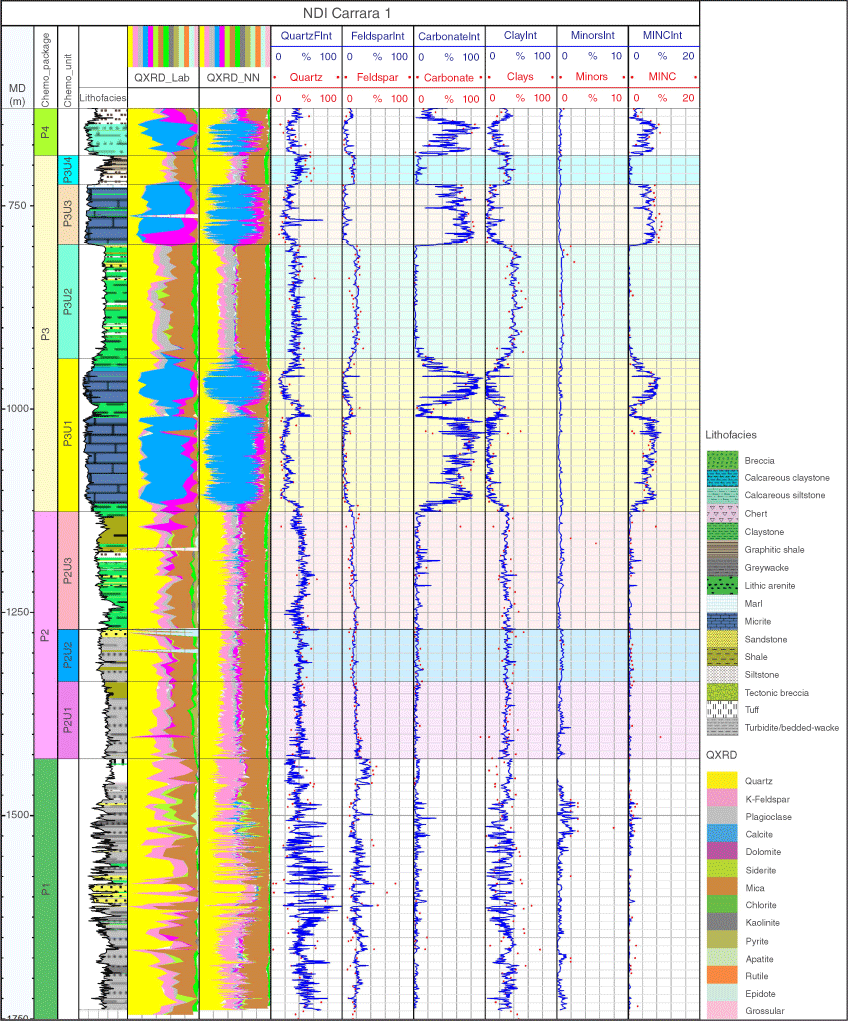
Data from Proterozoic succession collected in NDI Carrara 1. Track 1: driller’s depth below ground level (MD, m); Track 2: stratigraphy (Bailey et al. 2022a; Carson et al. 2022a); Track 3: chemostratigraphic packages; Track 4: chemostratigraphic units; Track 5: lithological descriptions (Carson et al. 2022a); Track 6–9: well logging data; Track 10: mineral compositions (QXRD_Lab) from QXRD testing; Track 11: compositions from XRF test (XRF); Tracks 12–14: concentrations of Be, Co, Cr, Ga, Gd, Ge, Rb, Sc, Sr, Ti, V and Zr (ppm) from ICP-MS test; Track 15: FIS responses of CH4, C2H6, CO2 and H2S; Track 16–17: first and second principal components from well logs, XRF/ICP, QXRD and FIS data (PC1log, PC1ICP, PC1XRD, PC1FIS, PC2log, PC2ICP, PC2XRD and PC2FIS); Track 18: cumulative petrophysical classes from SOM clustering on the first three principal components from well logs; Track 19: methane and ethane responses from mudlog gas (C1 and C2, ppm), and laboratory measured TOC content (TOC, wt%). W. Sst = Widdallion Sandstone Member.
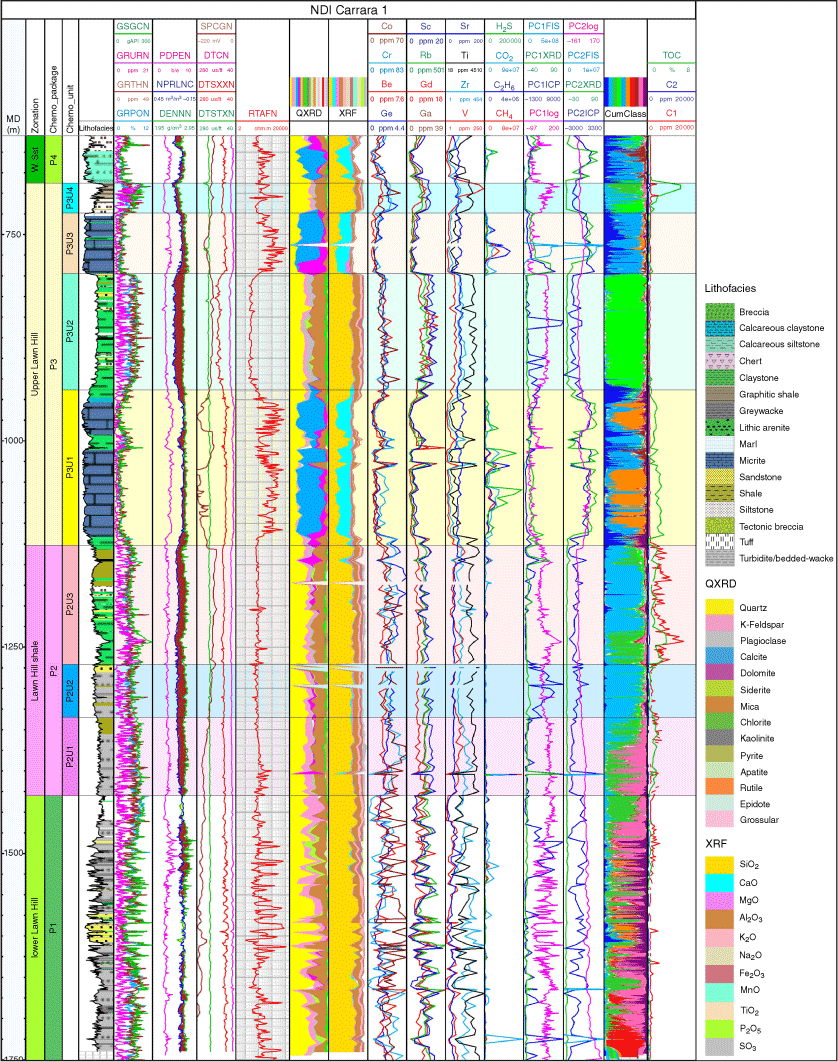
Four hundred and nineteen samples from both the Palaeozoic and Proterozoic successions were tested for inorganic geochemical properties using X-ray fluorescence (XRF)/inductively coupled plasma–mass spectrometry (ICP-MS) methods. The XRF/ICP-MS testing provided the weight percentages of 11 oxides, concentrations of 51 elements, loss on ignition, and total carbon and sulplur (Carson et al. 2021). Four hundred and twenty samples were tested for mineral compositions with quantitative X-ray diffraction (QXRD) techniques, and 18 mineral groups were identified in NDI Carrara 1 (Carson et al. 2022b). Fluid inclusion stratigraphy (FIS) analysis was performed on 428 samples from cuttings and cores (Cowan et al. 2022), providing the responses of 180 components, which have the atomic mass unit from 1 to 180.
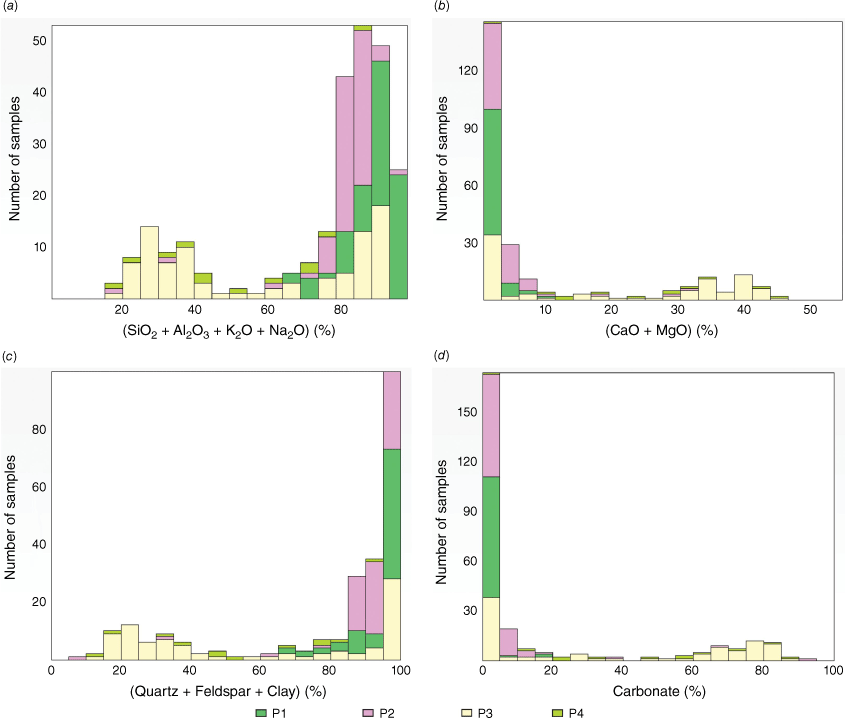
The Lawn Hill Formation is divided into four chemostratigraphic packages based on the vertical variations of lithofacies, inorganic geochemical properties and mineral compositions (Figs 2, 3, Table 1): package 1 (P1, equivalent to the lower Lawn Hill Formation), package 2 (P2, equivalent to the Lawn Hill shale), package 3 (P3, equivalent to the upper Lawn Hill Formation) and package 4 (P4, equivalent to the Widdallion Sandstone Member). P1 has the highest percentage of (SiO2 + Al2O3 + K2O + Na2O), whereas P3 has dual peaks (Fig. 3a). P3 has high content of (CaO + MgO) (Fig. 3b). P4 has different content distributions of clastics (quartz + feldspar + clay) and carbonate from P3 (Fig. 3c, d). The shale-rich intervals are abundant in Be, Ce, Co, Cr, Ga, Ge, Gd, Nb, Rb, Sc, Tb, Ti, V and Zr. The tuffaceous clastics (1430.1–1460 m, P2) have the very low concentrations of V and Sr, and negligible total organic carbon (TOC) content (Fig. 2). Different content distributions of quartz, feldspar, clay minerals and carbonate minerals present the variations of mineral assemblages in the four packages (Fig. 3c, d).
Distributions of (a) (SiO2 + Al2O3 + K2O + Na2O) (%), (b) (CaO + MgO) (%), (c) QFC (quartz + feldspar + clay) (%) and (d) carbonate (calcite + dolomite + siderite) (%) of the four chemostratigraphic packages in the Proterozoic succession in NDI Carrara 1.
| Top | Base | Formation | Package | Unit |
| 630.36 | 687.9 | Widdallion Sandstone | P4 | |
| 687.9 | 723.8 | Upper Lawn Hill | P3 | P3U4 |
| 723.8 | 797.5 | P3U3 | ||
| 797.5 | 938.2 | P3U2 | ||
| 938.2 | 1126.3 | P3U1 | ||
| 1126.3 | 1271 | Lawn Hill shale | P2 | P2U3 |
| 1271 | 1335.5 | P2U2 | ||
| 1335.5 | 1430.1 | P2U1 | ||
| 1430.1 | 1750.82 | Lower Lawn Hill | P1 |
For the purpose of unconventional reservoir evaluation, it is necessary to define the organic-rich shale units inside each chemostratigraphic package. According to the laboratory measured and interpreted TOC content profiles (Butcher et al. 2021; Wang et al. 2023), P1 and P4 have no organic-rich shale, with TOC content ≥1 wt%. Further definition of internal chemostratigraphic units were performed for P2 and P3 through principal component analysis (PCA) on wireline logs, XRF/ICP-MS, QXRD, FIS data and self-organising map (SOM) clustering on the principal components derived from well logs.
Principal component analysis
As an exploratory tool for data analysis, PCA is a popular technique to reduce dimensionality and extract the most from the information. At the same time, this technique minimises information loss and increases the interpretability of a large data set (Jolliffe and Cadima 2015). After normalising the input data, a symmetric covariance matrix is constructed to list the correlations among various input parameters (dimensions). The principal components are identified by computing the eigenvectors and eigenvalues of the covariance matrix. The principal components are the new variables derived from linear combinations or a mixture of initial variables.
The eigenvalues of the covariance matrix are ordered from the largest to smallest, and the first principal component accounts for the largest possible variance in the data set. The first principal component vector indicates the direction of greatest variability in data space. The first few principal components usually make over 95% contribution to the total variance in a data set. This benefit was used to reduce dimensionality and extract most of the variability of the original data set, including data from well logs, inorganic geochemical properties (ICP/XRF), mineral compositions (QXRD) and FIS data. The well log data include GRPON, GRTHN, GRURN, DTCN, DENNN, NPRLNC, PDPEN, DTSXXN, DTDTXN, RTAFN, FEFEN, SPCGN logs and neural network interpreted TOC content (TOCNN (wt%) (Wang et al. 2023).
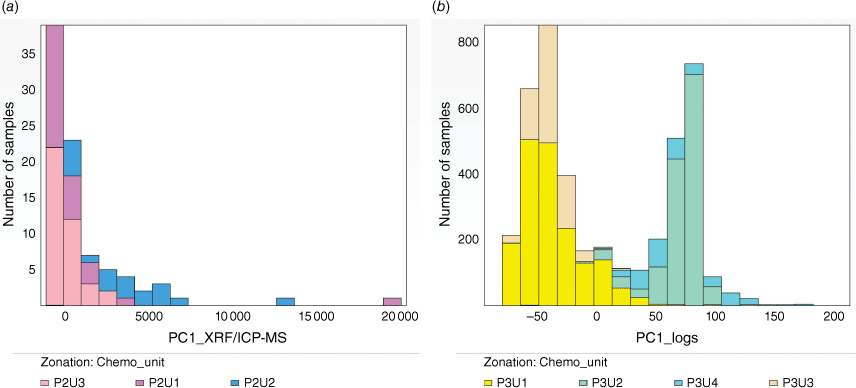
The first three principal components or eigenvectors were selected when they explained over 95% of the total variance of the original data set. Table 2 lists the first three principal components (PC1, PC2 and PC3) derived from well logs, XRF/ICP, QXRD and FIS data. The first principal component contributes 52.1–79% of the total variance in the four data sets (Table 2). This first principal component is therefore used to subdivide the chemostratigraphic packages into internal units.
Self-organising map
A SOM is a two-layer neural network, including both an input and Kohonan layer and using an unsupervised competitive learning technique (Kohonen 1982). The SOM technique has been applied in clustering well logs to derive petrophysical groups or classes (Wang et al. 2022).
In this study, SOM clustering was performed to define 10 petrophysical groups or classes on the first three principal components derived from well logs data with PCA using the Ipsom module in Schlumberger’s TechlogTM platform. The clustered petrophysical classes together with principal components were used to define three and four internal units, respectively inside P2 (P2U1–P2U3) and P3 (P3U1–P3U4) (Table 1, Figs 2, 4). The different distributions of the first principal components for the internal units in P2 and P3 can be clearly distinguished in Fig. 4. The details of chemostratigraphic packages and internal units are listed in Table 2. The following formation evaluation and reservoir characterisation will be based on the defined chemostratigraphic packages and units.
Petrophysical interpretation
This study aimed to derive the mineral compositions, total and gas porosity, permeability and gas content by integrating the well log data and laboratory measurements for characterising the unconventional gas reservoirs in the Proterozoic succession in NDI Carrara 1.
The general form for a linear regression task can be expressed as:
where y is the dependent variable (output), xi(i = 1, …, n) are the independent variables (inputs), wi(i = 1, …, n) are the weights and b is the intercept or bias. The purpose of regression is to find the optimal weights and bias to achieve a reliable relationship model between the input and output variables. The linear multivariate regression (one layer of weights) was used to estimate petrophysical properties (Asquith and Krygowski 2004). However, it is difficult to estimate the parameters where the relationships are complex and non-linear (Wong et al. 1995), such as in the Proterozoic shales in NDI Carrara 1.
As a widely used machine learning approach, the artificial neural networks (ANNs) estimator is a non-linear estimator using multiple layers of weights and biases, which have been applied to estimate hard data, such as laboratory measurements, from seismic attributes, well logs and conceptual geological descriptions in the petroleum domain (Raiche 1991; Wong et al. 1995; Wang et al. 1999, 2021, 2022).
In this study, ANNs were employed to interpret mineral compositions, porosity and permeability from well logs, followed by the interpretations of adsorbed and free gas contents.
Artificial neural networks
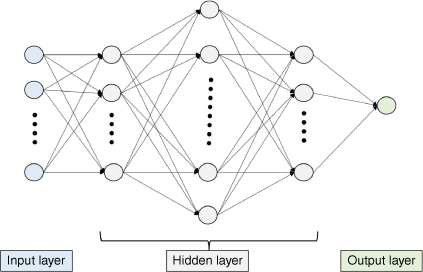
Fig. 5 presents a schematic architecture of ANNs with input, output and three hidden layers (Roberts et al. 2022; Wang et al. 2022). Each layer has a different number of neurons. The input layer imports the input parameters, including the selected well logs and conventional (density and neutron-density crossplot) interpretation results in this study. The neurons from the input to the output layer are connected by weights. During the forward (prediction) process, the input of each neuron in hidden and output layers is a linear combination of neuron outputs in the former layer, while the output is a function (activation function) of the linear combinations. The number of output neurons is dependent on the number of learning targets, such as the laboratorymeasured multiple mineral contents or single porosity target. A loss (error) function is constructed by comparing the approximations with targets. The error committed in the forward (prediction) process is then injected into the network (backpropagation) and updates the network parameters (weights and biases) to perform better in the next iteration (Wong et al. 1995; Mebsout 2020; Roberts et al. 2022).
All the input parameters were normalised to be within [−1, 1], and the output parameters were normalised to be within [0, 1] before neural learning. Mini-batch gradient descent method was used to update network parameters. The training dataset was randomly subdivided into a number of batches, and the error gradient was estimated across a small subset of samples from the training dataset. An adaptive momentum estimation was used to compute adaptive learning rates and avoid oscillations during optimisation by accelerating the descent in the right direction (Mebsout 2020; Roberts et al. 2022).
A grid search approach was used to perform sensitivity analyses and find the optimal hyperparameters of neural networks. The hyperparameters for neural network learning included the number of hidden layers and neurons, selection of activation function (e.g. rectified linear unit (ReLU), hyperbolic tangent (tanh) and sigmoid function), initial learning rate and batch size. The criteria used in neural learning included the mean square error (MSE), mean absolute error (MAE) and correlation coefficient between approximations and targets.
Mineral composition interpretation
Lithology is one of the most important topics in formation evaluation. The logging responses can be sensitive to solid components (minerals), although log data are frequently used to interpret the porosity and fluid saturation. The presence of clays may lower the resistivity, or increase the bulk density or the propagation velocity of acoustic waves besides the conventionally derived gamma ray-based volume of clay. In a conventional approach, a linear system of equations is used to estimate mineral compositions (Schlumberger 2013), which offers a coarse guide to understanding rock compositions. However, the linear system solvers require a set of good-quality log curves and a limited number of minerals to solve, otherwise the problem would be mathematically undetermined. Due to the uncertainties in well logs and the complexity of mineral compositions, it is challenging to describe the mineral assemblage using conventional multi-mineral interpretation by solving a set of linear equations. Thus, ANNs were used to approximate the laboratory measured weight percentages of mineral compositions from well logs in the Proterozoic succession.
Two hundred and fifty-three samples from the Proterozoic succession were analysed via QXRD testing, with 14 mineral groups identified. These include quartz, K-feldspar, plagioclase, calcite group-calcite, dolomite, calcite group-siderite, mica, chlorite, kaolinite-serpentine and pyrite, with the minor contents of apatite, rutile, epidote and grossular groups (Carson et al. 2022b). Table 3 lists the statistics of mineral groups from laboratory measurements. The following groups of minerals – feldspar (K-feldspar and plagioclase groups), clay (mica, chlorite and kaolinite groups), carbonate (calcite, dolomite and siderite groups) and minors (apatite, rutile, epidote and grossular groups) are also listed in Table 3. Mineral carbon (MINC) is the content of inorganic carbon.
| Mineral | Minimum | Maximum | Average | Median |
| Quartz | 0 | 87 | 38.33 | 39 |
| K-feldspar | 0 | 75 | 11.74 | 9.5 |
| Plagioclase | 0 | 24 | 3.92 | 3 |
| Calcite | 0 | 83 | 12.53 | 0 |
| Dolomite | 0 | 94 | 5.38 | 0 |
| Siderite | 0 | 31 | 1.41 | 0 |
| Mica | 0 | 77 | 22.69 | 25 |
| Chlorite | 0 | 9 | 2.24 | 2 |
| Kaolinite | 0 | 7 | 0.28 | 0 |
| Pyrite | 0 | 11 | 1.18 | 0 |
| Apatite | 0 | 10 | 0.18 | 0 |
| Rutile | 0 | 2 | 0.04 | 0 |
| Epidote | 0 | 5 | 0.04 | 0 |
| Grossular | 0 | 2 | 0.02 | 0 |
| Feldspar | 0 | 75 | 15.66 | 15 |
| Carbonate | 0 | 94 | 17.91 | 0 |
| Clay | 0 | 77 | 25.21 | 28 |
| Minors | 0 | 10 | 0.27 | 0 |
| MINC | 0 | 9.4 | 1.83 | 0.33 |
Supplementary Table S1 lists the correlation coefficients between major mineral groups and eight well logs data. Well logs are correlated with the contents of predominant mineral groups with different correlation coefficients (Supplementary Table S1).
In the architecture of neural networks (Fig. 5), 10 input parameters were used: GRPON, GRTHN, GRURN, DTCN, DENNN, NPRLNC, PDPEN, RTAFN, FEFEN and SPCGN logs (Fig. 2). Two interpretation runs were conducted to produce different output parameters using ANNs with mini-batch gradient descent. The output parameters of the first interpretation run included the contents of feldspar (K-feldspar and plagioclase), carbonate (calcite, dolomite and siderite), clay (mica, chlorite and kaolinite), minors (apatite, rutile, epidote and grossular) and inorganic carbon (MINC). The output parameters of the second interpretation run were the laboratory measured contents (wt%) of 14 mineral groups (QXRD_Lab in Fig. 2). The training patterns with both the well logs and QXRD testing results were constructed for each set of trainings. A randomly selected 20% of training patterns were used as testing patterns.
After the sensitivity analysis that used a grid search approach, the hyperparameters of the best neural network models of both runs for mineral composition interpretation are listed in Table 4. Supplementary Table S2 lists the correlation coefficients between the laboratory measured and neural network interpreted contents of mineral compositions.
| Hyperparameter | Mineral composition | Petrophysical property | |||
| Run 1 | Run 2 | Total porosity | Gas porosity | Logarithmic permeability | |
| Hidden layers | (32, 64, 32) | (32, 64, 32) | (32, 64) | (32, 32) | (32, 64) |
| Activation function | ReLU | ReLU | ReLU | ReLU | ReLU |
| Initial learning rate | 0.01 | 0.01 | 0.01 | 0.006 | 0.002 |
| Batch size | 6 | 6 | 1 | 2 | 2 |
| MSE for test data | 0.01 | 0.091 | 0.01 | 0.073 | 0.008 |
| MAE for test data | 0.07 | 0.053 | 0.075 | 0.241 | 0.071 |
| Maximum interation number | 200 | 200 | 200 | 100 | 100 |
The results of the neural network interpreted mineral compositions correlated highly with the laboratory measurements. The curves indicate the main variation trends of different mineral groups, and they correspond to the variations in lithological sequence and well logs (Fig. 6). The interpreted contents of 14 mineral contents were merged as an array data of QXRD_NN. Fig. 6 shows QXRD_NN and the contents of quartz, feldspar, carbonate, clay, minor minerals and MINC.
Mineral compositions from QXRD testing and ANN interpretations, including the laboratory measured and interpreted assemblages (QXRD_LAB and QXRD_NN), the contents of quartz (Quartz and QuartzFInt, wt%), feldspar content (Feldspar and FeldsparInt, wt%), carbonate (Carbonate and CarbonateInt, wt%), clay (Clays and ClayInt, wt%), minor minerals (Minors and MinorsInt, wt%) and inorganic carbon (MINC and MINCInt, wt%).
There was a high correlation between the interpreted contents of the predominant minerals and laboratory measurements. It was difficult for neural networks to learn the underlying relationships for those low-content or minor minerals (particularly the zero contents). This resulted in lower correlation coefficients between approximations and laboratory measurements. The content of low-content (minor) minerals were interpreted again using the same input parameters, but neural networks were trained separately with one output parameter, i.e. content of each low-content mineral.
The brittleness index (unitless) was estimated from the interpreted mineral contents of quartz, calcite and clay minerals (Jarvie et al. 2007) as:
where wQuartz, wCalcite and wClay are the contents of quartz, calcite and clay (wt%).
Porosity and permeability interpretation
It is a challenge to interpret the total porosity in shale reservoirs with low porosity, ultra-low permeability, and high content of organic matter and clay minerals. In Wang et al. (2023), the TOC content was interpreted from well logs using ANNs for the Proterozoic succession in NDI Carrara 1. The net shale or organic-rich shale was identified where TOC content was more than 1 wt%. Bulk density logs were used to estimate the total porosity for shales by removing the kerogen effect on density logs and adding organic porosity estimated from TOC content and thermal maturity analysis. The correlation coefficient between the laboratory measured and interpreted total density porosity was 0.3912. However, it is difficult to estimate the permeability from well logs using conventional interpretation or linear regression. This study used neural networks and aimed to integrate the well logs, previously interpreted petrophysical properties, TOC content and laboratory measurements to improve the total porosity interpretation and to approximate the gas porosity and logarithmic permeability for the Proterozoic succession in NDI Carrara 1.
Thirty-two core plug samples of different rock types extracted from the Proterozoic succession in NDI Carrara 1 were tested for petrophysical properties in a CSIRO lab (Bailey et al. 2022b), including:
Dry bulk density together with the core imaging through medical X-ray Computerised Tomography technology.
Grain density measured from powders (ground from dry core plugs) with a helium gas displacement pycnometer.
Total porosity calculated from the derived dry bulk density and grain density.
Gas porosity tested on dry core plugs through gas (nitrogen and helium) expansion.
Permeability measured with gas (helium and nitrogen) injection for the samples with a permeability of higher than 1 μD. Ultra-low permeability (<1 µD) samples were tested with an unsteady state pulse decay method.
During the testing processes with nitrogen gas, all 32 samples were first tested for gas porosity and permeability along the normal direction or tilt to bedding (vertical), and seven laminated samples were selected from the 32 samples and tested for permeability along the direction parallel to bedding (horizontal). The measured horizontal permeability results are approximately 10 times that of their vertical results. The dry bulk density, grain density, total porosity and nitrogen porosity are from the samples with the same sampling depths.
Helium gas porosity and permeability were tested on 20 samples with the sample locations near the samples for nitrogen testing. Helium permeability testing was conducted along the direction parallel to the bedding. For the purpose of well log interpretation, 32 laboratory measurements for total and gas porosity and horizontal permeability were compiled from helium gas testing results (20 samples) plus part of the nitrogen testing results (12 samples) where helium gas tests were not conducted.
Table 5 lists the statistics of laboratory measured porosity and permeability of 32 samples from the Proterozoic succession. The gas porosity occupies a small portion of total porosity.
Supplementary Table S3 lists the correlation coefficients (R2) between the laboratory measured petrophysical properties, well logs, conventional (density and neutron-density crossplot) interpretation results. Well logs and conventional interpretation results correlate to some extent with laboratory measured porosity and permeability, particularly between the interpreted and laboratory measured total porosity. ANNs were used to interpret total and gas porosity and logarithmic permeability by using the conventional wireline logs and previous interpretation results (Wang et al. 2023) (Supplementary Table S3) as the input parameters (Fig. 5).
The sampling depths of total porosity were slightly different from those samples for helium porosity and permeability testing. Two neural network interpretation runs were performed for different output parameters. One used the laboratory measured total porosity (%) as the output or target parameter. The other was constructed for interpreting gas porosity (%) and logarithmic horizontal permeability (mD). Thirty-two training patterns were constructed, respectively for each interpretation run using laboratory measurements.
It is hard to construct statistically effective testing data from a limited number of training patterns, and this makes it a challenge for running linear or non-linear regression. The use of a limited number of available data may result in overfitting of training data and poor performance of testing data. In this study, the neural network approach with stochastic gradient descent was used to interpret the porosity and permeability from well logs using the randomly selected four training patterns for testing purpose. The predominant rock types of the laboratory tested samples included black shale, limestone, siltstone and bedded turbidite. Stratified random sampling was used to sample the testing data from each of the four rock type groups. The neural network training was conducted with an elaborate sensitivity analysis. The evaluation of the performance of neural network learning was based on errors (MSE and MAE), correlation coefficients between approximations and targets, and geological interpretability.
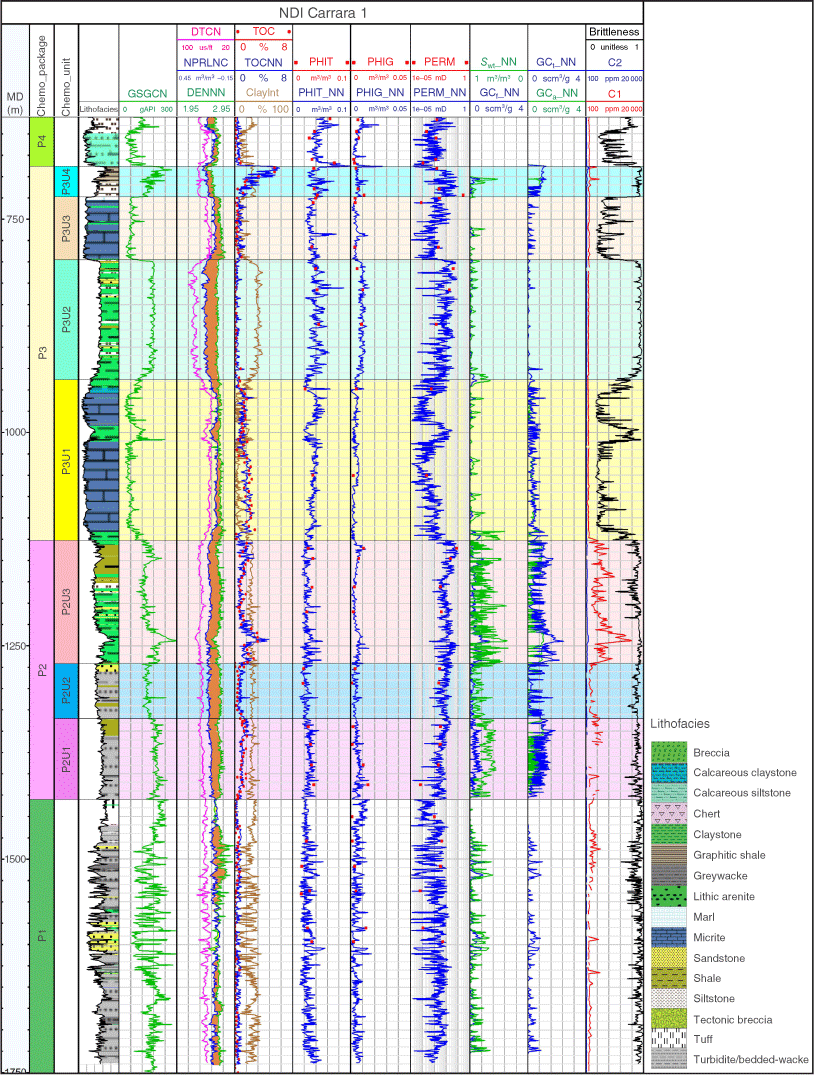
The hyperparameters of the best neural network models for interpreting total and gas porosity and logarithmic permeability are listed in Table 4. Table 6 lists the MAE, MSE and correlation coefficients between the approximations and targets of all the available data (training and testing data) in the best neural network models. The approximations from the best neural network models have high correlation coefficients (R2) with targets (Table 6). The interpreted total and gas porosity and logarithmic permeability curves (PHIT_NN, PHIG_NN and PERM_NN, Fig. 7) present the reasonable vertical distributions, corresponding to the vertical variations in the lithological sequence, well logs, laboratory measured and interpreted TOC contents.
| MSE | MAE | R2 | |
| Total porosity (%) | 0.0262 | 0.1386 | 0.7467 |
| Gas porosity (%) | 0.0116 | 0.0635 | 0.7516 |
| Logarithmic permeability (mD) | 0.0117 | 0.0818 | 0.7214 |
MSE, mean square error; MAE, mean absolute error; R2, correlation coefficient.
Petrophysical property interpretation results in NDI Carrara 1, including the laboratory measured and interpreted total porosity (PHIT and PHIT_NN,%); gas porosity (PHIG and PHIG_NN,%); permeability (PERM and PERM_NN, mD); total water saturation (Swt_NN, m3/m3); free, adsorbed and total gas content (GCf_NN, GCa_NN and GCt_NN, cm3/g); brittleness index (Brittleness, unitless); methane and ethane responses in mudlog gas profile (C1 and C2, ppm).
Gas content
Shale gas is a type of unconventional natural gas that is trapped within very tight and extremely low permeability shale source rocks. A small amount of gas is dissolved in kerogen, asphaltene, liquid hydrocarbon and formation water, whereas the majority of natural gas exists as free gas and adsorbed gas (Cipolla et al. 2013).
The adsorbed gas content (GCa) is a surface component with the gas physically adsorbed on the large surface area of the micropores in organic matter and clay minerals (Langmuir 1918; Ambrose et al. 2010). Sorption isotherm measurements are generally used to quantify GCa by establishing an equilibrium adsorption isotherm. Four shale samples were tested for methane adsorption and desorption isotherms using the CSIRO High Pressure Temperature adsorption rig (Lupton and Heryanto 2022) to determine the gas storage capacity (GCa) (Table 7). GCa (cm3/g) is positively correlated with the laboratory measured TOC and clay contents in the Proterozoic shales (Fig. 8), and a linear regression was performed on the three parameters.
| Depth range | Langmuir parameter | 1136–1136.2 m | 690.3–690.5 m | 1210.32–1210.4 m | 1344.83–1345.03 m |
| TOC content (wt%) | 1.55 | 5.482 | 0.43 | 1.46 | |
| Clay content (wt%) | 39 | 29 | 19 | 30 | |
| Adsorption | VL | 1.68 | 3.33 | 0.46 | 1.89 |
| PL | 7.02 | 13.3 | 3.15 | 11.8 | |
| Desorption | VL | 1.81 | 3.65 | 0.59 | 2.1 |
| PL | 8.28 | 16.2 | 8.3 | 14.1 | |
| Reservoir pressure (MPa) | 12.21 | 7.39 | 13.02 | 14.47 | |
| Gas content from adsorption test (cm3/g) | 1.07 | 1.19 | 0.37 | 1.04 | |
| Gas content from desorption test (cm3/g) | 1.08 | 1.14 | 0.36 | 1.06 |
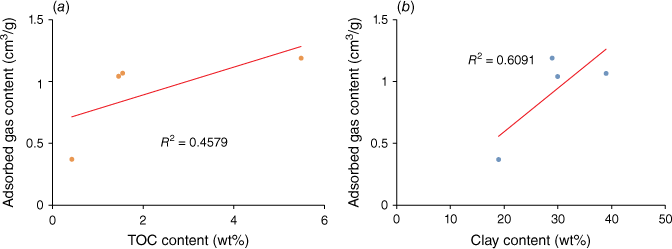
The relationship between GCa (cm3/g) and the TOC and clay contents for all four isotherm testing samples was constructed as follows:
The linearly estimated GCa has the correlation coefficient (R2) of 0.8933 with the laboratory measurements.
In this study, Eqn 3 was used to estimate the GCa_NN, cm3/g from the neural network interpreted TOCNN and clay contents interpreted for the organic-rich shales in the Proterozoic shales.
The resistivity of mud filtrate is 0.063 Ωm@25°C, and formation water resistivity was estimated from the resistivity ratio method with the resistivity of the mud filtrate, flushed zone and true formation (Asquith and Krygowski 2004). Total water saturation was estimated from total porosity, formation true resistivity and volume fraction of shale using the dual water equation in Schlumberger’s TechlogTM platform (Schlumberger 2013). The total water saturation (Swt_NN) was computed with the Levenberg–Marquardt algorithm iteration in Techlog™, and hence, the total gas saturation (Sgt_NN) was calculated as:
Free gas content (GCf_NN, cm3/g at standard conditions) was calculated using the following equations (Ambrose et al. 2010):
where ϕt is the neural network interpreted total porosity (m3/m3); Swt_NN is the total water saturation (m3/m3); ϕt × (1 − Swt) is the bulk gas volume (m3/m3); ρb is the bulk density of shale rock (g/cm3); Bg is the gas formation volume factor (Vreservoir/Vsurface, and only methane was considered in this study); M̂ is the molecular weight of methane (g/mol) (M̂ = 16.04 g/mol); ρs is the density of adsorbed gas (g/cm3) (Ambrose et al. 2010); GCa is the adsorbed gas content (cm3/g). Gas formation volume factor (Bg) was estimated using the compressibility of methane as:
where z is the methane compressibility factor, which was estimated using Peng–Robinson’s equation-of-state (Peng and Robinson 1976); P (bar) and T (°K) are the formation pressure and temperature.
Total gas content (GCt_NN, cm3/g) is the sum of free and adsorbed gas contents. Fig. 7 presents the interpreted porosity and gas contents of the Proterozoic shale reservoirs.
Shale gas reservoir characterisation
Reservoir characterisation was conducted on the chemostratigraphic packages and internal units (Table 1, Fig. 2). Petrophysical interpretation results of the Proterozoic succession in NDI Carrara 1 (Figs 6, 7) were summarised in the supplementary tables for the four chemostratigraphic packages (Supplementary Table S4), organic-rich shales in P2 and P3 (Supplementary Table S5), tight non-organic-rich rocks in P1, P2 and P3 (Supplementary Table S6), organic-rich shales of internal units in P2 (Supplementary Table S7) and P3 (Supplementary Table S8). The reservoir properties in the supplementary tables include the averages of petrophysical properties, thickness of formation (Gross_thickness, m) and organic-rich shales (Net_shale, m).
Supplementary Table S4 lists the average contents of TOC and mineral compositions, petrophysical properties and gas concentrations from mudlog gas in different packages of the Proterozoic succession. Compared to P3 and P4, P1 and P2 have higher contents of quartz, feldspar and clay minerals; lower contents of carbonate minerals; higher gas saturation, permeability and brittleness index; and higher mudlog gas responses.
The predominant organic-rich (net) shales are present in packages 2 and 3 (Fig. 7). The organic-rich shales in P2 have higher gas saturation, permeability, free and adsorbed gas contents and favourable brittleness indices compared to P3 (Supplementary Table S5). The net shale thickness values of P2 and P3 are 150.3 m and 166.6 m, respectively.
Besides organic-rich shales, tight non-organic-rich gas reservoir rocks (TOC content < 1.0 wt% and Sgt > 0) are also present in the Proterozoic succession. These include tight siltstones, clayey siltstone and shales. Supplementary Table S6 presents the average contents of mineral compositions, porosity, permeability (geometric mean), total gas saturation, brittleness index and mudlog gas concentrations for the tight non-organic-rich gas reservoir (TOC content < 1.0 wt% and Sgt > 0). P1 has no significant organic-rich shales, but it has the presence of tight non-organic-rich gas reservoirs with the interpreted non-zero gas saturation, permeability, and brittleness index, and it corresponds qualitatively to the gas peaks in the mudlog gas profile (Fig. 7). No significant hydrocarbon-bearing reservoirs were interpreted for organic-rich shales or tight non-organic-rich reservoirs in P4.
Supplementary Table S7 presents the fine characterisation for internal units in package 2. Compared to the units P2U1 and P2U3, P2U2 has lower gas saturation, gas contents and net shale thickness of 13.5 m. P2U3 has the highest porosity, gas saturation, total gas content and permeability correspond to the highest gas responses in mudlog gas profile (Supplementary Table S7, Fig. 7). The net shale thickness of P2U1 and P2U3 is 53.5 and 83.3 m, respectively.
In P3, P3U1 and P3U3 units consist predominantly of micrite, marl and calcareous shale, while P3U2 and P3U4 comprise mainly siltstone and claystone. The net shale thickness of P3U2 or P3U3 is insignificant (<2 m). P3U1 has thick organic-rich source rocks but lower gas saturation, free and total gas content, permeability and brittleness than P3U4 (Supplementary Table S8). The low gas saturation and free gas content in the organic-rich rocks in P3U1 and the limited net shale thickness of P3U2 and P3U3 correspond to the low gas responses in the mudlog gas profile (Fig. 7). P3U4 has favourable average gas saturation and free gas content with a net shale thickness of 35.9 m.
Summary and conclusions
Chemostratigraphic packages and internal units have been defined according to the variations and distributions of well logs, inorganic geochemical properties, mineral compositions and FIS parameters in the Proterozoic succession intersected by the deep stratigraphic drill hole NDI Carrara 1. ANNs have been used to interpret the mineral composition, porosity and permeability from well logs, integrating previously interpreted and laboratory measurements of TOC content, mineral composition, porosity and permeability as well as isotherm adsorption testing results. Total water saturation, total gas saturation and free gas content have been estimated using the interpreted total porosity and formation true resistivity in the TechlogTM platform. GCa is estimated from the contents of TOC and clay minerals through linear regression. The main results and conclusions are:
The first three principal components, particularly the first principal component, contributes to most of the total variance. The PCA and SOM techniques are beneficial for defining internal chemostratigraphic units in the shale-rich packages.
Package 2 has the highest potential for future unconventional shale gas development among all the chemostratigraphic packages analysed in this study.
P2U1 and P2U3 units have the most favourable petrophysical properties for organic-rich shales among all the chemostratigraphic units. This includes elevated free, adsorbed and total gas contents as well as favourable permeability and brittleness, with a net shale thickness of 53.5 and 83.3 m, respectively, which are critical for shale gas development. P3U4 has favourable organic-rich shale, including high gas saturation and porosity; free, adsorbed and total gas contents; and favourable permeability and brittleness index. High gas responses in mudlog gas profile verify qualitatively the high hydrocarbon potential in the shale units of P2U1, P2U3 and P3U4. P3U1 has thick organic-rich source rocks with high interpreted adsorbed gas content but low free gas content, permeability and brittleness.
Besides the organic-rich shales, the tight non-organic-rich siltstone, clayey siltstone and shale gas reservoirs are represented in P1 with the interpreted gas saturation and permeability.
Data availability
The laboratory testing data supporting this study are freely available at GA’s eCat system: XRF/ICP-MS: https://ecat.ga.gov.au/geonetwork/srv/eng/catalog.search#/metadata/145954. QXRD: https://ecat.ga.gov.au/geonetwork/srv/eng/catalog.search#/metadata/146141. Fluid inclusion stratigraphy: https://ecat.ga.gov.au/geonetwork/srv/eng/catalog.search#/metadata/147067. Petrophysics: http://ecat.ga.gov.au/geonetwork/srv/eng/catalog.search#/metadata/147234. The wireline log dataset is freely available from GA’s Data Discovery Portal (https://portal.ga.gov.au/bhcr/minerals/648482).
Acknowledgements
The authors would like to thank Steve Abbott and Duy Nguyen for internal peer reviews at GA. The authors would also like to thank the NTGS for their support and collaboration. This paper is published with the permission of the CEO, GA.
References
Ambrose RJ, Hartman RC, Diaz-Campos M, Akkutlu IY, Sondergeld CH (2010) New Pore-scale Considerations for Shale Gas-in-Place Calculations. SPE 131772, Presented at the SPE Unconventional Gas Conference held in Pittsburgh, 23–25 February 2010, PA, USA.Asquith G, Krygowski D (2004) Basic well log analysis. AAPG Methods in Exploration Series, No. 16. (American Association of Petroleum Geologists)
ASUD (2022) Australian Stratigraphic Units Database. Available at https://asud.ga.gov.au/search-stratigraphic-units/results/10261 [verified 31 January 2023]
Bailey AHE, Wang L, Grosjean E, Carson CJ, Butcher G, Jarrett AJ, Henson P (2022a) New geomechanical and petrophysical data from NDI Carrara 1; implications for Carrara Sub-basin unconventional prospectivity. In ‘Central Australian Basins Symposium IV (CABS IV) proceedings’, 29–30 August 2022, Darwin, NT. (Northern Territory Geological Survey: Darwin)
Bailey AHE, Wang L, Carson CJ, Dewhurst DN, Esteban L, Kager S, Monmusson L, Crombez V, Delle Piane C, Nguyen D, Henson PA (2022b) ‘Exploring for the Future petrophysical testing program data release, NDI Carrara 1, Carrara Sub-basin, Australia’. (Geoscience Australia Record: Canberra) http://pid.geoscience.gov.au/dataset/ga/147234 [verified 31 January 2023]
Butcher G, Grosjean E, Jarrett AJ, Boreham CJ, Jinadasa N, Webster T, Hong Z, Carson CJ (2021) ‘Exploring for the Future - Rock-Eval pyrolysis data from NDI Carrara 1, South Nicholson region, Australia: Data Release Record 2021/26.’ (Geoscience Australia: Canberra)
| Crossref | [verified 31 January 2023]
Carr LK, Southby C, Henson PA, Costelloe R, Anderson JR, Jarrett AJM, Carson CJ, MacFarlane S, Gorton J, Hutton L, Troup A, Williams B, Khider K, Bailey AHE, Fomin T (2019) ‘Exploring for the Future: South Nicholson Basin Geological summary and seismic data interpretation’. Record 2019/021. (Geoscience Australia)
Carson CJ, Main P, Champion DC, Grosjean E, Butcher G, Gilmore S, Henson PA (2021) ‘Exploring for the Future – Whole rock inorganic geochemistry data release of NDI Carrara 1, South Nicholson region, Northern Territory’. Record 2021/32. (Geoscience Australia: Canberra)
| Crossref |
Carson CJ, Kositcin N, Henson PA, Delle Piane C, Crombez V, Grosjean E, Jarrett AJM, Butcher G (2022a) Exploring for the Future - SHRIMP U–Pb zircon geochronology from NDI Carrara 1 and implications for regional stratigraphic correlations, resource potential and geological evolution of the Carrara Sub-basin. In ‘Annual Geoscience Exploration Seminar (AGES) 2022 Proceedings’, Alice Springs, NT. pp. 27–36. (Northern Territory Geological Survey: Darwin)
Carson CJ, Grosjean E, Butcher G, Webber S, Gilmore S, Henson PA (2022b) ‘Exploring for the Future – Quantitative X-ray diffraction data release of NDI Carrara 1, South Nicholson region, Northern Territory’. Record 2022/05. (Geoscience Australia)
Cipolla CLL, Lolon EPP, Erdle JCC, Rubin B (2013) Reservoir modeling in shale-gas reservoirs. SPE Reservoir Evaluation & Engineering 13, 638–653.
| Reservoir modeling in shale-gas reservoirs.Crossref | GoogleScholarGoogle Scholar |
Cowan S, Boreham C, Carson C, Hall D, Chao J, Phiukhao W, Lishansky R, Moore R, Groves D (2022) ‘Stratigraphic Reconstruction of Bulk Volatile Chemistry from Fluid Inclusions in: NDI Carrara 1.’ (Geoscience Australia: Canberra) Available at http://pid.geoscience.gov.au/dataset/ga/147067
Crombez, V, Delle Piane, C, Dewhurst, D (2022) NDI Carrara 1 sedimentology, microstructural analyses, and sequence stratigraphy - FINAL REPORT. (Geoscience Australia: Canberra)
| Crossref | [verified 31 January 2023]
Geoscience Australia (2021) Borehole Completion Report - NDI Carrara 1. Retrieved from https://portal.ga.gov.au/bhcr/minerals/648482 [verified 31 January 2023]
Grosjean E, Jarrett A, Boreham C, Butcher G, Carson C, Bailey A, Wang L, Munson T, Henson P (2022) The energy resource potential of the Carrara Sub-basin revealed by new stratigraphic drilling. In ‘Annual Geoscience Exploration Seminar (AGES) 2022 Proceedings’, Alice Springs, NT. (Ed. Northern Territory Geological Survey) pp. 75–83. (Northern Territory Geological Survey: Darwin)
Jarvie DM, Hill RJ, Ruble TE, Pollastro RM (2007) Unconventional Shale-Gas Systems: The Mississippian Barnett Shale of North-Central Texas as One Model for Thermogenic Shale-Gas Assessment. AAPG Bulletin 91, 475–499.
| Unconventional Shale-Gas Systems: The Mississippian Barnett Shale of North-Central Texas as One Model for Thermogenic Shale-Gas Assessment.Crossref | GoogleScholarGoogle Scholar |
Jolliffe IT, Cadima J (2015) Principal component analysis: a review and recent developments. Philosophical Transactions of Royal Society A (Mathematical, Physical and Engineering Sciences) 374, 20150202
| Principal component analysis: a review and recent developments.Crossref | GoogleScholarGoogle Scholar |
Kohonen T (1982) Self-Organized Formation of Topologically Correct Feature Maps. Biological Cybernetics 43, 59–69.
| Self-Organized Formation of Topologically Correct Feature Maps.Crossref | GoogleScholarGoogle Scholar |
Langmuir I (1918) The Adsorption of Gases on Plane Surfaces of Glass, Mica and Platinum. Journal of the American Chemical Society 40, 1361–1403.
| The Adsorption of Gases on Plane Surfaces of Glass, Mica and Platinum.Crossref | GoogleScholarGoogle Scholar |
Lupton N, Heryanto, D (2022) ‘Adsorption and desorption isotherms from shales in NDI Carrara 1, Northern Territory.’ (Geoscience Australia: Canberra) Available at http://pid.geoscience.gov.au/dataset/ga/147246 [verified 31 January 2023]
Madden RHC, Carson C, Tilbury RD (2022) ‘Exploring for the Future - Petrology of selected volcaniclastic intervals from NDI Carrara 1, South Nicholson region, Northern Territory.’ (Geoscience Australia: Canberra) http://pid.geoscience.gov.au/dataset/ga/147278 [verified 31 January 2023]
Mebsout I (2020) Deep learning’s mathematics. Available at https://towardsdatascience.com/deep-learnings-mathematics-f52b3c4d2576 [verified 31 January 2023]
Peng D-Y, Robinson DB (1976) A new two-constant equation of state. Industrial & Engineering Chemistry Fundamentals 15, 59–64.
| A new two-constant equation of state.Crossref | GoogleScholarGoogle Scholar |
Raiche A (1991) A Pattern Recognition Approach to Geophysical Inversion using Neural Nets. Geophysical Journal International 105, 629–648.
| A Pattern Recognition Approach to Geophysical Inversion using Neural Nets.Crossref | GoogleScholarGoogle Scholar |
Roberts D, Yaida S, Hanin B (2022) ‘The Principles of Deep Learning Theory: An Effective Theory Approach to Understanding Neural Networks.’ (Cambridge University Press: Cambridge)
| Crossref |
Schlumberger (2013) ‘ Schlumberger Log Interpretation Charts’. 2013 Edition. (Schlumberger Wireline and Testing: TX, USA)
Wang L, Wong PM, Kanevski M, Gedeon TD (1999) Combining neural networks with kriging for stochastic reservoir modeling. In situ 23, 151–169.
Wang L, Edwards DS, Bailey A, Carr LK, Boreham CJ, Grosjean E, Normore L, Anderson J, Jarrett AJM, McFarlane S, Southby C, Carson C, Khider K, Henson P (2021) Petrophysical and geochemical interpretations of well logs from the pre-Carboniferous succession in Barnicarndy 1, Canning Basin, Western Australia. The APPEA Journal 61, 253–270.
| Petrophysical and geochemical interpretations of well logs from the pre-Carboniferous succession in Barnicarndy 1, Canning Basin, Western Australia.Crossref | GoogleScholarGoogle Scholar |
Wang L, Bailey A, Carr LK, Edwards DS, Khider K, Anderson J, Boreham CJ, Southby C, Dewhurst D, Esteban L, Munday S, Henson P (2022) Petrophysical characterisation of the Neoproterozoic and Cambrian successions in the Officer Basin. The APPEA Journal 62, 381–399.
| Petrophysical characterisation of the Neoproterozoic and Cambrian successions in the Officer Basin.Crossref | GoogleScholarGoogle Scholar |
Wang L, Bailey AH, Grojean E, Carson C, Carr LK, Butcher G, Boreham C, Southby C, Henson PA (2023) Data analysis and interpretation of well logs in NDI Carrara 1, Northern Territory. In ‘Australasian Exploration Geoscience Conference (AEGC) 2023 Extended Abstracts’, 13–18 March 2023, Brisbane, Qld. (Australian Society of Exploration Geophysicists)
Wong PM, Jian FX, Taggart IJ (1995) A critical comparison of neural networks and discriminant analysis in lithofacies, porosity and permeability predictions. Journal of Petroleum Geology 18, 191–206.
| A critical comparison of neural networks and discriminant analysis in lithofacies, porosity and permeability predictions.Crossref | GoogleScholarGoogle Scholar |

Liuqi Wang is a Well Analyst at Geoscience Australia (GA) working in the Minerals, Energy and Groundwater Division. He received his PhD in Petroleum Engineering and worked as a Research Fellow at the University of New South Wales before joining GA. Liuqi is a member of PESA and the European Association of Geoscientists and Engineers. |

Adam H. E. Bailey is a Petroleum Geoscientist at GA, with expertise in petroleum geomechanics, structural geology and basin analysis. He graduated with PhD in 2016 from the Australian School of Petroleum at the University of Adelaide. Adam is currently part of the Onshore Energy Systems team at GA, where he currently works on the Exploring for the Future (EFTF) program. |

Emmanuelle Grosjean is an Organic Geochemist at GA working in the Minerals, Energy and Groundwater Division. Emmanuelle applies organic geochemistry to assess the hydrocarbon prospectivity of Australia’s offshore and onshore sedimentary basins. Emmanuelle holds a doctorate degree in Organic Chemistry from the University of Strasbourg, France. Before joining GA in 2005, she worked on the Precambrian petroleum systems of the South Oman Salt Basin as a Postdoctoral Associate at the Massachusetts Institute of Technology. |

Chris Carson has worked in Antarctica, Canadian Arctic, Alaska, New Caledonia and northern and central Australia, specialising in metamorphic petrology, geochronology and structural geology. Joining GA in 2006, he dabbled in Sensitive High Resolution Ion Microprobe geochronology and, in 2017, joined the Onshore Energy program, working in the South Nicholson region of the Northern Territory. |

Lidena K. Carr is a Geoscientist for the Onshore Energy Systems project within the Resources Division at GA. She graduated from the Australian National University (ANU), majoring in Geology and Human Ecology, with a BA/BSc (Hons) in 2004 and began working as a Technical Officer at the Research School of Earth Sciences (ANU). In 2007, she joined GA with the then ACRES (satellite imagery). In 2009, she moved to the then Onshore Energy and Mineral Division to work as a Seismic Interpreter and Basin Analyst. Currently she is the acting Director of the Onshore Energy Systems directorate, working on the EFTF program. She is member of PESA and the Geological Society of Australia. |

Grace Butcher is a Geologist at GA. She graduated with a BSc (Hons) in 2010 from the School of Earth and Environment at the University of Leeds. Working with the Onshore Energy Systems team at GA, Grace is currently working on the flagship EFTF program in Northern Australia, specifically the National Drilling Initiative Carrara 1 drill hole and the newly discovered Carrara Sub-basin. |

Christopher J. Boreham is a Principal Organic Geochemist at GA, working in the Minerals, Energy and Groundwater Division. He obtained a PhD in Chemistry at ANU. Chris applies his skills to understand the evolution of petroleum and abiogenic gas in Australian basins. Chris is a member of PESA and the American Association of Petroleum Geologists. |

Dave Dewhurst is a Chief Research Scientist at CSIRO Energy in Perth. He holds a BSc (Hons) in Geology from the University of Sheffield (UK) and a PhD in Physics from the University of Newcastle Upon Tyne (UK). He previously held post-doctoral positions at the University of Birmingham (UK), the University of Newcastle upon Tyne (UK), the Institut Français du Pétrole near Paris and the Imperial College, London, before moving to CSIRO in 1998. He works on mechanical and physical properties of rocks for petroleum exploration and development, specialising in overburden and gas shales, as well as reservoir and seal evaluation for geological storage of carbon dioxide (CO2) and other gases. |

Lionel Esteban holds a PhD in Applied Geophysics, Magnetic Environment and Petrophysics from joint French Universities (University Paul Sabatier-Toulouse and University of Strasbourg, EOST and Institut de Physique du Globe, IPG) and the French Nuclear Waste Management (ANDRA). Lionel is currently a Principal Petrophysicist at CSIRO (Perth, Western Australia), a member of the Society of Petrophysicists and Well Log Analysts and the Society of Petroleum Engineers, and an Academic Editor for the journal Geofluids. He develops and tests petrophysical experimental laboratory approaches and integrates them to log analyses to characterise and understand the physical properties and responses of unconventional and conventional reservoirs at different scales, using a wide spectrum of petrophysical tools, including X-ray imaging, electrical, nuclear magnetic resonance, mechanical and core flooding under (or not) high pressure or high temperature. His current research focuses on low permeability reservoirs to understand clay mineral relationships, hydrocarbon storage and sealing capacity; CO2–rock interactions and core flooding in carbonates; and drilling mud effects on rock properties in conventional reservoirs. |

Chris Southby is a Geoscientist in the GA Resources Division, Energy Systems Branch. He completed his Honours at ANU in 2004 on palaeo-climate geochemistry of corals from Papua New Guinea. Since joining GA in 2008, he has contributed to a number of projects, including the National Carbon Mapping and Infrastructure Plan, the Vlaming Sub-basin CO2 Storage Assessment and the Houtman Sub-basin Prospectivity Project. He is now part of the Onshore Energy Systems team at GA, currently working under the EFTF project initiative. |

Paul A. Henson graduated from the University of Tasmania and is currently the Director of the Onshore Energy Systems Section at GA. He has extensive experience in the minerals sector, working on mineral systems in Proterozoic and Archaean terranes. Since 2010, he led the Australian Government's onshore carbon storage program, undertaking deep onshore drilling and seismic acquisition programs in collaboration with the states and industry. In addition, he now manages the EFTF – Energy Program, leading a team of researchers to acquire new pre-competitive geoscientific data to improve our understanding of the oil and gas potential of Australian onshore basins. |